What The Science Says:
Trying to blame global warming on planetary movements is little more than 'climastrology' and curve fitting. There is no physical evidence that planetary movements influence the Earth's temperature.
Climate Myth: It's planetary movements
"The solar system oscillates with a 60-year cycle due to the Jupiter/Saturn three-synodic cycle and to a Jupiter/Saturn beat tidal cycle...About 60% of the warming observed from 1970 to 2000 was very likely caused by the above natural 60-year climatic cycle during its warming phase" (Loehle and Scafetta)
In a paper published in The Bentham Open Atmospheric Science Journal, two "skeptics", Loehle and Scafetta (L&S), perform a curve fitting exercise, trying to match global temperature changes using a very simple model involving cycles which they claim are caused by planetary movements. L&S describe their methodology in the paper:
"The model was fit by nonlinear least squares estimation using Mathematica functions, with phase and amplitude free but period fixed as above."
In other words, they let the parameters vary freely without any physical constraints, and fit the curve as best they could. They suggest the first two terms represent astronomical cycles:
"The solar system oscillates with a 60-year cycle due to the Jupiter/Saturn three-synodic cycle and to a Jupiter/Saturn beat tidal cycle"
How exactly these Jupiter and Saturn orbital cycles are supposed to impact the Earth's surface temperature is left unexplained, and thus their model has no physical basis in reality. A fundamental problem with the L&S model is the assumption of significant effects of 20 and 60 year astronomical cycles on the Earth's temperature. Aside from failing to provide a physical mechanism through which Jupiter and Saturn could impact the Earth's temperature, as Riccardo has previously noted, the mere existence of a 60 year cycle in the Earth's surface temperature depends on the choice of trend to begin with. By fitting certain polynomials to the global temperature data, we can find a residual with a 60 year cycle, but only with certain curve fitting choices. Those curve fitting choices must first be justified.
However, instead of first subtracting off the underlying trend and seeing what's left, L&S start their exercise under the assumption that the 20 and 60 year cycles are present, and then fit the temperature data as best they can with those cycles (with no physical constraints). After they conduct this curve fitting, they see what's left and attribute the remainder to human effects. This is not a scientific approach, it's simply curve fitting (a.k.a. "graph cooking" and "mathturbation") at its worst.
There may be a 60 year cycle in the global climate, perhaps related to an oceanic cycle like the Pacific Decadal Oscillation. However, in order to explain the warming of both the oceans and atmosphere, there must be an external forcing at work, which may be why L&S invoke these mysterious astronomical cycles. But the fact remains that they have failed to provide a physical mechanism through which these cycles could impact the Earth's climate.
L&S use a model with a very simple formula:
You may be able to guess how their model will perform just by examining this formula. The first two terms are their proposed plantary oscillations of 60 and 20 year periods, respectively. The third term will produce a linear warming trend, and the fourth is simply a constant. So this model will produce a linear warming trend with two natural oscillations superimposed on top of it.
L&S tweaked the parameters to fit the temperature curve without doing any further testing, but we can test it for them by running their model backwards in time and comparing to reconstructed temperatures. Because of the linear term, you might expect the model to match the observations back to the Little Ice Age (LIA) and then rapidly diverge from observations. If so, you would essentially be right (Figure 1).
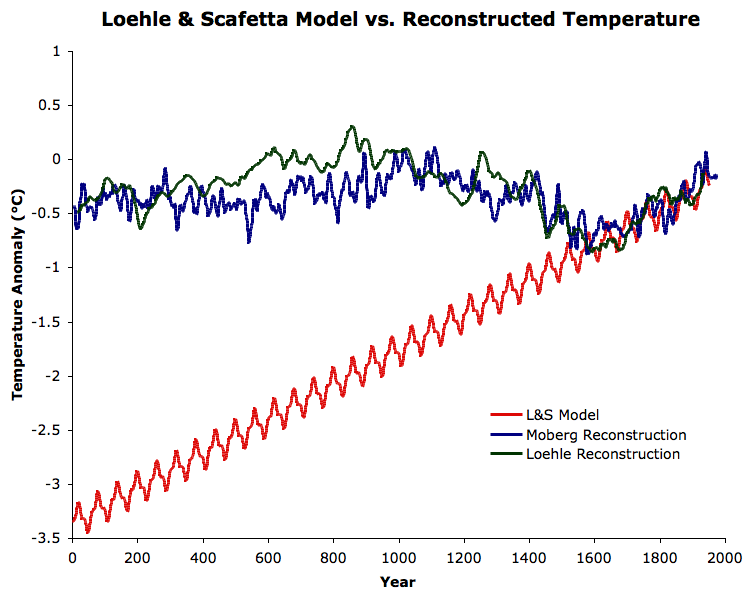
Figure 1: The L&S Case 2 model projected backwards in time (red), compared to the Moberg et al. (2005) millennial northern hemisphere temperature reconstruction (blue) and the Loehle (2008) millennial global temperature reconstruction (green).
Talk about a divergence problem!
Loehle is generally most well-known for his millennial global temperature reconstruction using non-tree ring proxies. Although the paper was published in Energy & Environment, which is not considered a peer-reviewed journal, considering that Loehle was the lead author on L&S, we felt it would be worthwhile to see if Loehle's model matches his own temperature reconstruction.
The L&S model matches the reconstructed temperature trends reasonably well back to the 17th century, but fails miserably to match prior temperatures. Moreover, the 60 year cycle in the L&S model matches up extremely poorly with the Moberg reconstruction (Figure 2), and even with Loehle's own reconstruction (Figure 3).
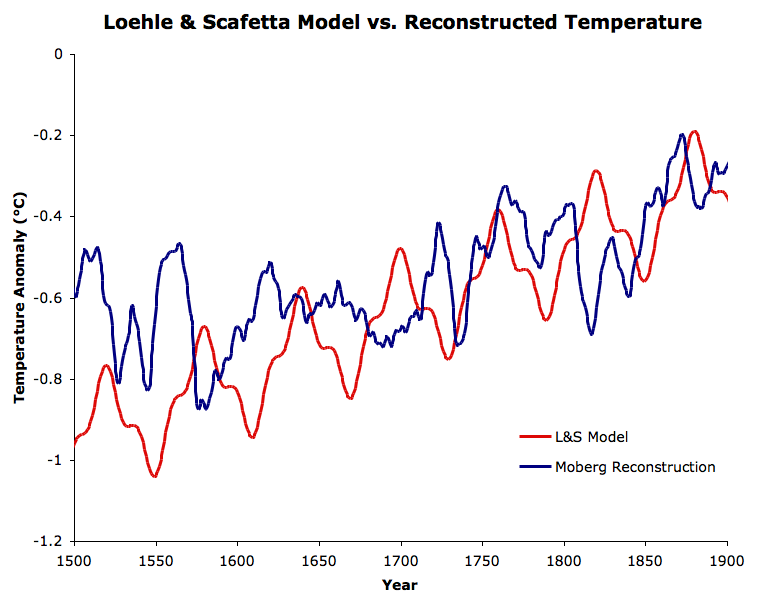
Figure 2: The L&S Case 2 model projected backwards to the period 1500 to 1900, compared to the Moberg et al. (2005) milennial northern hemisphere temperature reconstruction.
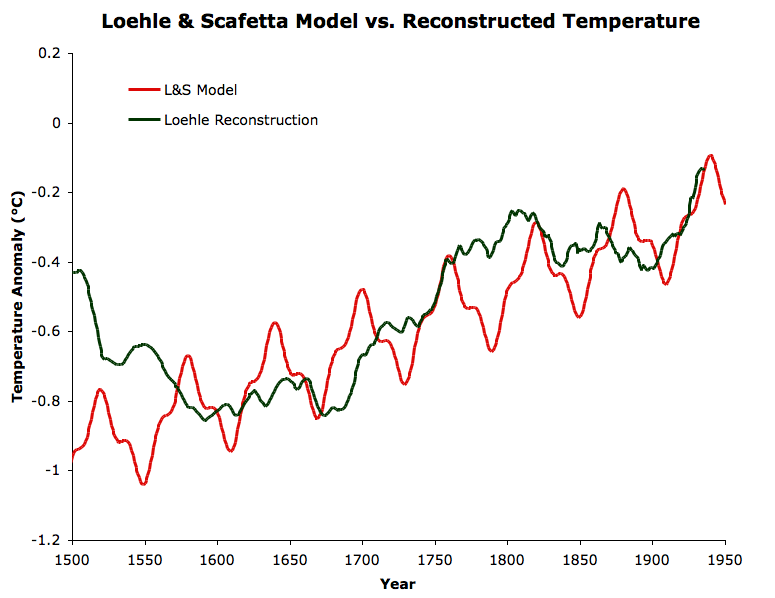
Figure 3: The L&S Case 2 model projected backwards to the period 1500 to 1900, compared to the Loehle (2008) milennial global temperature reconstruction.
Several times between 1500 and 1900, the L&S model is anti-phase with both reconstructions, with the peak of the 60 year cycle matching a trough in temperature. Thus we see that although L&S have gotten lucky and matched the temperature trend a few centuries into the past, the 60 year cycle which is the basis of their paper is nowhere to be found in the temperature data.
Fitting a curve with a simple model using physically unconstrained parameters is simply not a scientific process, as illustrated in its failure when put to the hindcasting test. In fact, the assumed 60 year cycle which was the basis of the L&S model doesn't even show up in Loehle's own millennial global temperature reconstruction - a glaring contradiction.
You could just as easily conduct this sort of curve fitting exercise using the number of pirates, canoes, and pantaloons in southern Spain. L&S are guilty of a major error in the abstract of their paper:
"About 60% of the warming observed from 1970 to 2000 was very likely caused by the above natural 60-year climatic cycle during its warming phase."
Correlation is not causation; all L&S have demonstrated in their unphysical curve fitting exercise is a correlation between their cycles and global temperature. If I find a correlation between Spanish pirates and pantaloons and global temperature, that doesn't mean these variables are causing global warming. If you want to draw a conclusion like L&S have, you need to identify the physical mechanism through which your variables are causing a global temperature change, identify a realistic physical range that this effect can have on the temperature, and then run your model.
Without a realistic physical basis, like Spencer before them, all L&S are doing is playing pointless curve fitting games, and using their results to draw unsubstantiated conclusions. Climastrology is not real science, and planetary movements are not causing global warming.
 |
The Skeptical Science website by Skeptical Science is licensed under a Creative Commons Attribution 3.0 Unported License. |