What The Science Says:
The most likely reason that UAH data shows less warming than expected is that the UAH data set is biased low.
Climate Myth: UAH atmospheric temperatures prove climate models and/or surface temperature data sets are wrong
the satellite sensors show less warming in the lower troposphere (approximately 10,000 feet above the earth’s surface) than is reported by surface temperature readings. Global warming theory holds that one of the fingerprints of human-induced global warming is more rapid warming in the lower troposphere than at the surface (James Taylor)
Climate models predict, that as a consequence of global warming, the temperature of the lower troposphere (TLT) will warm about 20% faster than the Earth's surface temperature. On the contrary, TLT as computed by Roy Spencer and John Christy at the University of Alabama at Huntsville (UAH)is warming about 20% more slowly than the surface, as measured by groups like NASA Goddard Institute for Space Studies (GISS) and the National Oceanic and Atmospheric Administration (NOAA). There are three possible explanations for this model-data discrepancy:
The answer may also involve a combination of these three possibilities. But which is most likely?
The climate model expectation of greater warming in the lower atmosphere is based on fundamental atmospheric physics, so this may be the least likely explanation for the discrepancy. There are also several surface temperature data sets which are all in very close agreement, and whose accuracy was recently independently confirmed by the Berkeley Earth Surface Temperature (BEST) project, so the second possible explanation also appears rather unlikely.
However, UAH is not the only group using satellite data to measure atmospheric temperatures. There are several other groups who have performed similar analyses of the data, and who generally estimate greater atmospheric warming than UAH. Moreover, atmospheric temperature estimates from instruments on weather balloons also indicate more warming than has been computed from the UAH record.
Estimating atmospheric temperatures from satellite data is a tricky business. The microwave sounding units (MSU) aboard the satellites don't actually measure air temperature, but rather the intensity of microwave radiation given off by oxygen molecules in the atmosphere, from which the scientists estimate the temperature. Given that the radiation reaches the satellite sensors having travelled through a warming lower atmosphere and cooling upper atmosphere, that bias exists between the various instrument sensors, that the orbital decay of the satellite creates another bias in the data, and a host of other obstacles, there's a lot of careful and painstaking analysis required, and much that can go wrong.
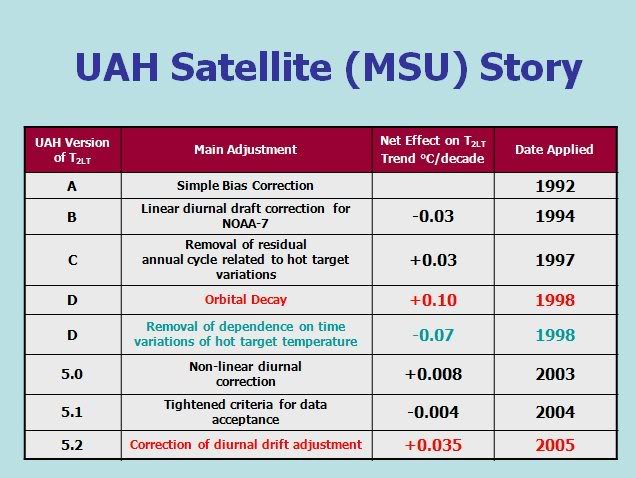
Considering these challenges, it's not a surprise that there have been a number of major corrections to the satellite temperature data over the years. Groups outside of UAH identified two major errors in the UAH analysis, both of which had caused Spencer and Christy to significantly underestimate TLT warming (Figure 1).
Figure 1: Major corrections to the UAH temperature trend over the years.
Despite the difficulties in the available data, and the numerous adjustments made to their analysis, Spencer and Christy have all along insisted that their data set is correct, and they continue with this overconfidence today. However, the most likely explanation for UAH showing less warming than models and atmospheric physics predict is that UAH is biased low.
 |
The Skeptical Science website by Skeptical Science is licensed under a Creative Commons Attribution 3.0 Unported License. |