What The Science Says:
All of the statements made in the IPCC report regarding the figure in question are correct and supported.
Climate Myth: IPCC graph showing accelerating trends is misleading
"The IPCC’s Fourth Assessment Report, 2007, carries in three places a graph in which the Hadley Center’s global mean surface temperature anomaly dataset from 1850-2005 is displayed with four arbitrarily-chosen trend-lines overlaid upon it. At each place where the altered graph is displayed, the incorrect conclusion is drawn that because trend-lines starting closer to the present have a steeper slope than those starting farther back, the rate of warming is accelerating and that we are to blame." (Christopher Monckton)
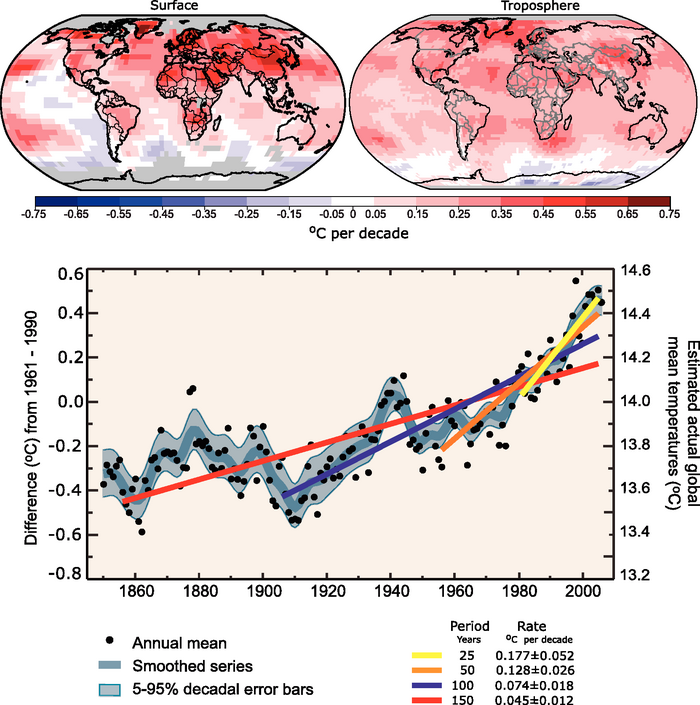
Some 'skeptics', most vocally Christopher Monckton, have taken issue with this figure from the 2007 IPCC report:

Figure 1: Depiction of various long-term global temperature trends in the 2007 IPCC report
The figure is used in FAQ 3.1 and the Technical Summary of Working Group 1. Monckton asserts that this graph uses a "fraudulent statistical technique" and
"At each place where the altered graph is displayed, the incorrect conclusion is drawn that because trend-lines starting closer to the present have a steeper slope than those starting farther back, the rate of warming is accelerating and that we are to blame."
This is simply a misrepresentation of the IPCC report. The IPCC makes the following claims using this figure:
1) The pace of warming accelerated over the course of the 20th Century. Notice the past tense. Here is the specific claim (from the caption for Figure 1 of FAQ 3.1, emphasis added):
"Linear trend fits to the last 25 (yellow), 50 (orange), 100 (purple) and 150 years (red) are shown, and correspond to 1981 to 2005, 1956 to 2005, 1906 to 2005, and 1856 to 2005, respectively. Note that for shorter recent periods, the slope is greater, indicating accelerated warming."
2) That the pace of warming over the last 25 years is greater than that in preceding years on the record.
3) That the "... global average temperature has increased, especially since 1950."
All of these statements are true. The IPCC does not state that the rate of warming continues to accelerate, and does not use this figure to claim that humans are to blame for the accelerated warming, although in the FAQ 3.1 figure caption, the IPCC does explain how we know humans are the cause of the acceleration:
"From about 1940 to 1970 the increasing industrialisation following World War II increased pollution in the Northern Hemisphere, contributing to cooling, and increases in carbon dioxide and other greenhouse gases dominate the observed warming after the mid-1970s."
Monckton's claims of a "fraudulent statistical technique" are without merit, and a misrepresentation of the IPCC report's actual content.
 |
The Skeptical Science website by Skeptical Science is licensed under a Creative Commons Attribution 3.0 Unported License. |