


 Arguments
Software
Resources
Comments
The Consensus Project
Translations
About
Support
Arguments
Software
Resources
Comments
The Consensus Project
Translations
About
Support
![]()
![]()
![]()
![]()
![]()
![]()
![]()
![]()
![]()
![]()


![]()


Latest Posts
- EGU2024 - An intense week of joining sessions virtually
- Skeptical Science New Research for Week #16 2024
- How extreme was the Earth's temperature in 2023
- At a glance - Is the science settled?
- What is Mexico doing about climate change?
- 2024 SkS Weekly Climate Change & Global Warming News Roundup #15
- Fact Brief - Did global warming stop in 1998?
- Skeptical Science New Research for Week #15 2024
- EGU2024 - Picking and chosing sessions to attend virtually
- At a glance - The Pacific Decadal Oscillation (PDO) is not causing global warming
- Climate Adam: Is Global Warming Speeding Up?
- 2024 SkS Weekly Climate Change & Global Warming News Roundup #14
- Gigafact and Skeptical Science collaborate to create fact briefs
- Skeptical Science New Research for Week #14 2024
- How can I make my retirement plan climate-friendly?
- At a glance - Global warming and the El Niño Southern Oscillation
- A data scientist’s case for ‘cautious optimism’ about climate change
- 2024 SkS Weekly Climate Change & Global Warming News Roundup #13
- Skeptical Science New Research for Week #13 2024
- You can start applying for the American Climate Corps next month
- At a glance - Human fingerprints on climate change rule out natural cycles
- Want clean electricity? These are the overlooked elected officials who get to decide.
- 2024 SkS Weekly Climate Change & Global Warming News Roundup #12
- Climate - the Movie: a hot mess of (c)old myths!
- Skeptical Science New Research for Week #12 2024
- Climate Adam: Could the Amazon Rainforest Collapse?
- At a glance - Does CO2 always correlate with temperature?
- The U.S. has never produced more energy than it does today
- 2024 SkS Weekly Climate Change & Global Warming News Roundup #11
- Skeptical Science New Research for Week #11 2024
Comment Search Results
Search for Steve Goddard
Comments matching the search Steve Goddard:
- The difference between land surface temperature and surface air temperature
Jim Hunt at 08:01 AM on 6 August, 2023"People who create and/or circulate such myths are denying plain reality."
There's a lot of it about at the moment John! My own recent article on the creation and circulation of similar myths takes a look at some theory whilst also debunking some specific "skeptical" memes:
https://GreatWhiteCon.info/2023/08/the-information-war-with-the-fossil-fuel-industry/
By way of just one example, if you can spot the difference between these two graphs of Arctic sea ice extent you may well wonder why a certain "Steve Goddard" has been continuously blasting the former data at his flock of faithful followers rather than the latter?
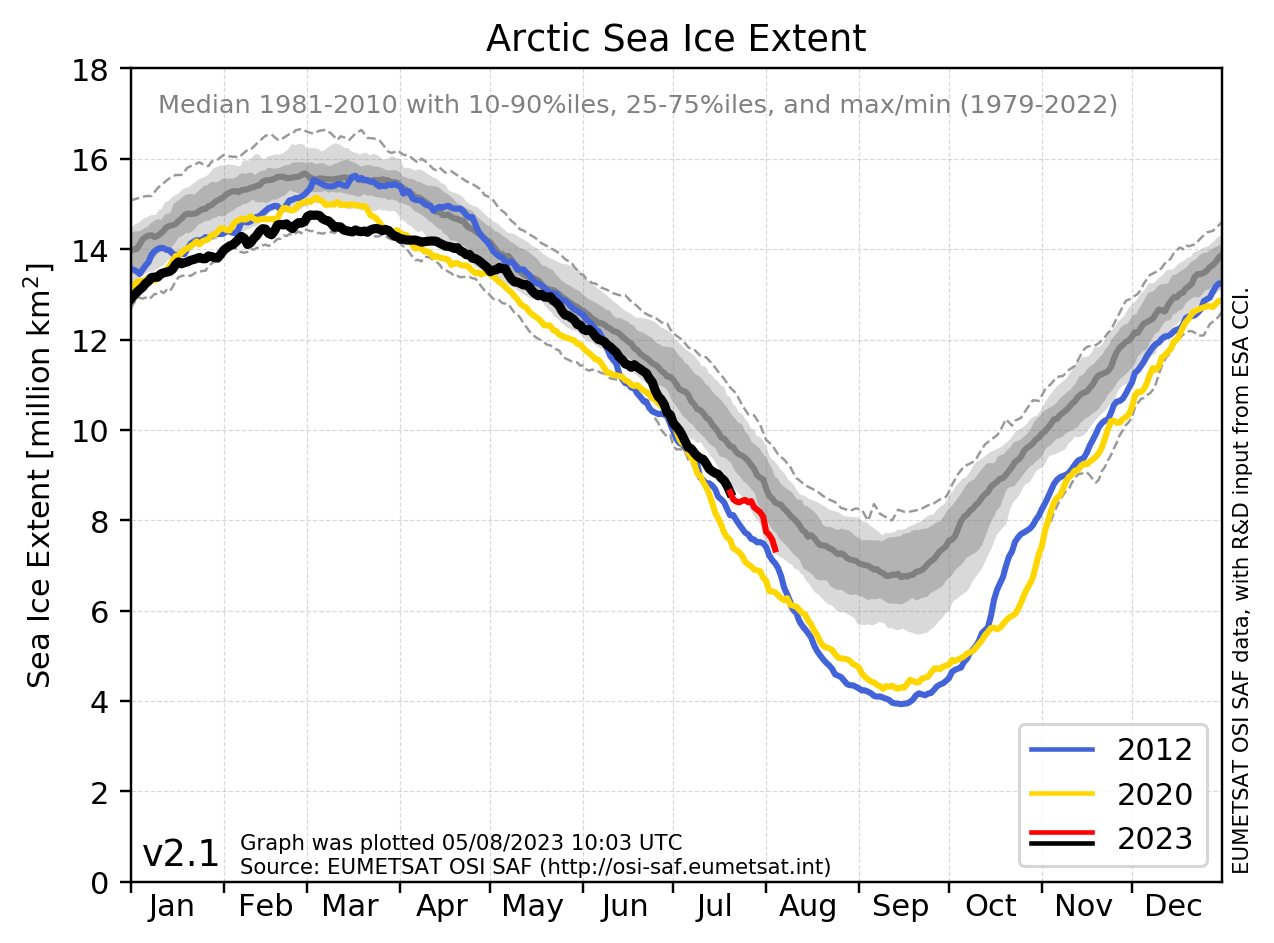
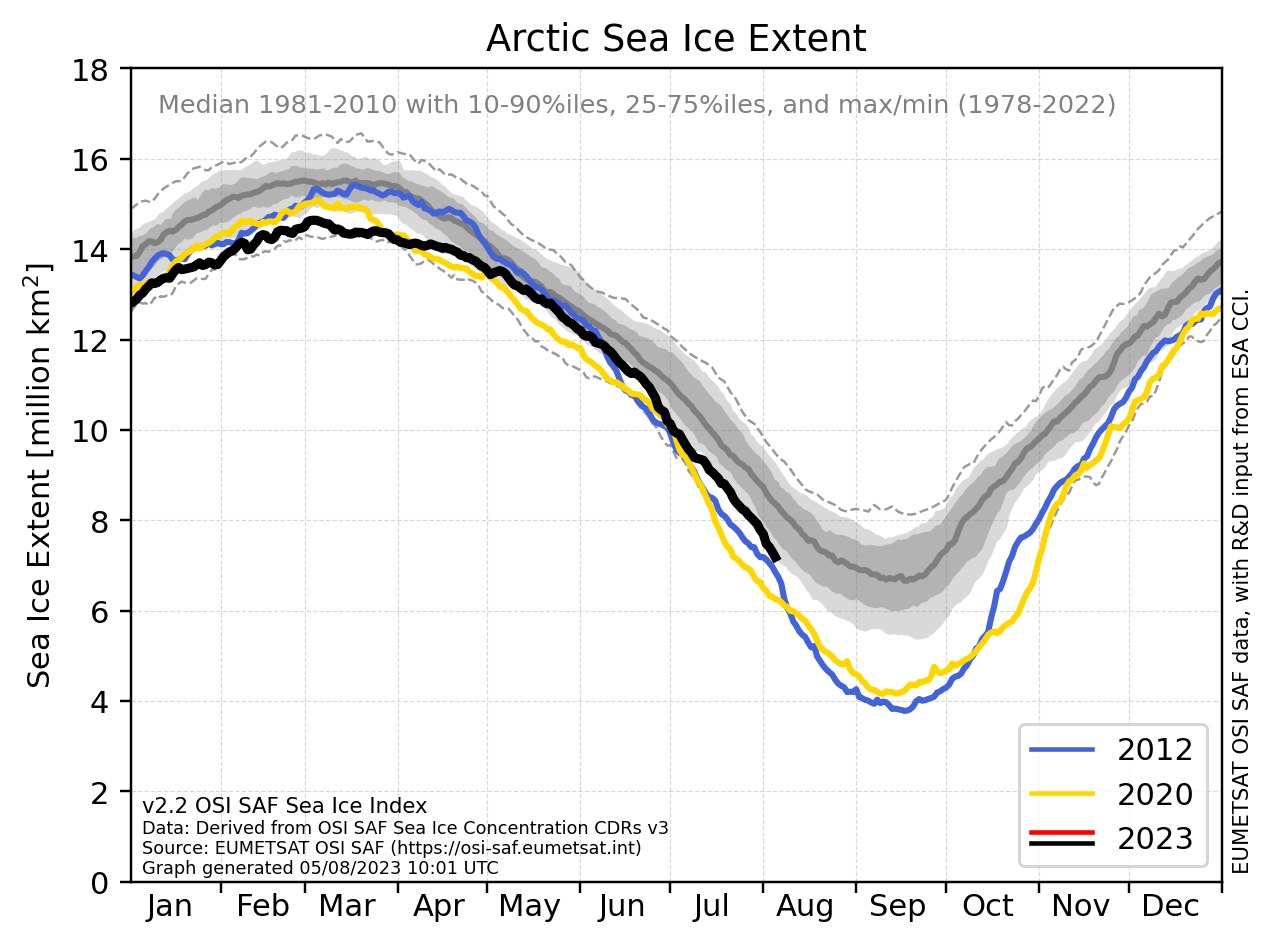
Events, dear Tony, events!
- 2021 SkS Weekly Climate Change & Global Warming Digest #1
Philippe Chantreau at 04:41 AM on 15 January, 2021Thank you for the compliment, Eclectic, and no offense was intended. I know it is necessary to monitor the crazyness of the denialist crowd, I just don't ever find that I couldn't do something better with my time. I've been at this long enough to have fond memories of Steven Goddard and the carbonic snow in Antarctica :-)
Nowadays, Watts is a little more careful to weed out whoppers of such magnitude. But then, there was BEST, and the NOAA studies that completely invalidated the basic argument for the very existence of the site, and eventually Watts'own results that did exactly the same thing, all met with anger (toward BEST) and more denial.
The attitude of the WUWT peanut gallery when faced with reality taught me everything I needed to know about these clowns. Not to mention, of course, the "outing" of private addresses of scientists whose work they disliked, predating methods that have unfortunately become more common.
- State of the climate: 2018 set to be fourth warmest year despite cooler start
michael sweet at 10:25 AM on 22 August, 2018Bob Hoye,
From the OP:
"The Arctic has been strikingly warm so far this year, with many areas 3C warmer than the global average."
But if you want to cherry pick only a tiny fraction (80 North) for only part of the year (summer only) than everything looks great!
Who gives you your cherries? I also suspect Steve Goddard.
- State of the climate: 2018 set to be fourth warmest year despite cooler start
scaddenp at 07:40 AM on 22 August, 2018I am not sure quite information you think the DMI is giving you, but if that is the only temperature record you look at, then surely you should look at what DMI itself have to say about the record and what it is fit for. Ie it is not a climate data record. Furthermore, if you have watched over a no. of years you will notice that there is very low variability in the mid summer temperatures (generally stuck at just above zero) especially compared to the winter temperatures. Reason? Above 80N is mostly ice. The air temperature above ice is forced to close to 0C or below because the insolation goes into just melting the ice. While the ice persists, temperature will be nearly constant. Looks to me like you are looking for a record that makes you feel comfortable about doing nothing but unfortunately this isnt the one if you understand what it tells you. Did you find the more complete analysis of snow cover statistics that I pointed you to comfortable? Or did you choose not to follow the link because winter snow cover fits what you would like to believe whereas spring and summer are unconfortable?
Furthermore the extraordinary high temperatures in winter on DMI is by contrast a real cause for concern - linked to other unpleasant weather phenomena.
Cherry picking one aspect of Greenland ice balance while ignoring the larger picture is also not convincing. I dont suppose your opinions are being "informed" by Tony Heller aka Steve Goddard instead of science?
- Greenland is gaining ice
Cedders at 23:33 PM on 11 November, 2017I've noticed new claims that Greenland is gaining ice. It seems Steven Goddard (Tony Heller) a graph by Danish researchers on a web page 'Current Surface Mass Budget of the Greenland Ice Sheet'. It was picked up in Goddard's "Deplorable Climate Science Blog" as "Massive Growth In Arctic Ice Since Last Year" and that has been amplified by contrarians who in this case prefer to believe models to satellite data (eg "Grace data update reveals NASA Greenland mass-loss fraud").
The confusion is simply resolved by reading the explanatory text.
Over the year, it snows more than it melts, but calving of icebergs also adds to the total mass budget of the ice sheet. Satellite observations over the last decade show that the ice sheet is not in balance. The calving loss is greater than the gain from surface mass balance, and Greenland is losing mass at about 200 Gt/yr.
- It's a natural cycle
Daniel Bailey at 21:19 PM on 17 October, 2017"the slightly-less-than-truthful Tony Heller [ aka "Steven Goddard' ]"
BwaHaHaHaHa!!!!!!!
- It's a natural cycle
Eclectic at 21:04 PM on 17 October, 2017Postkey @26 , thanks for the youtube video reference.
It was the best laugh I've had this week !
Spoiler Alert : the video is a complete waste of time. Rubbish from beginning to end. A rant from a crackpot who bases his opinions on the slightly-less-than-truthful info supplied/concocted/doctored by the slightly-less-than-truthful Tony Heller [ aka "Steven Goddard' ]. Plus a large dose of insane Conspiracy Theory.
The ranter also has a bad case of AMO on the brain [Atlantic Multidecadal Oscillation]. And, from his stargazing at the charts, he predicts [on zero scientific basis] that the Earth is just about to plunge into a Grand Solar Minimum which will devastate the planet with a mini-ice-age.
Too many other laughable points to mention here. Yes, the Fall of the Roman Empire; the (European) Black Death Plague; and other grand historical events — all caused by cold weather. And our ranting friend is clueless and self-contradictory about the decline of arctic ice.
Sorry Postkey, but on climate this guy has no science and no sense. ~ A 15-minute video of yawning [seen it all before] rubbish.
- Temp record is unreliable
Tom Curtis at 21:26 PM on 31 May, 2017landdownunder @413:
1) Tony Heller (aka Steven Goddard), producer of the www.realclimatescience.com website is not a climate scientist, former or otherwise. His qualifications are a Bachelors degree in Geology, and a Masters in Electrical Engineering. So far as I can determine, he has never published a peer reviewed paper of any description. He is well known as a serial misreprenter of data, a prime example of which is the gif which he produced, and you show.
2) Heller's giff does not demonstrate any significant change in values. Rather, it exhibits a change in the range of the y-axis from -0.6 to 0.8 for "NASA 2001" to approximately -0.85 to 1 for "NASA 2015". That represents a 32% increase and accounts for nearly all of the apparent change in trend - particlularly post 1980. An honest presentation of the data would have plotted both on the same axis, and ideally on one graph to allow direct comparison, like this:

(Source)
As can easily be seen, the temperature trend between 1980 and 2000 is nearly the same in all versions, and has certainly not doubled. In fact, the GIFF is doubling misleading. The 1998, 2000, 2012 and 2016 versions of the NASA GISS Meteorological Stations only temperature index are downloadable here (as also for the Land Ocean Temperature Index). the 1979-1998 trends are, respectively 0.184, 0.134, 0.169 and 0.177 oC/decade. You will notice that largest change is the 27.2% reduction in the trend from the 1998 to the 2000 version, followed by the 26.1% increase from 2000 to 2012.
Clearly the history of changes is not one sided, indicating the scientists concerned are following the data. Equally obvious is that Tony Heller has cherry picked an interval to show a rise in trend, even though the available history of adjustments results in a net reduction in the trend of the last two decades of the 20th century, not an increase.
Returning to cosmoswarrior's specific claim, a 32.1% increase in the trend (2000-2016) is not a doubling of the trend. Not even close, so even on your generous interpretation, that remains a gross error.
3) Unlike the AGW "skeptics", who focus on the facts of the changes without regard to the reasons, actual climate scientists focus on the reasons, which they detail in peer reviewed publications, and in the case of GISS, on site as well (see prior link). One main contributor to the change in trend from for the meteorological stations index has been the increase in the number of stations. The first version of GISS (1981) relied on just 1000 stations. That increased to 2200 in 1987, and to 7200 in 1999 (between the 1998 and 2000 versions). In 2005, a small number of stations in Antarctica were introduced, which was not a major increase in number, but very significant in improved coverage. Finally, in 2016 the number of stations jumped to 26000.
There have also been significant improvements in techniques, as detailed by GISS:
"We have gone through the archives to show exactly how these estimates have changed over time and why. Since 1981 the following aspects of the temperature analysis have changed:
- The simple procedure used in 1981 was refined as documented in Hansen and Lebedeff (1987), using 8000 grid boxes to allow mapping and analysis of regional patterns.
- Surface air temperature anomalies above the ocean were estimated using sea surface temperatures from ships and buoys starting in 1995 as documented in Hansen et al. (1996).
- Starting in the 1990s, the methodology took into account documented non-climatic biases in the raw data (e.g. station moves) and eliminated or corrected unrealistic outliers (Hansen et al., 1999).
- Areas with missing data were filled in — using means over large zonal bands — rather than restricting the averaging to areas with a defined temperature change (Hansen et al., 1999).
- A method was devised in 1998 and refined in 2000 to adjust urban time series to match the long term mean trend of the surrounding rural stations, Hansen et al. (1999, 2001). This adjustment uses the full data series to make the best estimate of the rural/urban difference and so can change as the time-series are extended (and more data comparisons are available). Starting in 2010 night-light radiance rather than population data were used to classify stations (Hansen et al., 2010).
- Usage of water temperatures as proxy for air temperatures was more accurately restricted to areas without sea ice starting in April 2006."
The merits of these changes in method can be argued, although they all seem like eminently reasonable improvements to me. But if you object to them, you have to make that argument. You cannot simply say that you do not like the result and therefore the methods are wrong - still less that they are fraudulent. The later, however, is the method employed charlatans like Tony Heller.
4) The involvement of politicians in challenging the adjustments is in no way evidence of the scientific invalidity or otherwise of the adjustments. It is evidence of where politicians think they can get political milage, either with there base or with their donors. Curiously, the second largest category of donors of Lamar Smith, who led the congressional inquisition on Karl et al, was from the Oil and Gas industry. Lamar Smith is not alone. In 2016, the Oil and Gas industry made political donations to the tune of $103 million dollars, 88% of which went to Republicans.
5) Finally, you quote Zeke Hausfather as saying:
"... they increased the amounts of warming that we have experienced pretty significantly. They roughly doubled the temperature trend since 1998 compared to the old versions of the datasets"
and go on to suggest, "...is also consistent with cosmoswarrior's statement". However, cosmoswarrior's statement was explicitly about the last two decades of the 20th century (1981-2000), not the interval from 1998-2012 that Zeke Hausfather was talking about. His comment was, therefore, entirely irrelevant to cosmoswarrior's eggregiously false claim. More importantly, the 1998-2012 trend "roughly doubled" not because there was a large increase in the trend, but because the trend was low. The change in trend over that period was from 0.039 C per decade to 0.86 C/decade, a change of approximately half (63.5%) of one standard deviation of the error of the new trend as determined on the SKS trend calculator.
Following the logic of the advocates of the existence of a "hiatus", that is no change at all.

- No climate conspiracy: NOAA temperature adjustments bring data closer to pristine
Tom Curtis at 11:07 AM on 27 April, 2017Spassapparat @34, Tony Heller (aka Steven Goddard) shows the following graph of USHCN adjustments:
You will notice that there is not a lot of scatter in the individual points from year to year, a necessary feature for the high correlation with CO2 given the very limited scatter found in the CO2 record (at least from Mauna Loa). That being said, the graph comes as a surprise to me, for I have typically seen a much larger year to year scatter in the graphs, such as shown here:
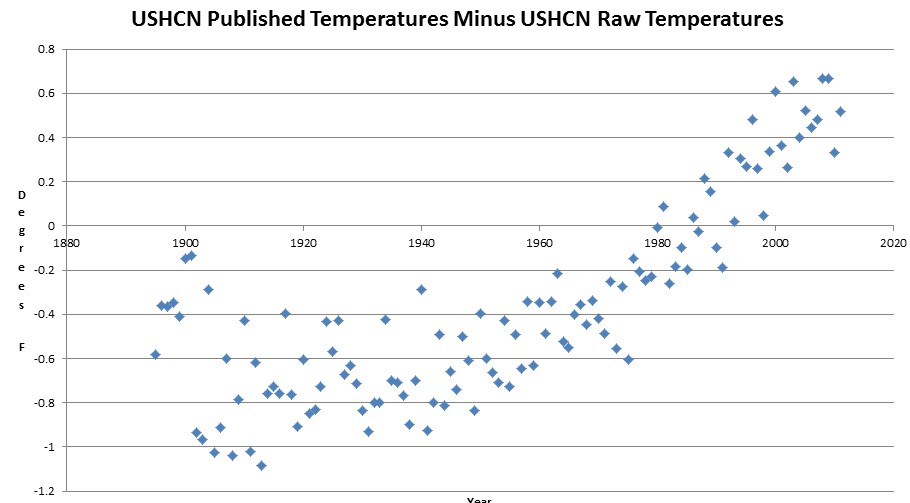
The author of this second graph is in obvious, and fundamental disagreement with Tony Heller about the size and nature of the adjustments in the USHCN temperature record. Importantly, if Heller is correct, there is a significant correlation between CO2 concentrations and temperature adjustments, but if the author of the second graph is correct, there is not. That is odd, because the author of the second graph is Tony Heller.
It turns out that when Heller is not trying to argue that there is a high correlation between CO2 concentration and temperature adjustments, he thinks the adjustments are very different from what he takes them to be when he trying to make that argument. It might make one think that Heller has adjusted his calculation of the adjustments to fit is CO2 correlation argument.
In any event, the basis of the adjustments is in fact well known. NOAA publishes the algorithms used to make the adjustments. The publish the raw and final data as well. Consequently anybody with the appropriate skills and determination can calculate the adjustments independently of NOAA. Several people have, and they have come up with the same result. Needless to say, none of NOAA's algorithms make any reference to CO2 concentration, as can be seen for the step wise adjustments as calculated by Judith Curry:
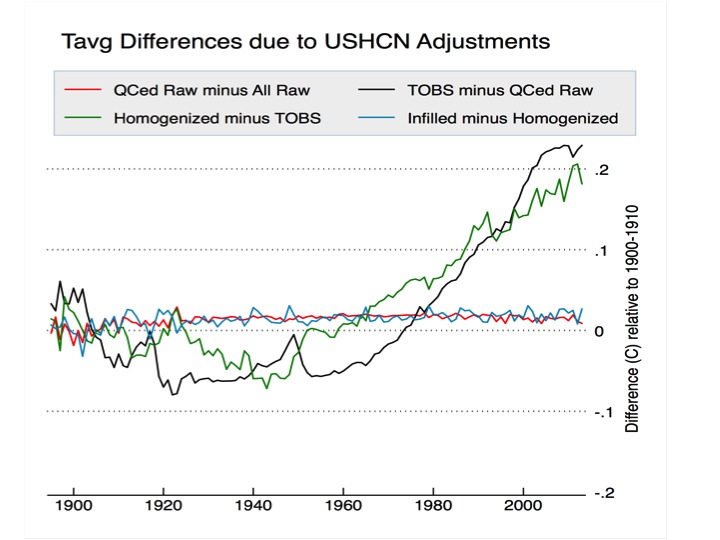
Heller knows this, so he knows that any correlation between the adjustments and CO2 concentration (whether assisted by adjusting the adjustments or not) is coincidental. His failure to discuss the known basis of the adjustments in his post must therefore be considered a calculated deceit.
- No climate conspiracy: NOAA temperature adjustments bring data closer to pristine
Spassapparat at 06:38 AM on 27 April, 2017Hi,
an argument that appears on many climate skeptic blogs (ex: https://stevengoddard.wordpress.com/2014/10/02/co2-drives-ncdc-data-tampering/) to justify the claim that there is deliberate tampering going on is to plot the NOAA temperature adjustments against measurements of atmospheric c02 and finding that there is an almost perfect fit. While a close correlation imo can be expected, that close of a fit appears surprising to me too. As I'm neither a climate scientist nor a statistician I was wondering whether someone could provide an explanation for this?
- We’re now breaking global temperature records once every three years
Jim Eager at 12:00 PM on 24 January, 2017Tony Heller, aka Steven Goddard. The guy who claimed it snows CO2 atop the Antarctic ice dome. The guy who claimed the reason Lake Superior is cold is it "remembers" the last glaciation.
'Nuff said.
- 2016 SkS Weekly Climate Change & Global Warming News Roundup #45
Tristan at 17:48 PM on 6 November, 2016You missed the most important news, from Malcolm-Ieuan: Roberts., the living soul.
"I am very proud to have invited Canadian Dr. Tim Ball, Tony Heller (AKA Steve Goddard http://ow.ly/j3rq305NUEP) and Jennifer Marohasy to appear at a climate seminar at Parliament House next Tuesday evening."
Where apparently he'll be "will be announcing his report on the Climate Science evidence of CSIRO".
That'll teach those pesky actual scientists!
- Temp record is unreliable
Eclectic at 15:57 PM on 9 October, 2016Pink @ 375 , the guy called Tony Heller also calls himself Steve Goddard.
He is well-known for his "economy with the truth" - indeed, he is notorious for his misleading presentations. Pink, you should always look very skeptically and carefully at anything he presents (under either name).
Here, if we generously assume he has not presented false or distorted information, then we should next look to see :-
(a) if he used data which is out of date (outdated because the temperatures were not corrected for systematic errors in themselves, or in relation to worldwide standardising methods).
(b) if he has cherry-picked data which he thinks is good "denier" propaganda - while carefully avoiding presenting the vast amount of data which points in the opposite direction.
(c) if he has used only continental USA data and not worldwide data. The worldwide records show strong warming, and continental USA records being only 2% of global area, are therefore rather unimportant in comparison.
(d) if he has not been contradicting himself by also (elsewhere) claiming the denier meme that CONUS temperatures are showing higher over the past half-century but only because of the Urban Heat Island Effect. ( Pink, as a well-informed guy, you will of course be aware that "UHI Effect" has been completely debunked as a cause of apparent rising temperature records ). You have to laugh when you see deniers trying to play for both sides at the same time !
Another interesting point is that there certainly were some unusually hot summer days in central continental USA in the 1930's. It is uncertain if they were the entire cause of the Oklahoma-type droughts - or whether they were (in part) a consequence of desertifying effect from extensive poor management of those agricultural areas.
A further point, Pink, is to find comparable graphs of night-time low temperatures for summer , and also find graphs of day/night winter temperatures. You might find those to be very interesting, in comparison ! Has Mr Heller/Goddard supplied those, too ?
A final matter, Pink, is the important common sense test you yourself can apply to Mr Heller/Goddard's graphs - graphs which on first glance seem to indicate a rapid trend toward a New Ice Age. Look around you : warming changes are already happening within CONUS, and even more strongly in Alaska - and most of the "non-CONUS" world is recording higher temperatures and new records in heat waves. Sea levels are rising faster and faster; huge amounts of glacier and arctic ice are disappearing. The ocean is warming ( and acidifying from excess CO2 ).
Mr Heller/Goddard is clearly very wrong in what he is implying.
- 1934 - hottest year on record
MA Rodger at 02:10 AM on 29 August, 2016http://www.skepticalscience.com/comments_policy.shtmlDarkMath,
You may come to SkepticalScience and debate the science but be aware that if you are going to pronounce "But that's not science. ;-)" it is actually beholden on you to properly explain what the "that" is which you are asserting "is not science." Otherwise "That (ie your comment) is not (real) science." Do not be deceived by the names that deluded climate deniers like Steve Goddard/Tony Heller pick to name their websites.
- Venus doesn't have a runaway greenhouse effect
Mike Hillis at 09:21 AM on 19 June, 2016Michael sweet @144
Keep in mind that Steve Goddard thinks CO2 can fall as snow at the south pole and be sequestered there forever.
That is an error. This is what Steve Goddard actually says:
https://stevengoddard.wordpress.com/2012/06/12/antarctic-temperature-drops-below-the-freezing-point-of-co2/#comments
- Venus doesn't have a runaway greenhouse effect
michael sweet at 07:31 AM on 19 June, 2016Mike Hills,
Your arguments started out interesting but have gone way down. I suggest you review basic chemistry and physics before you post again. You need to stop reading from the blog source you are getting your information from. Keep in mind that Steve Goddard thinks CO2 can fall as snow at the south pole and be sequestered there forever. If you want to convince readers here you have to get the High School Chemistry (which I teach) correct.
Heat and temperature are directly proportional in a given parcel of air. If the temperature increases as the parcel as it sinks, the heat increases. The heat has to come from somewhere. It cannot come from the parcel itself as that would violate the first law of thermodynamics. Glenn's explaination that the energy comes from the work the surroundings does (or that a rising parcel does on the surroundings) is the correct one. Read his post again if you are unclear about where the heat comes from.
Venus is the classic example of a runaway greenhouse effect. Arguing that Venus is not a greenhouse planet will not get you any converts at a scientific site.
Can you find a scientific reference (paper or textbook) that caims Venus is not a greenhouse (I note that you have not referred to any scientific papers in your arguments, only blog science)? If you cannot perhaps you should consider that it is because Venus really is a greenhouse and your blog science is incorrect.
Your claim that heat can be transferred from the cold upper atmosphere to the warmer lower atmosphere is also a violation of the laws of thermodynamics.
I will try not to comment again since dogpiling is against the comments policy.
- A Response to the “Data or Dogma?” hearing
Ceist8 at 17:45 PM on 18 January, 2016Cruz should have also been questioned on why he would use a graphic from "Steve Goddards" blog. Tony Heller even boasts about it on his blog (see "Ted Cruz used my graph").
The 'hasn't warmed in 18 years etc" graph is Lord Monckton's deceptive graphic that does the rounds of contrarian blogs.
- CO2 effect is saturated
braintic at 22:47 PM on 15 November, 2015Rob Honeycutt:
Mike Sanicola is Morgan Wright. He runs the Hyzer Creek Disk Golf course in New York. His YouTube ID is hyzercreek. "Mike Sanicola" is actually the name of a baseballer who was drafted to the Yankees in 1983, was seriously injured, then went into the ministry.
As Morgan Wright, he claims to be an optometrist. In his most recent YouTube comments, he made the mistake of mixing the two identities, which tipped me off to the Sanicola identity.
He says "I'm an opticist, who specializes in optics and IR. I worked for GE's infrared department and designed infrared telescopes for GE that were used by NASA in outer space. I invented the ambient temperature microbolometer."
Also, no proof yet, but I am beginning to wonder if he is actually Steven Goddard. He regularly links to Goddard's site, and their manner of speech and desire to advertise dual occupations are eerily similar.
- CO2 effect is saturated
Tom Curtis at 06:57 AM on 20 October, 20151) when you say "as a model, [radiative forcing is] not fitting", the model from which radiative forcing is derived are Line By Line (LBL) or broadband radiative models. The Line By Line refers to the fact that they calculate atmospheric transmission and emission for each wave number (a measure of frequency) seperately, giving a very fine resolution of radiative transfer. Typically they also divide the amtosphere into about twenty layers or so, calculating in each direction (up or down) the radiation entering, the radiation absorbed and the radiation emitted based on the atmospheric composition at that layer. As of 1969, they produced results with this sort of accuracy:

One such model whose accuracy across a wide range of surface conditions, temperatures and latitudes was studied in 2008 showed the following scatter plot vs observations for 134,862 observations:

If you are not familiar with scatter plots, they are plots of the observed value (CERES OLR) with the model predicted value, with perfect accuracy of prediction meaning the observations sit on the black line shown. The accuracy shown here is absolutely astonishing. The determination of radiative forcing of CO2 was done using models like this, or the lower resolution versions that are essential parts of all climate models (Global Circulation Models). I can only presume that when you say the model is "... not fitting", you simply do not know what models are used for the theory.
2) You also say that "If CO2 makes up 20% of our greenhouse effect, light from stars at this wavelength should be diminished by 20%". That assumes that absorption is the same at all frequencies, which is false (as can be seen in the first graph). IR astronomers tune the frequency of the observatories to 10 to 13 micron (800 - 1000 cm-1)band where there is minimum absorption by any atmospheric component as seen in the first grap above, and this emission spectrum from the University of Colorado:

By doing so they avoid nearly all of the effect of CO2 and H2O on the incoming light. Despite this, they still need to place their observatories high in the atmosphere (either on mountains, in planes or supported by balloons) or in space to get clear images. So, your fundamental premise that absorption is equal across all IR bands is simply mistaken.
Curiously, Goddard's "IR astronomer" friend refers to the 9.5 micron band as being absorption freed (it is in fact the frequency of maximum absorption and emission by ozone) and describes the actual atmospheric window as being a zone of significant absorption and emission by H2O, showing he does not even grasp the fundamental facts of atmospheric absorption and emission.
3) "Steven Goddard" and his (apparently fictional) source always makes a fundamental misake in examining radiation models. He only examines the so-called back radiation. Because H2O and CO2 emissions overlap, and because H2O is very abundant in the low atmosphere, CO2 emissions make up only a very small percentage of the overall back radiation. That, however, is irrelevant. What controlls the Global Mean Surface Temperature (GMST) is the balance of energy recieved and energy radiated to space. Therefore it is radiation to space from the atmosphere which is the dominant driver of surface temperatures, and hence upper atmosphere concentrations that matter. Because the concentration of H2O is controlled by temperature, and temperatures fall rapidly with altitude, CO2 completely dominates emission to space in frequencies of significant overlap with H2O. Consequently, it is emissions to space that must be examined to determine the relative importance of different atmospheric components.
As an aside, because H2O absorbs in more frequencies it still (along with clouds) accounts for 75% of the total greenhouse effect, with CO2 accounting for 20%. Importantly, H2O varies rapidly with surface temperature, while CO2 varies only slowly. As a result, increasing CO2 will result in a rapid rise in H2O, generating a positive feedback on the CO2 rise. In contrast, a rise in H2O will result in only a small response from CO2, resulting in temperatures and H2O concentrations soon returning to their initial values.
Finally, if you want to examine the basis of greenhouse effect in more detail, but explained very clearly, I recommend my post here. It and the following comments also contain more detail on the first two graphs above.
(Note to the moderator, I know that I am close to the point of dogpilling. If that is a problem, I ask that you retain my post as the only one todate directly addressing the issues raised by fred.steffen (rather than his sources). Thankyou)
- CO2 effect is saturated
Phil at 04:27 AM on 20 October, 2015The article on Tony Heller's (AKA Steven Goddard) states:
Starting at 13 we get CO2 absorption but that wavelength corresponds to temperatures below even that of the south pole.
So whoever he is, he doesn't seem to understand the earths emission spectrum (as a pseudo-black body) but appears to think the earth should emit at a single frequency for each "parcel" of the surface that is at a particular temperature. - CO2 effect is saturated
Rob Honeycutt at 03:30 AM on 20 October, 2015fred.steffen... I did a quick google on the guy who apparently wrote the article for Goddard's blog. He says his name is Mike Sanicola, and he states that he is a "professional IR astronomer." In my google search I came up with this person who also checked into Sanicola's credentials. He says:
"Finally, I'm an astronomer and been around quite a while, and I've never heard of Mike Sanicola so I did a little checking. He is not in the American Astronomical Association directory (very unusual for a professional U.S. astronomer), nor is he one of the 10,727 astronomers worldwide listed in the International Astronomical Union (IAU) directory of professional astronomers. The link associated with his name in Goddard's post takes you to the GE (yes, that's General Electric) home page, where there is absolutely no mention of a Mike Sanicola. There are *no* papers in the Astrophysics Data System by anyone named "Sanicola", and this source indexes all papers that appear in the significant astronomy journals and conference proceedings. A Google search finds no reference to a Mike Sanicola, astronomer, other than to the same Steve Goddard article that Ajax quotes. I don't think Mike Sanicola exists, or if he does, he is not a professional astronomer."
So, I don't know who this guy actually is but he's clearly not the expert he claims to be.
- CO2 effect is saturated
Rob Honeycutt at 03:22 AM on 20 October, 2015Quick FYI... Stevengoddard (not his real name) is probably one of the worst sources of information on climate change available on the internet.
- CO2 effect is saturated
fred.steffen at 02:29 AM on 20 October, 2015Since CO2 is only present in our atmosphere at 0.04%, I've always thought it strange that it could have such a large impact. I've looked into "Radiative Forcing" and found out that as a model, it's not fitting, so there's another model that's more accurate that's being used instead for most climate models.
At the center of it all tho, as this article describes, is the effective "greenhouse" effect of CO2. If CO2 makes up 20% of our greenhouse effect, light from stars at this wavelength should be diminished by 20%.
According to this article, it isn't even a concern in IR astronomy.
(I apologize for the tone of this article, I don't think it should be as inflamatory as it is, yet the points he makes seem valid to me)
https://stevengoddard.wordpress.com/2014/01/25/ir-expert-speaks-out-after-40-years-of-silence-its-the-water-vapor-stupid-and-not-the-co2/
If IR at CO2's wavelengths aren't affecting light coming from stars (almost undetectable amount) then IR at CO2 wavelenghts is free to radiate to space even from the surface. That should be easily measurable using a light source at that frequency pointed out to hit a sattelite, or even one of the mirrors we have on the moon.
If the article I listed or the premise I've asserted is false, please let me know.
Thank you...
- Global warming is causing more extreme storms
villabolo at 08:18 AM on 11 February, 2015@ the Griss:
Steven Goddard should be made aware of skeptic Roy Spencer's UAH temperature chart which is on model 5.6. Talk about changes.
- Global warming is causing more extreme storms
the Griss at 19:05 PM on 10 February, 2015Hi,
Steven Goddard is always going on about adjustments etc, yet will not answer a question as to why USCRN and USHCN match so well since 2005 when USCRN was created..
Why won't he answer?
- Kevin Cowtan Debunks Christopher Booker's Temperature Conspiracy Theory
Tom Curtis at 12:51 PM on 6 February, 2015daveburton @14:
1)
"You are correct, Tom, but his graph was for the last 114 years, and his conclusion ("why would they [bother to] do that") only makes sense if the sum of NOAA's adjustments were inconsequential. It doesn't make sense if NOAA's adjustments were only inconsequential for one cherry-picked time interval, and very consequential for the whole record."
I indicated a couple of very substantial reasons as to why we should concentrate on the period since 1950. Because there are substantive reasons for the choice of time period, it is not a cherry pick. Suggesting that it is without adressing those reasons amounts to simple name calling as an argument. However, leave that aside.
The simple fact of the matter is that the majority of early twentieth century warming is natural in origin. Anthropogenic factors account for approximately a third of that warming, or according to one recent analysis, effectively none of it. This can be seen by the relative slopes of temperature and CO2 concentration in the early, and late twentieth century:
More substantively, comparing model retrodictions with global temperatures shows the models substantially underpredict the global trend in the early twentieth century:

(Note, the pink shaded area is the model prediction for anthropogenic plus natural forcings.)
That discrepancy can be accounted for almost completely by reference to short term variability not included in model forcings, primarilly ENSO, although the unusual warmth in the 1940s is still not accounted for.
So, with this knowledge in hand, your argument then becomes that the people at NOAA increased temperature trends in the early twentieth century when such increases run contrary to the AGW narative, but did not significantly increase trends in the late twentieth century where such increases would have supported the narrative.
Expanding the analysis beyond the late twentieth century does not make the theory of dishonest adjustments any more plausible. It just means you need to understand more background information to understand the relevance of what is happening.
2)
"You're right about the temperatures, Tom, but that's not what's being compared (by Dr. Cowtan, and by me). What's being compared is the temperature adjustments (i.e., the difference between adjusted and unadjusted temperatures), and they do not exhibit much short-term variability."
Here are the difference between raw and final USHCN temperatures:
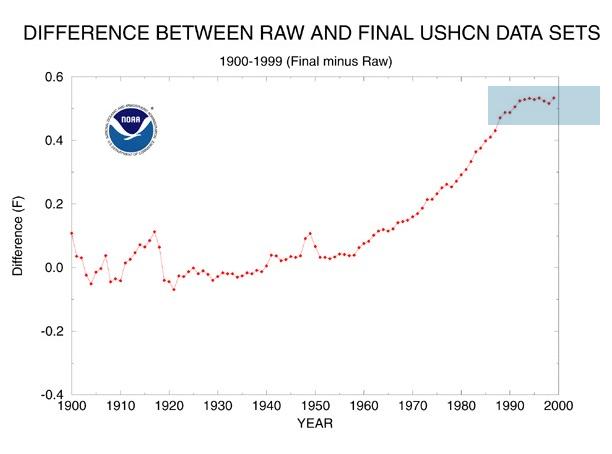
Very clearly, you are wrong to claim "...they do not exhibit much short-term variability". There is substantial short term variablity, particularly in the early twentieth century, and particularly for 1900 itself. That is, of course, for the contiguous United States. Unfortunately I do not know of a similar chart for the global land record, but there is no reason to think it would also lack variability from year to year in adjustments. So while the adjustments show less short term variability than do the actual temperatures, never-the-less, they show substantial short term variability and comparisons of differences should be made using trend values.
3)
"SST is not air temperature, and, unfortunately, the SST data quality through most of the 20th century is even sketchier and subject to more adjustments than the land air temperatures."
First, it would be nice if there was a more or less continuous, global record of air surface temperatures at 2 meters above sea level. Unfortunately no such record exists, so you make use of the records you in fact have rather than pretend to complete ignorance. Those records are, however, strongly relevant. As anybody knows, who has lived both inland and near the sea, the thermal mass of the surface waters mean they absolutely dominate the variability in nearby air masses. That is so even 50 km inland, let alone a mere 2 meters above the surface of the water. Although there will be some difference in the actual values between SST and 2 meter air temperature immediately above the surface, they will not be large and they will be consistent so that trends in the former would have been reflected in trends in the later.
Given this, I regard your exclusion of SST from the record of interest as a mere cop out. It is particularly the case given that all Global Mean Surface Temperature records use SST data over oceans, for want of any better record to use.
Second, the SST temperature data is in fact very extensive, although it does show some coverage lapses (as does the land record), particularly in the Southern Ocean.
Third, while the SST data is also subject to adjustments, they are not subject to "the same adjustments":

(Source)
As you can see, while the net effect of adjustments on land has been to cool the early twentieth century relative to the late twentieth century, the net effect on SST has been the opposite. That is, it warms the early twentieth century relative to the late twentieth century. That is, it reduces the twentieth century temperature trend.
So, if we look at the actual data, it does not support your dismissal, which is shown to be glib, and misleading. Contrary to the impression you convey, combining land and SST data will reduce the global trend from 1900 more than would be the case by simply diluting the 30% land coverage with data with no trend adjustment.
4)
"You can't do that, Tom. It's mathematically incorrect. The percentage difference isn't a sum that you can divide by 11.5 to get the per-decade adjustment-generated percentage difference in warming, it's an average."
Then it is a good thing that that is not what I did. Rather, I projected the difference in adjustment over the last 50 years back over the record to 1900. That, of course, only gives a ball park figure, and given the additional data noted at point three above, underestimates the reduction in the difference for global figures. It is near enough, however, for this discussion.
- Another global warming contrarian paper found to be unrealistic and inaccurate
Tristan at 01:20 AM on 24 October, 2014scaddenp
You can have so much fun with the US siting data, as Steve Goddard likes to do. Everyone can pretend to be a scientist!
- Global warming: a battle for evangelical Christian hearts and minds
paul at 03:18 AM on 4 October, 2014@DSL,
Since Im not a scientist heres a couple of links about the polar ice caps melting.
http://wattsupwiththat.com/2013/12/16/nature-proves-al-gore-wrong-again/http://stevengoddard.wordpress.com/ice-free-arctic-forecasts/
DSL, some models have been proven faulty. Some models are tweaked by omitting some of the numbers. For example, I could show you a warming or cooling trend by cherry picking the years the planet warms or cools and Im not even a scientist.
no global warming for 18 years 1 month
The Great Pause is the longest continuous period without any warming in the global instrumental temperature record since the satellites first watched in 1979. It has endured for a little over half the satellite temperature record. Yet the Pause coincides with a continuing, rapid increase in atmospheric CO2 concentration.
http://wattsupwiththat.com/2014/10/02/its-official-no-global-warming-for-18-years-1-month/
Blogs like this one would establish credibility to openly disavow politicians like Al Gore. Politics using scare tactics to openly advance agendas that have everything to do with money and nothing to do with saving the planet have effectively ruined any and all good faith in the sciences. Many people like me simply do not believe the climate change agenda.
It really irritates me to see blogs like this wanting to win the hearts and minds of Christians by telling them their religion is make believe.
When your minds are already made up about Christians how can you present yourself in good faith?
As for believing the "greenhouse effect" theory I cant really say I do or don't. What I know for sure is that the polar bears are doing just fine, the polar ice caps are doing just fine and last years winter was one of the coldest on record.
I think you guys need to rethink your approach to climate change. Theres been to many glitches along the way and blogs, such as Skeptical Science, never seem to root out the riff raff, such as Al Gore, among the rank and file. It is jaw dropping that he showed his face at the climate change march.
So, spare me the Psalm references and stick to science.
- Global warming conspiracy theorist zombies devour Telegraph and Fox News brains
truthbtold at 08:07 AM on 4 July, 2014The claim by Steve Goddard that 40% of the dataset is estimated (denoted by E on the each datapoint), is interesting. The great thing is all of us can easily experiement with the datasets (current and historical).
I understand scientists need to adjust data for bias, but this post didn't do a lot to educate on:
Why so many adjustments? Why adjust so often? When will the need for adjustments end? How many times does/did a single datapoint get adjusted? Is there a change log for each adjusted datapoint? Is there a changelog between each published datset which tells how many datapoints were adjusted?
In general this post is a good read. But I found this a bit hyperbolic, "The USA represents less than 2% of the Earth’s surface." This is a quasi marketing type statement designed to contrast 98% vs. 2% and make readers jump to conclusions.
Beisdes that, Steve Goddard's accustation of data tampering is about a land based temperature network.
The USA may be less than 2% of the Earth's surface. However it is 6.26% of total land area and ranks 4 of 256 countries. (Russia, Antartica and China are bigger.)
- It's cooling
Dikran Marsupial at 19:56 PM on 8 May, 2014Just to add to Tom's comment on the three recovery winters, thisimage from the NSIDC puts those winters into context very nicely:
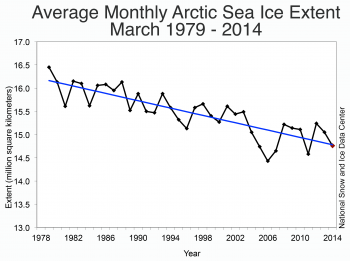
The annual maximum sea ice extent usually takes place in March each year, and as you can see the last three winters have basically followed the long term declining trend in March sea ice.
My recommendation to jetfuel is to look at the long term trends because measurements for individual years or a few years are too susceptible to cherry picking. As Tom says, the winter sea ice extent maximum is not a good predictor of the summer minimum, as it depends a lot on Arctic weather during the summer (which causes a lot of variability around the long term trend). Also we should expect a larger *increase* in sea ice following a decreasing summer minima, simply because it leaves more open water to freeze (which gives a good opportunity for a misleading report of the "recovery", indeed SkS rebutted such arguments made by WUWT and Steve Goddard last year).
- Temp record is unreliable
MA Rodger at 06:18 AM on 1 March, 2014rivetz @296.
Bar the 2012 post with Gobhard spouting off about US temperatures & discussed @297, I note in a later post from March 2013 it is GISS global temperature that the cretin is getting in a huff over. As examining the ravings of a lunatic is not my favorite pass time, I cannot guarantee that Gobhard is totally out of his tree, but I see no evidence to suggest that he is in his tree.
GISS do not "tamper" but make documented amendments. The only significant amendment since Feb 2012 is the change from using HadOISST to ERSST in January 2013. When I plot the data-copy Goddard shows with the latest GISS data I get the same 1880-2012 graph as Sato did for ERESST-Had+OISST. It is not greatly dissimilar to the plot Gobhard presents 1910-2011.
If there are other posts by the cretin, I would hazard a guess that they are similarly well grounded on another planet (probably the planet Wattsupia).
- Greenhouse effect has been falsified
scaddenp at 17:40 PM on 13 February, 2014Sigh, it is pretty hard to take Steve "Co2 falls as snow in Antarctica" Goddard seriously. Now its conservation of energy is wrong? It pretty hard to make sense of what he is saying - I dont think he knows. However, there is excellent series taking you through the text book details at Science of Doom.
- 2014 SkS Weekly Digest #3
Poster at 19:59 PM on 21 January, 2014Tom Curtis Skeptical Science is your stamping ground not mine. If what I posted initially, when knowing nothing of Steve Goddard's reputation, was seen merely as an irrelevance then I apologise for that. You recognise the "research" Goddard reported as "myth" I didn't. Perhaps i should have done and again I apologise. I do recognise however that the pendulum of public opinion is not stationary and may ulimately move to a stopping point that neither you nor I might like. Perhaps a little less confrontation and a little more conciliation might be an approach worth taking to avert that.
- 2014 SkS Weekly Digest #3
Tom Curtis at 14:12 PM on 21 January, 2014Poster:
1) Steve Goddard shows that there is a temperature difference between USHCN v1 and USHCN v2. As both use essentiall the same raw dataset, it follows that the difference is due to come change in adjustments. Steve Goddard then asserts an explanation for the change in adjustments, ie, fraud. He did not survey the literature on the subject. He did not itemize the differences in adjustments between the two. He did not examine the difference between raw and adjusted records at sample sites to identify the reason for the difference. In fact, he presented no evidence whatsoever in support of his hypothesis beyond the original fact it was intended to explain.
As a PhD scientist, you therefore know that he has not supported his opinion in any relevant way. So why are you presenting his opinion as interesting? And given that he has not supported his opinion, pointing out that he has a history of unsupported and ridiculous hypotheses is a relevant rebutal. There is no need to rebut his detailed arguments because he has not made any.2) I find Steve McIntyre's article interesting, in that I once raised with him the issue as to why his "audit" of climate science was so one sided. Why he audited Mann, and Jones, and Briffa, and Marcott etc in such obsessive detail, but never bothered auditing the Salby's, the Morner's, the Easterbrooks, etc. His reponse was that he only auditted things that were likely to make it into the IPCC. His article on Turney, therefore interests me in that it gives the lie to his excuse. Or do you claim that the trapping of the Akademik Shokalskiy in ice is likely to merit a paragraph in the next IPCC report?
- 2014 SkS Weekly Digest #3
Poster at 11:28 AM on 21 January, 2014The comments made here do not surprise. (-snip-). I am surprised that anyone who has supervised graduate students has not learned that some people are not worth reading", I had never heard of Steve Goddard or Real Science until yesterday, had absolutely no knowledge of him or his blog so had no idea whether or not he was worth reading. If you're not immersed in a particular topic (and mine is steroid endocrinology not climate science) you don't know the credibility of a writer until you've read his/her work and has sought comment from those that are familiar with that work. I've done that here but on balance, excepting of course Rob Painting @2, I rather wish I hadn't as no one really likes to be insulted and the oblect of condescension.
That said, and in the context of this blog as I've seen something, I should say something, I've just read an interessting article on the Chris Turney expedition to the Antarctic (tinyurl.com/l7jmgz5) by Steve McIntyre at Climate. I've read a lot of stuff from him and find his explanations are generally clear, seemingly unbiased and credible. But what are the view of the experts? Is he also considered a charlatan at SkepticalScience?
- 2014 SkS Weekly Digest #3
davidsanger at 10:08 AM on 21 January, 2014Rob @2 : so who is "the anonymous blogger calling himself Steve Goddard"?
Does anyone know?
- 2014 SkS Weekly Digest #3
Roger D at 08:49 AM on 21 January, 2014Poster,
I’m not a PHD, or a scientist, but I can relate my reason for cocluding Real Science is worth reading. Maybe “Goddard” is onto something, maybe not with respect to his blog post you mention on the USHCN data. But personally, I concluded that life is too short to bet finding something that will increase my understanding of the Global Warming issue there.
The response you’re getting from others regarding using what “Steve Goddard” has, or more likely based on experience, has not found, is probably because of “Goddard’s” track record of so obviously trying to trick those that read his blog: at some point those that don’t want to be fooled will check him off the list of resources that have any likelihood of teaching them something. It is as simple as that. I’d be interested in finding out about the purported USHCN issue, but he’s likely not the source because lasting contributions to understanding the issues is not his purpose. Just because a lot of people want to believe him doesn’t mean others should (most likely) waste their time.
- 2014 SkS Weekly Digest #3
Poster at 07:45 AM on 21 January, 2014scaddenp I didn't realise I had to reply and my apologies for not doing so. As to whether I'm "stll impressed with that op-ed" the answer is I was never either impressed or unimpressed, it was, as is my comment here, an observation on a publication. At the risk of being moderated to the max I think you and others don't realise that the plebeian world is becoming increasingly disengaged from the stratospheric levels inhabited by the denizens of SkepticalScience. I'm not a climate scientist but I do have a PhD earned from laboratory experimentation in the fields of biochemistry and molecular biology, have published in journals with a credible Impact Factor and have devised laboratory based research projects for and supervised many honours and PhD students undertaking these projects during 33 years as a university academic. If I have a "knack of really finding the dregs" who is the arbiter of dregginess? You? Many who read pieces such as that by Goddard won't think twice about believing what is said is true. "It's published so it must be right" is their maxim. Despite your sneers, I had sufficient nous to bring it to a forum where others better qualified than I, could, if they so wished, objectively crticise and in doing so increase my understanding. To their credit some posting here have done just that and in particular, I think the comments from Rob Painting @2 show the true scientific approach. And to answer the question he asks: Steven Goddard claims that when moving from USNCN V1 to USHCN V2, NOAA manipulated the temperature data so as to give the impression that temperatures are rising steadily. To quote "In USHCN V1, older temperatures were considered good, but recent temperatures were adjusted upwards by about 0.5F. After 1990, no further adjustments were considered necessary. That wasn’t getting the global warming marketing job done, so in USHCN V2 they did the exact opposite. Older temperatures are now cooled, with a hockey stick of adjustments after 1996." end quote. There are a plethora of graphs allegedly supporting these claims. Make of them what you will. The 113 comments following the piece show the writers of (most of) these comments are in no doubt as to what it means. The caveat "most of" is there as I had no desire to read the comments in detail but just quickly skimmed the comments section.
- 2014 SkS Weekly Digest #3
Philippe Chantreau at 04:35 AM on 21 January, 2014Steven Goddard? Really? The carbonic snow guy, so clueless he could not be brought to reason by the phase diagram of CO2? The guy who claimed in a 2012 YouTube vid that the big Arctic storm was going to "halt" the sea ice melt, then later removed that embarassing bit altogether? The guy who averages snow cover percentages without weighing them for area? Goddard indeed does a disservice to mankind by keeping up that blog of his.
If you think there is any kind of choice between trusting Goddard or NOAA, your only excuse may be that you haven't followed this pseudo-debate for as many years as others among us. Whatever it is Goddard has found, it is likely something he can't understand. Instead of trying harder to understand, he then casts accusations, in pure WUWT/climate audit/whatever-crap-is-out-there fashion. I'll remind you, like others above, that allusions of fraud are not welcome here.
- 2014 SkS Weekly Digest #3
Rob Painting at 20:14 PM on 20 January, 2014I agree with your last sentence, but my sentiments are directed at the anonymous blogger calling himself Steve Goddard. Maybe he has discovered some flaw in the NOAA US surface temperature time series, or maybe he hasn't. Goddard has form for making all sorts of ridiculous claims, which suggests digging into his latest claim is likely a ginormous waste of time. Can you summarize what he thinks he may have found?
- 2014 SkS Weekly Digest #3
Poster at 19:18 PM on 20 January, 2014OK I just did see something so I suppose I'd better say something. I hope this comment isn't disappeared because it is deemed to be off topic. Steve Goddard in his blog Real Science has been looking at the NOAA adjustments to the US Historical Climate Network (USHCN) temperatue readings and makes this comment "I spent the evening comparing USHCN V1 and V2 graphs, and discovered a huge discrepancy between their V1 and V2 adjustments". tinyurl.com/k8qh4zf He discusses these at length. It is this type of report that creates unease in many as it suggests that results from "official bodies" might be not be entirely what they appear to be. This, I think, does a disservice to all who are involved in studying the climate.
- 2013 SkS Weekly Digest #43
Philippe Chantreau at 03:18 AM on 30 October, 2013Since he is a chemical engineer, perhaps DSL should ask him if he is aware that, besides making an invalid argument, the same Steven Goddard he's referring to was the proponent of atmospheric carbon removal by deposition of carbonic snow in Antarctica (coz it's really cold down there you know). Last time I looked, WUWT had somewhat cleaned up that thread to make it look less ridiculous, something they have done on many occasions with their more laughable stuff (of which SG was a major contributor).
http://wattsupwiththat.com/2009/06/09/co2-condensation-in-antarctica-at-113f/
The comment thread is still a class act of ignorance, stupidity and arrogance. The peanut gallery bought the thing hook, line and sinker, despite the occasional voice of reason pointing to vapor pressure and the phase diagram.
They eventually let Steven go and be ridiculous by himself, something he did notably in 2012 on YouTube, when he said that the big storm was going to halt the Arctic sea ice melt. He later removed that clip from YouTube. I can attest of that because I responded on the comment thread. The clip no longer figures on his channel's list.
You'd think such a heavily credentialed engineer would know better...
- The Sun Has Cooled, So Why Are The Deep Oceans Warming?
DSL at 23:54 PM on 29 October, 2013Here's his attempt at intimidation:
"Nice try. BTW, I am a Chemical Engineer who graduated from the top-ranked undergraduate engineering school in the country. I was awarded U.S. Patent #5,348,662 for the development of a wastewater recycling process.
And I obviously know more than you do, because I know how to navigate hyperlinks on the Internet."The link he's referring to (and referring me to) is Steve Goddard's claim of recovery based on one year's growth in 1m+ ice. No comment when I pointed out the flaw in SG's implied argument--and the implied error in judgment by this guy for even reading such garbage.
- 2013 Arctic Sea Ice Extent Prediction
P.T. Goodman at 09:26 AM on 10 June, 2013I found out more than I needed to know about Steve Goddard when he infested a Washington Post Op-Ed called Climate science tells us the alarm bells are ringing by posting 500 comments out of less then 5000 this weekend. Truth be told, I lost count of his comments last night at about 200 but he has been hard at it all day today. Sadly, the Washington Post blogs has very loose moderation standards, so anyone can get away this this stuff. It just makes it impossble to have a real discussion about climate change, but I suppose that is Goddard's goal. They just don't want others talking about climate change.
- Why SkS withdrew from the Bloggies
DSL at 14:27 PM on 3 March, 2013Climaate4All, you're not serious. Science is essentially skeptical. What Willis Eschenbach does regularly at WUWT is not skeptical. The response to Steve Goddard's odd musings is not skeptical. The WUWT comments policy (or, rather, its enforcement) does not encourage skepticism. Note that Watts performed his first study on surface stations and didn't get the answer he wanted, so he tried it again (and had a rather embarassing fail, despite having trumpeted it as a back-breaker before it had even been peer-reviewed. What a showcase of skepticism!). Skepticism is not simply doubt. Consider the recent Luedecke fiasco. Would you call editor Zorita's decision to publish Luedecke properly skeptical? Would you call the Washington Times decision to publish this properly skeptical?
What would you call a properly skeptical blog?
- 2013 Arctic Sea Ice Extent Prediction
Roger D at 09:04 AM on 22 February, 2013My "prediction" is 4.2million Km2, based on cheating, i.e. putting a straight-edge up to the computer screen, and eyeballing a vertical line through Gavin Crawleys prediction line in Fig. . The intersection for 2013 minimum is ~4.2 million Km2 (with a low of ~3.2 and a high of ~5.1 million Km2)
Given that Gavin's predictions have proven better than average, and also that there is an ongoing trend of less multi-year ice (oops, sorry Steve Goddard, I mean an ongoing trend of "increasing extent of Jan-Sept. ice growth") it doesn't make any sense to choose something like 5million Km2 as a likely ice extent, and then put an error bar on that.
- Arctic sea ice has recovered
Roger D at 02:17 AM on 16 February, 2013No, No, everything's OK with Arctic ice (kidding). Steven Goddard has a plot on his site showing that recently, there was the "Most Ice Gain Ever Recorded". What the plot seems to show is sea ice area change from the summer minimum to the cold season maximum. If the summer minimum extent is in a general, pronounced, downward direction, but spring max ice extent is holding steady or decreasing much less slowly it seems maybe the plot could reflect reality. But of course he's misusing that reality to imply something that is not true: i.e there's no "problem", by only highlighting a fraction of the story and then counting on his readers lack of curiosity and predjudices to make the incorrect assumption that arctic is is just fine - instead of for example seeing that the graph would represent the replacement of multiyear-age ice with one year old ice, among other things. "Skeptics", sheesh.
- Humidity is falling
Philippe Chantreau at 00:01 AM on 16 February, 2013You're citing Steven Goddard? Seriously?The Steve Goddard of Antarctic carbonic snow fame, who covered himself and WUWT with so much ridicule that Watts eventually had to distance himself from him? The guy who couldn't grasp the message contained in the phase diagram of CO2? The Steve Goddard who averages percent of snow cover without area weghing so he can come up with ridiculous numbers? The same guy who is now arguing that the Arctic is seeing an unprecedented ice gain (one of his funniest yet)? That's you source? You trust it?
The precision that can be derived from thousands of measurements gathered from thousands of sources is much greater than the precision of one individual source. Research that before jumping to conclusion. Why would you believe that the scientist studying this don't do their homework?
Instead of gish galloping across areas of which you seem to have limited understanding, why not stick to the subject. Earlier you made an argument that appeared to suggest that CO2 "displaces" H2O as a greenhouse gas. That is quite new and exotic, you should elaborate on that with scientific references (Steve Goddard does not qualify as such).
- Humidity is falling
Jeff313 at 23:19 PM on 15 February, 2013(-multiple off-topic and inflammatory snipped-)
- Icy contenders weigh in
DSL at 14:58 PM on 7 February, 2013YubeDude, what is Goddard trying to claim? That sea ice is recovering? (Actually, it is re-covering in the Arctic, ha ha ha) He'd do better to cherry-pick days 89-115 of the Arctic sea ice area, when, gasp!, the 10-year linear trend is positive! (ignore the beast getting ready to walk in the door at day 158. Keep combing over it, Steve! There will be little rhetorically valuable gems from time to time -- just show em quick and sell em hard.
- 2012 Shatters the US Temperature Record. Fox, Watts, and Spencer Respond by Denying Reality
villabolo at 06:41 AM on 16 January, 2013
Somewhat off topic but it was mentioned in the article - what's Steven Goddard's real name? - Antarctica is gaining ice
John Hartz at 01:20 AM on 22 September, 2012
Here’s yet another article hot off the press about the topic du jour.
Does the expanding Antarctic sea ice disprove global warming? by Eric Berger, SciGuy Blog, Houston Chronicle, Sep 21, 2012
Berger’s opening sentence: “Ice is a hot topic in the climate science community right now so let’s talk about it.”
Berger’s concluding statement: “The bottom line is that scientists generally have predicted that the Antarctic sea ice will not begin substantially melting until the second half of this century.”
Berger’s blog post was created in response to the recent pious pontifications about polar ice by non-scientists James Taylor and Steve Goddard. - Surface Temperature Measurements: Time of observation bias and its correction
Shoog at 04:34 AM on 8 August, 2012
Hi there,
First post here so go easy.
I have a goof handle on the TOBS issue but was countered in a discussion with the following blog by Steve Goddard;
http://stevengoddard.wordpress.com/2012/08/07/smoking-gun-that-tobs-adjustments-are-garbage/
The jump in the graph at around 2000 seems real enough, but there doesn't seem to be enough information to assess the validity of his claim. Can anyone take a look and tell me what is going on.
Stephen - NASA Climate 'Skeptics' Respond with Science! Just Kidding.
Tom Curtis at 18:02 PM on 12 April, 2012
In the OP, Dana says of the letter's signers that "... we have a bunch of former administrators, astronauts, and engineers who between them have zero climate expertise and zero climate science publications." I had noted that one of the signatories was billed as a meteorologist, so a little further exploration was in order.
As it turns out, a search of Google Scholar for author: Wysmuller turns up no papers published by any "Tom Wysmuller" at all, so it turns out Wysmuller is not a published scientist in any field.
At his very own anti-global warming web site, where Tom Wysmuller offers to lecture on global warming for a fee (from universities) or for free (for high schools) we learn that he was an intern at NASA, but that since then he has been:
"•Admin Director of Govt. Operations at Pratt & Whitney, where he wrote the code that solves the Polynomial Regression Algorithm now resident in millions of Texas Instruments calculators.
•Insurance Executive & Board member of insurance and other companies/orgs.
•President of NYU’s Alumni Association.
•Vice Chairman, The New Netherland Museum, where in May, 2001, the New York City Council issued a proclamation honoring his historical contributions."
Curiously given above comments @9 and @10, from linkedin we learn he was on the Board of directors of Delta Dental.
Finally, from Marc Morano we learn that he worked for the Royal Netherlands Meteorological Institute (although Morano mistranslated the organizations name) as a "weather forecaster".
So Dana is right. Even from the most promising candidate, there is no actual experience as a climate scientist, or in the professional study of climate.
What is more, from Marc Morano we learn that he believes that,
"The largest contributor to carbon dioxide in the atmosphere is the warming oceans"
which gives a the quality of evidence that the former NASA employees consider "proven". Ironically, in one essay he even uses a Steven Goddard reproduction of the IPCC First Assessment Report estimate of medieval temperatures based on Central England Temperature series back to the Little Ice Age, and an educated guess based on European anecdotal evidence before that. I guess "proven" means something entirely different when the conclusions are ones that you like. - Uncertainty Is Not the Basis for Investment
chriskoz at 14:25 PM on 22 February, 2012
Byron @4,
You are incorrect in your assumption that above temps are scaled in F.
Temp anomalies in ice cores do span indeed 6-8K (or degC), as we've shown here:
http://www.skepticalscience.com/co2-lags-temperature.htm
whereas the anomalies in a similar graph scaled in F, do span ~20F, (interestingly the denialist sites are more likely to scale it in F), e.g. here:
http://stevengoddard.wordpress.com/2011/06/19/vostok-cores-show-zero-climate-sensitivity-2/ - 2012 SkS Weekly Digest #4
tonydunc at 12:38 PM on 31 January, 2012
Around 2 years. Since before climategate 1 broke.
Think I just found it noodling around. maybe form Realclimate. maybe from Real Science - Steve Goddard's blog.
I Look at the site at least whenever something is posted on it. Often when mentioned in other blogs. Does listening to John on "the Climate SHow" podcast count?
What I would like to see discussed is how to mobilize more people to engage in analysis of as many skeptic articles on various blogs as possible. I read many, and while I have a foundation in principles of physics and vaguely chemistry, many arguments (outside things like logical inconsistency) are over my head. There are enough people interested in the reality to work on cataloguing and getting expert help on the validity of the facts used by skeptics.
Sometimes SKs posts numerous skeptic articles that are never dealt with, and there are literally dozens of denier sites spouting "proofs" of the demise of ACC. - Is Greenland losing ice? (psst, the answer is yes, at an accelerating rate)
John Russell at 03:33 AM on 1 January, 2012
Having read a post about Greenland temperatures on the 'Real Science' website, I responded, based on graphs from the NASA GISS website. Steve Goddard has now made a post out of my response called 'A Glimpse Inside the Alarmist Mind' with a graph that appears to show that Nuuk temperatures have been steadily going down while CO2 has been rising. I have no idea where he gets his data (he doesn't say) which seem to contradict data from other websites.
I'd be interested in any thoughts which might help my response. - Satellites show no warming in the troposphere
Sapient Fridge at 18:46 PM on 25 December, 2011
Is there a prize for the finest examples of cherry picking?
I just had a "skeptic" tell me that the satellite data is biased because they were launched in 1978 which was "one of the coldest periods on record". This was his "proof", a post from Steven Goddard:
http://www.real-science.com/dessler-partially-correct
The temperature data comes from a *single* location in Greenland (Nuuk)! - Hiding the Incline in Sea Level
sailrick at 14:07 PM on 15 November, 2011
@apiratelooksat50
" I don't know of any skeptics making a claim that sea level rise has ended"
I guess you haven't seen the Steve Goddard posts at W(-snip-)UWT
Of course, you did use the term "skeptic", so you may have a point. - Visual depictions of Sea Level Rise
Shibui at 03:06 AM on 16 October, 2011
According to Steven Goddard at Real Science, the Envisat data is showing a drop in sea levels.Does anybody have any information on this? - Pielke Sr. and SkS Disagreements and Open Questions
Tom Curtis at 08:43 AM on 13 October, 2011
It seems to me that two graphs by Tamino would help illustrate this discussion.
The first shows the statistical significance of linear trends in Gistemp from the start year to June, 2011:
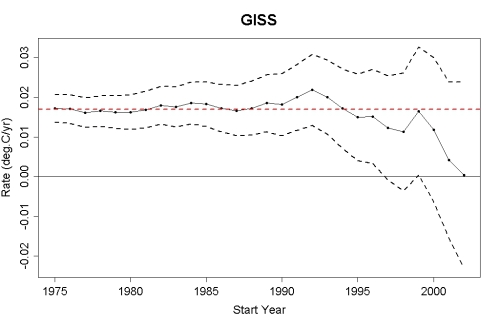
Although Tamino uses a different temperature index (because he is responding to Steve Goddard, not Dr Pielke, the point remains the same. In the case of Gistemp, the trend since 2002 has insufficient data to distinguish between an underlying trend of between +/- 0.24 degrees C per decade. That is, consistent with the data, from 2002 to June, 2011, the temperature data could reflect a long term warming or cooling of 0.24 degrees per decade plus noise. (Please note the confidence interval is estimated by eyeball, so it could be +/-0.02 from indicated value.) It is likely that UAH or RSS will constrain the trend even less over such short intervals in that they react much more strongly to ENSO events than does the surface temperature data.
For completeness, the Gistemp data from 1998 to June, 2011 is consistent with long term trends between +0.27 degrees per decaded and -0.03 degrees per decade.
In contrast, the trend since 1994 (17 years ago) could lie between +0.08 and +0.28 degrees per decade. That from 1981 could lie between +0.13 and +0.23 per decade.
The possible range of the trend increases from 0.1 degrees per decade for 30 years data to 0.2 for 17, 0.3 for 13 (1998) and 0.48 for 9 (2002). As the temperature data itself never varies by more than 0.023 over the period shown, or by more than 0.01 degree in a single year, decadal trends with uncertainties greater than ten times those values are clearly useless.
Fortunately we are not in a situation in which we do not know the major sources of noise in the global means surface temperature. The three strongest sources of noise are, in order of strength, ENSO, volcanic eruptions and the eleven year solar cycle. Because these sources of noise are well known, and their strength quantified, their influence can be removed from the temperature data:
(Click on image to read accompanying article.)
As Dr Pielke believes the "flat" trend from 1998 (and 2002) is significant, perhaps he could point to the flat trend in the data once adjusted for these well known sources of noise? - Changes in Arctic Sea Ice: Young and thin instead of old and bulky
villabolo at 19:27 PM on 10 October, 2011
"The Arctic Ocean is in a Death Spiral. Personal estimate! Effectively Ice free in Summer by 2016"
Don't tell Steven Goddard that. He actually said that the ice cap had quadrupled in thickness since 2008! - Lessons from Past Climate Predictions: Arctic Sea Ice Extent
scaddenp at 13:37 PM on 7 October, 2011
Tom, pixel counting has its hazards (ask Steve Goddard!) - is the map you are counting from drawn on polar equal area projection? - 2011 Sea Ice Minimum
muoncounter at 05:30 AM on 28 September, 2011
"likely continue to delude themselves"
Delusion indeed. See the comments at Peter Sinclair's Sea Ice Min video posting:
"I’m (one of the ones) siding with Steven Goddard. He was right."
It's funny because the video has the NSIDc's scientist saying "being the 2nd lowest vs the lowest is not really recovery." - Climate Denial Video #1: The Difference between Skepticism and Denial
sailrick at 15:54 PM on 5 August, 2011
@ Dale
"I find this an interesting comment, since wouldn't the WUWT diehards say the same thing about here (substituting relevant terms)? That is why I read and post at both sites. As I said above, I come here for an AGW slant, and I got to WUWT for a non-AGW slant."
So you come to Sk Science for the science, and WUWT for ....?
The fake graphs by Steve Goddard on Arctic sea ice and such?
Watts and Goddard - Sea Ice
http://climatecrocks.com/2010/11/24/lively-times-at-wuwt/
"Climate Cherry Pickers: Falling sea levels in 2010"
"... recent post by Steve Goddard which casts doubt on the fact that we've experienced record hot temperatures over the last year, citing falling sea levels in 2010."
http://www.skepticalscience.com/Climate-Cherry-Pickers-Falling-sea-levels-in-2010.html
"Arctic death spiral: Naval Postgrad School’s Maslowski “projects ice-free* fall by 2016 (+/- 3 yrs)”
"But in the land of make-believe, Watts and Goddard say: "Arctic ice extent and thickness nearly identical to what it was 10 years ago."
June 6, 2010
http://climateprogress.org/2010/06/06/arctic-death-spiral-maslowski-ice-free-arctic-watts-goddard-wattsupwiththat/
The fervor over a meaningless paper by Spencer?
"Just Put the Model Down, Roy" (Spencer)
by: Barry Bickmore July 26, 2011
http://bbickmore.wordpress.com/2011/07/26/just-put-the-model-down-roy/
The faked graphs that an article by Watts and D'aleo used to make this claim?
"NO WARMING TREND IN THE 351-YEAR CENTRAL ENGLAND TEMPERATURE RECORD"
Open Mind
http://tamino.wordpress.com/2010/02/15/summer-and-smoke/
They get their heads handed to them by Tamino
Long story short, Anthony Watts (of Watts Up With That) and D'Aleo left out the 19th century and only used summer data, leaving out winter data, to arrive at their quackery graph. Of course summers in the period were relatively cool, while winters were relatively warm. Even for skeptics, this one takes the cake for cherry picking.
there are many more examples where those came from
What you see as balance, is like having to present someone who believes the moon landing was faked, everytime NASA has something to say about space research and exploration. - Sea level rise is exaggerated
Tom Curtis at 14:00 PM on 21 July, 2011
Camburn @167, the proper thing to do when you have flawed data is to report both the data and the flaws. So called "skeptics" have been very critical when climate scientists have supposedly done otherwise, as, for example, with "hide the decline". Of course, they did not do otherwise in that case; and it would be wrong for AVISO to not publish their envisat data, so long as they also publish their reasons for thinking it may be flawed.
The problem here is not with AVISO but with people such as Steve Goddard, who purport to have a scientific education, and hence should be aware of the pitfalls and qualifications that exist in the data, but who publish a cherry picked selection of the data to a popular audience without any mention of the problems that may be involved. That is, IMO, dishonest. It deliberately cultivates misunderstanding in order to persuade people to a view point that is almost certainly false. - Sea level rise is exaggerated
Bob Lacatena at 06:20 AM on 21 July, 2011
Don't blame poor Camburn. He's just echoing the siren calls of the great minds ofdenialismskepticism, like that Arctic ice prognosticator of prognosticators Steven Goddard. Goddard has a post about how the evil scientists that launched and run all of these nefarious, one-world-government-oriented satellites have hidden the decline in sea level rise by using a hard-to-notice color (yellow) for the Envisat data on their graphs. Evil, yellow-wielding scientists! Curse them and their foul color choices!
He fixed that on his blog (by changing the one he likes, Envisat, to blue, while one he doesn't like, Jason-1, to the yellow that was originally assigned to Envisat... I don't know why he didn't do away with yellow completely and use black, maroon, dark green, dark gray, or any other clearly visible color -- pot, meet kettle kind of thing):
Of course, the fact that none of them seem to notice how closely all of the other data sets agree, while Envisat is a clear outlier that is off throughout its existence, doesn't appear to enter their observations or logic at any point. It couldn't possibly be that the Envisat data as currently badly calibrated, could it?
I can see the post a year from now, when they sort it out and the cry becomes that they "homogenized" the data to look the way they want it to. You can't win with some people (some = those with a serious confirmation bias wired into their nervous systems). - Carter Confusion #3: Surface Temperature Record Cherries
Tom Curtis at 14:06 PM on 17 July, 2011
Camburn, it is not Tamino's analysis per se. It is Carter who ended his first false "trend line" in with the Dec 1996 datum, and started his second false "trend line" with the January 1999 datum. In order to analyze what Carter had done, Tamino had to do the same thing, only with real trend lines. Consequently your implied suggestion that Tamino was cherry picking is unwarranted.
What is more, Tamino has already adressed the issue several times. Most recently he addressed it yesterday in discussing Steve Goddard's cherry pick of almost exactly the graph you cherry picked (he terminated his before the recent rises in global temperature since March). Before that he addressed it in "How fast is the Earth warming".
And if you think I have been vitriolic, try posting that Tamino's analysis of Carter is correct, and that Carter is a "" on WUWT. - Why Wasn't The Hottest Decade Hotter?
villabolo at 17:47 PM on 15 July, 2011
Robert Gates @ #20:
"If you listen to the AGW skeptics, they are preparing for a Little Ice Age to begin any day now and to last for decades."
What I've seen at WUWT and Steve Goddard's sites is that they, and their posters, are predicting everything and anything. I challenged Goddard to give his prediction for the state of the Arctic ice cap in 2020.
His answer was that the Arctic ice cap would grow, shrink or stay the same. I taunted him on the predictive power of 'skeptic' science.
Their Orwellian view amounts to "The earth is cooling, it's cooling! Isn't it good that it's (naturally) warming (we'll get to pet the dinosaurs)."
Since they have set the 'goal posts' everywhere, they cannot go wrong.
In any case, we have a thermal lag of 1F(?) within 30 years and a highly reduced Arctic ice cap. What's the calculated rise in temps for an ice free Arctic, 5-6F?
That, in turn, creates a feedback loop for Siberian Methane production due to increased melt and methanogen metabolism.
As for aerosols, China might be giving us a large chunk of it but, if we were to have a global depression, all nations' aerosols would be lowered.
I don't think that GW will be leveled by the 'three sisters'. - The Planetary Greenhouse Engine Revisited
LazyTeenager at 08:30 AM on 16 June, 2011
The thing which struck me about Steve Goddard's venus article on WUWT (its all due to pressure not CO2) is that he used the diifferential form of the formula for variation of temperature with height. The normal formula would have had an integration constant T0. This means he managed to neglect/ignore/hide an important variable that in effect describes the overall the
temperature of the atmosphere. - Impacts of a melting cryosphere – ice loss around the world
villabolo at 14:14 PM on 10 June, 2011
For entertainment purposes only:
Arctic ice decline stopped 5 years ago.
Most of the Thick Ice Was Lost Between 1988 and 1996. - Are you a genuine skeptic or a climate denier?
Bob Lacatena at 00:12 AM on 7 June, 2011
Eric the Red,
Wow.
One short post, and so much denial crammed right in.That sounds fine, but I do not see the lines of evidence converging.
Okay, first, please realize that this statement puts you squarely, categorically, and without question, into the status of "denier." You cannot say anything close to this without wearing that label. There are so many lines of evidence, and it is all so damning, that to say otherwise is nothing but denial
The models appear to converge but the data appears to diverge.
Look closer. There's no need whatsoever to qualify it with "appears." And the data converges. It absolutely converges, and to think otherwise is denial (either willful, or through ignorance)....that the current science is settled. This is not the response of someone who is absolutely sure about his belief, but rather someone who is desperately afraid that his belief is losing ground.
Again, another comment that squarely identifies you as a denier.
There is another option is that the science is so strong that cockamamie wishful thinking ideas (like GCR's and the Iris Effect) are not going to change anything.
Please note that using the word "settled" is another strawman... no science is ever "settled" because it's always advancing and progressing, and in complex systems, there will be lots of mistakes... but the overall direction is solid, and we are quickly approaching the point where it will be impossible for any body of evidence to overturn enough of it to support the denialist position.However, the amount of unsults hurled at those who merely suggest an alternative is unfathomable.
First, I don't see anywhere near this volume of insults. Certainly not here at SkS, and certainly not at WUWT. I think you are being overly sensitive, or perhaps view being corrected as an insult. You must be able to take criticism, particularly if you are going to be tragically wrong, and then cling to your mistakes like an, oh, I don't know, let's call it "a denier."
And "merely suggest" is another strawman. You're not talking about cases where someone merely suggests something. You are without question talking about a case where someone suggests something, has their errors pointed out to them, and then clings to that belief and hammers at it and sticks to it and won't let go.
Big difference.One of my favorite contradictions is the denier label thrown at those who suggest any kind of natural variability or forces, and then those same hurlers acknowledge that there is natural variability when accused of ignoring it by others.
Another example of denialism, and a lack of understanding of the science. Why can the system not have natural variability, but be dominated by a particular imbalance? The scenario you portray is another typical denial ploy, by first misinterpreting the facts behind natural variability to imply or even "prove" that anthropogenic effects are negligible, but then to accuse the scientists of ignorance by implying that the existence of natural variability hasn't really occurred to them.
This is a total non-issue, or rather, it's only an issue manufactured and supported by deniers.
It's nonsense.The science is not as solid and well known as many people here appear to think. This is what we are discovering as more and more research is undertaken.
The science is far more solid than you portray it, and with every passing month more and more papers are published that support, not refute, the current science.
You are deluding yourself.
In that one, short post, you made statements that provide strong evidence that you are unequivocally and inarguable a denier. You included five typical, indefensible denial talking points, and in a sixth, you used a typical denial tactic (using exaggeration to create a strawman).
I really don't know why you guys are so sensitive about the word. Call yourselves deniers and be proud of it.
Or change your behavior, look more closely at the data, and figure out where you are going wildly, unarguably and dangerously wrong.
You are responsible for what you believe! You will be responsible for whatever actions we take, or fail to take, as a society.
There is no escaping this. You are being vocal. You are deciding that your opinion matters, and that you must stem the flow and tide of climate science.
You are responsible. Live up to that responsibility.
Instead of seething with anger and coming back with a post to show what a meanie I am, and how you're right and I'm wrong, use your time go study.
Find out how the lines of evidence do converge.
Find out how the data is converging.
Find out exactly where natural variability does or does not influence the system, how and why.
Find out what the latest papers say (really say, not what Anthony Watts or Steve Goddard claims that they say).
Find out what the vast, huge, damning bulk of the papers say.
Look with an open mind at how deniers are actually treated here, and on other sites (as in, are their ideas new and well thought out, and presented politely, or are they foolish Internetisms that have been seen over and over again, debunked a hundred times, and yet they cling to them and will not let go).
Stop fighting with me. Stop for five seconds to think that maybe you are wrong, and this is important, and maybe you have been mislead, by your own desires, and by others.
Stop being a denier. - The Critical Decade - Part 1: The Science
les at 04:41 AM on 30 May, 2011
Fascinating.
this graph is doing the "denyosphere" rounds, not least of all goddard showing sea level as being the lowest since 2004; but an overall rise of 0.76mm/year...
It comes from aviso for Envisat without Glacial Isostatic Adjustments applied. With those corrections it would be 1.6mm/year (2004-2011). The site also allows you to view each altimeter individually, all on the same graph; with and without their various adjustments.
In addition to 'just' showing Envisat - the oddest looking results and therefor the favorite of the "denyosphere" - you can see Jason-1 and Joson-2 individually - showing 2.75mm/year (2003-2011) and (a very wobbly) 2.44 mm/year (2009-2011).
Their overall processing result is, as in 54, 3.25mm/year (1993-2011) as shown here.
My point being that it's just childish to quote one or two numbers out of context and then claim 'fowl'.
The data and tools out there are so good... why do people just quote a couple of numbers and 'eyeball' trend-lines. weird! - The Climate Show Episode 13: James Hansen and The Critical Decade
NikFromNYC at 22:10 PM on 29 May, 2011
James Hansen? Oh that's the 1988 prophet, "the first to ring the bell" which lead to the IPCC! How is his prophecy working out, I wonder? But wait, I thought it was worse than predicted, and then worse still, even though his best case scenario has not been exceeded (not even by GISTEMP). Hmm....
He makes the circular argument that the much higher past T shown in the Greenland ice core didn't matter since mud cores from non polar regions show lesser high past T since warming is "amplified" on top of an ice sheet. But he fails to complete the circle of logic, by rights discounting in kind that current T rise in Greenland must also be "amplified" instead of representative. What he should have said, of course is that mud cores UNDERNEATH THE OCEAN are in fact attenuated due to the massive thermal inertia of the oceans, and the much vaunted Global Average Temperature does not refer to the bottom of the sea but to the air and the top of the sea.
He again mentions massive sea level rise that will require a rate 5X as high as what actual sea level rise has been stuck at 3 mm/year (and recently plunging) for decades and tide gauges still show more like 2 mm/year instead ramping up to match the satellite record.
And yet I'm in "denial" if I don't believe his prediction of the future? I certainly do deny that his past predictions have shown any competency whatsoever. That NYC where I live two blocks down from Tom's Diner and GISS was to have the West Side Highway next to the Hudson River under water in 20 (later retroactively switched to 40 by the reporter involved) years from 1988, well, wouldn't *that* require that the NYC tide gauge would show some sort of trend change? It doesn't.
Have any of you taken the time to actually browse single site tide gauge records to confirm what you would expect, namely that the oldest records that continue to this day, dozens of them, should mostly show a recent upturn in the rate of sea level rise? Good luck hunting for any that do! I think I found one or two, a tiny minority, that did in a literal sea of unwavering trends. Those that show declining trend also show no slower decline, recently. But, never mind, at least you have statistical studies that prove your case even though the input data doesn't support the results. - Skeptical Science Educates My Students
JMurphy at 07:02 AM on 26 May, 2011
Anyone who gives any credence to WUWT as a source of unbiased information (of any sort, let alone scientific), needs to go to WottsUpWithThat now and again, if they want to stay properly informed.
They must obviously also have missed this classic :
Canadian Harp Seals In New England (“prediction” of cooling?)
And his use of dodgy photos :
Ice at the North Pole in 1958 and 1959 – not so thick
Also, don't forget the many Steven Goddard 'classics' - so many, in fact, that even Watts had to let him go.
(And that is just skimming the surface of the murky pond)
Anyone who wants to maintain any scientific credibility does NOT refer to WUWT for anything but laughs. - Lindzen Illusion #2: Lindzen vs. Hansen - the Sleek Veneer of the 1980s
Albatross at 01:26 AM on 30 April, 2011
Tonydunc @23,
I would really not concern myself about what someone so throughly discredited as Goddard thinks. Goddard has a very long reputation for mangling and misrepresenting the science and for being inept in scientific matters.
Note too how Goddard chooses to misinform from the safety of his blog rather than come here and try to pass of his misinformation.
I could say more, but this is Dana'sa post, so I'll let him reply if he feels so inclined.
PS: Philippe, Goddard no longer "works" for Watts, apparently Goddard's standards are event too low for Watts. And let us not forget that Steve Goddard is a pseudonym, yet Watts allowed him to frequently post on his blog even though he allegedly has a rule about not allowing people to post under pseudonyms. - Lindzen Illusion #2: Lindzen vs. Hansen - the Sleek Veneer of the 1980s
tonydunc at 00:36 AM on 30 April, 2011
Mr. Cook,
I have just read a critique of this post from Steve Goddard. He says you are wrong about almost everything related to this comparison.
http://stevengoddard.wordpress.com/2011/04/29/skeptical-science-cheating-4x/
1. "he says that ONLY scenario A is reasonable to compare to Hansen's predictions."Hansen made three forecasts, Cook picked scenario “B” which Hansen described as “a reduced linear linear growth of trace gases.” Obviously that has not happened and is not the correct one. He should be comparing against scenario A. Joe Romm says that greenhouse gases have been “accelerating super-exponentially.”
2 "He used Hansen’s temperature data to verify Hansen’s predictions. That is like trusting Al Gore’s lawyers to count ballots in Florida." I assume by this he means that Hansen himself decides what the figures are after manipulating the the numbers from the satellites, and there is no confirmation of the accuracy from other sources.
3. You "offset Lindzen’s start point downwards by half a degree. Obviously the data needs to be normalized before comparing."
"4. He drew scenario B below Hansen’s actual scenario B. Note the red line above is too low."
"5. He drew Hansen’s measured data too high. The thick red line below and horizontal bars are from the GISS web site. The black line above it is what Cook drew. Hansen reported 0.63 for 2010, Cook placed it above 0.7"
"In summary, he used the wrong projection, he let Hansen officiate, he didn’t normalize Lindzen’s data, and he misplaced both the projection and the results on the graph."
Mr. Goddard has repeatedly said you are dishonest and that global warming alarmists websites ignore comments from skeptics who try to correct their mistakes. I commented that I would be willing to post his objections since I like to hear both sides of a disagreement.
I have pointed out to Mr. Gorddard that he repeatedly misrepresents Hansen's original graph, by ignoring that Hansen acknowledges the 4.2° CO2 doubling to have been wrong, so I am glad to see that he did not question that.
Finally a commenter on the site says this is a straw man argument since Lindzen has never made any actual predictions. It seems rather odd to me that that would be used as a defense of Lindzen, since being the most cited ACC skeptic, it would give him much credibility to have done so and therefore have show the greenhouse effect to be as inconsequential as he maintain. Mr. Goddard did not show an adjusted graph where Lindzen's parameters would show a better fit than Hansen's using any standard source of temp data. - Preference for Mild Curry
robert way at 12:26 PM on 28 February, 2011
Protestant,
First of all I was using Gavin Schmidt's evaluation of her not my own. And yes Gavin Schmidt is far more qualified than she is on the subject. Secondly, Dr.Joseph Romm's word I would trust before Dr. Curry's on the subject of climate science. Thirdly, where do you come off attacking my academic qualifications in paleoclimate? I'm just curious how you seem to be so aware of my background or what groups I work with. Finally, the biggest misinformation/ad hominem place in the field is steven goddard's site without a doubt, 2nd is WUWT do you need for me to go and fetch you tangible evidence? - Monckton Myth #7: Snowjob
Tom Curtis at 07:16 AM on 25 January, 2011
Following up on this article with a few google searches, I think I may have found the source of Lord Monckton's error. In particular I found an article at Watt's Up With That called "Northern Hemisphere Snow Extent Second Highest on Record". (Google it if you want to see it. I don't link to trash sites.) In this article, Steve Goddard produces a graph of NH winter snow extents with a clear upward trend. Looking closer, it becomes obvious the trend in introduced by carefully selecting a start year of 1989. (Sceptics to often produce odd trend lines in graphs by because of the start date for it to be other than carefull selection.) Had the potty Lord seen an earlier version of the graph, it would explain his belief that the winter of 2008 had the highest snow extent. - Not So Cool Predictions
tonydunc at 05:14 AM on 4 January, 2011
I just got this paper off Steve Goddard's site.
http://www.pas.rochester.edu/~douglass/papers/KD_InPress_final.pdf
While many of his postings are totally meaningless or worse, this seems to clearly say that there is no heat buildup in the oceans, for the last 8-10 years of so. Of course that is not a very long time period, but it makes sense to me that there there would be amore consistent rise in temps in the oceans than on land.
Maybe John someone here can comment of the accuracy/meaning of these results - Arctic Ice Part 2: A Review of Factors Contributing to the Recent Decline in Arctic Ice
eldorado2768 at 07:26 AM on 2 January, 2011
Could someone please comment on this satellite data which appears to show increase in arctic ice thickness over 2 year period from 2008-2010.
PIPS Data - Debunking this skeptic myth is left as an exercise to the reader
Rob Honeycutt at 07:06 AM on 18 December, 2010
This all kind of goes back to what I was saying in the article I did on Why Does Anthony Watts Drive an Electric Car? The more solid the evidence for climate change becomes the more extreme and outside the realm of science the challenges will be. You see that here with the silly claim that the Earth's orbit is degrading. And I think we increasingly see it with people like Steven Goddard and Anthony Watts. Same with Spencer, Michaels and others.
Watts' recent irrational post over the difference in the anomaly between UAH and GISS is a perfect example. He's so intent upon finding a problem, because his whole world view is based on AGW being wrong, that he skips very basic, utterly elemental steps, like adjusting for differing base lines. (Sorry, I know that's OT.) And worse, when it's pointed out, rather than saying "whoops, sorry that was a silly mistake on my part" he goes overboard trying to defend his mistake.
I think the climate change issue is rising to a new level lately. The science is even more solid than ever. That means there is probably going to be an equal and opposite reaction the likes of responses like these.
I predict a whole new series of denier issues are going to start coming to the forefront soon. - 2nd law of thermodynamics contradicts greenhouse theory
muoncounter at 03:29 AM on 27 November, 2010
#143: "the so-called greenhouse gases, that emit and absorb radiation; Rabbet is acknowledging that adjacent GHG molecules will absorb GHG emitted photons."
Your logic continues to spiral downwards. GHG molecules absorbing photons increases the temperature of the atmosphere -- and hence, warming.
"and further to Jelbring" I have no particular interest in Jelbring; I assumed that was the source of your gravity=temperature gradient. If not Jelbring, perhaps you are a follower of Landscheidt, then?
"you will find a further link to Steve Goddard's thread ... over 400 postings ... the vigorous discussion ... is just absurd."
Any credibility you've tried so valiantly to establish here, now gone poof. As far as the number of postings on one of $G's threads being an indicator of substance, value or thought: Really?
Here is what Dr. Roy Spencer posted on a similar thread in Watt$land:
But it’s when that volume is exposed to outside influences — like IR radiation from the solar-heated surface of the Earth passing through that volume — that a temperature change can occur as a result of adding more CO2 to the volume. -- emphasis added
Absurd is as absurd does. - 2nd law of thermodynamics contradicts greenhouse theory
damorbel at 20:24 PM on 26 November, 2010
Re #139 Albatross Yes a typo, -50C at 10km, more strength to my argument, it puts -60C to -80C between the the bottom and top of the troposphere, where then is this GHG warming effect coming from?
Your link to Rabbet is very informative, of high altitude GHG emissions (CO2 etc), he says:-
"Below that level, energy emitted by a greenhouse gas molecule is soon absorbed by another relatively nearby one. Thus the energy simply cannot be radiated to space to balance the incoming solar energy."
which satisfies all observations of molecular absorption and emission. But don't you notice that this kills off the 'back radiation' nonsense? There are plenty of gases, the so-called greenhouse gases, that emit and absorb radiation; Rabbet is acknowledging that adjacent GHG molecules will absorb GHG emitted photons.
To a non-climatologist this means that the thermal equilibrium of a gas is not disturbed by the phenomenon of molecular emission/absorption; a climatologist does not notice the absorption part of the phenomenon and claims that the emitted photons are not absorbed in the atmosphere but somehow, contrary to the 2nd law of thermodynamics, bunch together to form a radiative flux downwards to Earth's surface.
Thank you for the link. This phenomenon was explained by Einstein in his 1917 paper on emission and absorption, Rabbet is the first person I have come across who recognises this reality in popular literature.
Re #142 muoncounter, you also link to Rabbet and further to Jelbring on how heat is distributed in a gravitationally retained atmosphere.
In your link to Rabbet you will find a further link to Steve Goddard's thread on the matter of atmospheres, gravitation and temperatures, there are currently over 400 postings and they make interesting reading. Given the vigorous discussion, your claim that "Rabbett took it down" is just absurd.
Would you care to say what Rabbet wrote that convinced you? I am not interested who writes something, I need to know the argument used. Please tell me which part of Rabbet's post convinced you, I would like to check it out.
The same with Jelbring. - Real experts don't know everything
Daniel Bailey at 16:14 PM on 11 November, 2010
Re: Norman (37)
Um, you haven't been reading anything by Steve Goddard have you?
Full discussion of the Venus Syndrome here.
The Yooper - Skeptical Science Firefox Add-on: Send and receive climate info while you browse
Lazarus at 23:56 PM on 31 October, 2010
I'm having a problem submitting a report. If I select an argument it turns yellow just as it should but if I then select view report no argument is listed.
Also I can't select multiple arguments. If I select another one it goes yellow but the first deselects back to it's original colour.
Any Ideas if it is something I'm doing wrong, a problem with my setup or a problem with this plugin?
The site I'm trying to submit can be found here;
http://stevengoddard.wordpress.com/2010/10/30/the-pinocchio-syndrome/ - Do critics of the hockey stick realise what they're arguing for?
dana1981 at 06:56 AM on 21 October, 2010
Oh that precious Steve Goddard. After ranting about how John's graph shows more recent warming than the Hadley land+ocean data, he adds an update.
"Reader “robert” tells me that Cook is using land-only northern hemisphere data in his “northern hemisphere” graph."
No freaking duh. Past temperature reconstructions are based on land proxies (mainly in the Northern Hemisphere), and thus represent land-only NH temps. So that is the appropriate instrumental data to use.
As usual, Goddard spends an entire blog post criticizing somebody who's correct. What a joke. Goddard also claims that John "goes on and does climate sensitivity calculations based on bogus data from a cherry-picked hemisphere."
Aside from the data neither being bogus nor from a cherrypicked hemisphere (anyone even slightly familiar with temperature reconstructions should know they're usually done for the NH, from which more proxy data is available), John doesn't do any climate sensitivity calculations at all in this post.
It amazes me that somebody so completely ignorant about climate science could be so utterly oblivious as to write a climate science blog. - Do critics of the hockey stick realise what they're arguing for?
Lazarus at 06:35 AM on 21 October, 2010
I see you have rattled a cage over with Steve Goddard who is claiming your Moberg graph is 'a new level of BS';
http://stevengoddard.wordpress.com/2010/10/20/cooks-hokey-stick/ - DMI and GISS Arctic Temperatures: Hide the Increase?
MarkR at 20:49 PM on 17 October, 2010
Very interesting Peter!
I haven't had the time to look into this myself, but once again our friend Steven Goddard has shown a severe lack of skeptical thinking and maintained his unbelievable ability to cherry pick. - Climate Cherry Pickers: Falling sea levels in 2010
Berényi Péter at 23:49 PM on 14 October, 2010
#107 kdkd at 12:02 PM on 11 October, 2010
there don't seem to be claims about accelerating sea level rise
Of course there is one in this very thread. It is based on a post from the same author.
"In point of fact, observed sea level rise is already above IPCC projections and strongly hints at acceleration"
Or here is another one, this time from Peter Hogarth.
"there is a significant weight of evidence of a recent acceleration in rate of sea level rise [...] The weight of peer-reviewed evidence for this acceleration in sea level rise is robust"
The meme at this site must have been started by John Cook himself, with an even stronger claim.
"So a broader view of the historical record reveals that sea level is not just rising. The rate of sea level rise has been increasing since the late 19th century"
Here is a fairly recent one.
"Sea-level rise is accelerating faster than the IPCC predicted"
These claims are not supported by evidence, still, they keep popping up, undebunked.
They are usually connected to alarming projections of even more acceleration in the future (yes, projections, whatever that's supposed to mean, never predictions), based on the alleged accelerating ice loss over Greenland. That acceleration is computed using eight years of GRACE data. Now that's cherry picking. But I can't see it'd meet much opposition here.

As for the "scientific approach", University of Colorado at Boulder sea level data are next to useless. They lack error bars completely and the sampling interval is 9.9156 days (several samples missing). It is about one third of a synodic month, but not quite. The difference is 6230 sec (1 h 43' 50''). As the signal itself must contain strong components at multiples of lunar cycle frequency, it looks like an odd choice. The gradual phase shift makes up a full lunar cycle in about 11 years, so on timescales significantly shorter than that it can introduce false trends.
This is why Steve Goddard's four month sea level trend does not make sense, not because it is "cherry picking" (it is not, it's just some recent data).
It is actually a bit worse than that. He shows data with no inverted barometer correction. If correction is applied, there is no trend whatsoever. Of course in the long run barometric correction should not change the trend at all, because mass of atmosphere is given and there are limits to how uneven its distribution can get before strong winds restore uniformity. But this time span is not sufficiently long.
Otherwise there is nothing wrong with the idea that the ocean itself can be used as a global thermometer to check ocean temperature and heat content measurements. This is what Trenberth is trying to do, with not much success so far.
The main problems with this ocean thermometer idea is that as we have seen it is not reliable in the short term (neither its long term precision is good enough) and volumetric thermal expansion coefficient of seawater is highly dependent on both temperature and pressure while ocean mass also keeps changing. - Arctic icemelt is a natural cycle
muoncounter at 00:50 AM on 12 October, 2010
The Prince of Cherries is at it again.
the ice itself is about to set a record high for the date in the DMI database (emphasis added).
BTW, that database includes the years 2005-2010. We are about to set a record high for a specific date in a statistically insignificant 6 year period. Huzzah!
With just 3 more years, we draw a different conclusion:

Note that the annual rebound of new ice is always steeper than the melt. And yes, even with globally increasing temperatures, there will still be winter in the Arctic. - Climate Cherry Pickers: Falling sea levels in 2010
philipm at 18:22 PM on 10 October, 2010
I'm surprised he used 12 data points when 2 would have been just as authoritative. Steve Goddard obviously has no pride; this is by no means his first foray into obviously bogus pseudo science. - The value of coherence in science
Ned at 02:01 AM on 8 October, 2010
Earlier in this thread I wrote: I think there are no shortage of cases where people make incoherent arguments in support of mainstream climate science. (If people doubt this, I can go into detail in another comment).
In case anyone doubts this, let me point to the issue of Arctic sea ice. Having just spent the summer "watching the ice melt" on a variety of blogs on both "sides" I must ruefully say that nobody has a monopoly on incoherence.
Overall, at the end of the season the result was basically exactly what would be predicted from the trend over the past few decades. But the unpredictable fits and starts along the way led many commenters on each side to engage in rather incoherent and self-deceptive arguments. When the ice was doing what Blogger X wanted it to be doing, the decline (or lack of decline) was real. When it wasn't cooperating, this was due to the winds, compaction/dispersion, the Beaufort Gyre, errors in the satellite analysis, or whatever. People would focus on ice extent one month, ice area the next month. The energy put into it all was impressive, even if the arguments were not especially consistent over time.
Obviously, there was plenty of incoherence on both "sides", but the ice goes ahead and does what it does regardless. The fact that Steve Goddard is routinely incoherent and illogical would not actually prevent the ice from "recovering", and the fact that Neven's commenters are often opportunistic in their interpretation of events would not somehow mean that the ice would have to refuse to decline as predicted.
So by all means, let's try to be reasonably coherent in our arguments. But there is plenty of incoherence on both sides, and more importantly the fact that one's rhetorical opponents seem incoherent doesn't mean that your side will be proven right!
-------------------
[No, I'm not trying to draw a false equivalence between Goddard/WUWT and the commenters on Neven's sea ice blog. In spite of the way that discussions on the latter often seemed to involve "special pleading", there was still a huge amount of value in that blog, and I look forward to reading it next summer. The same cannot be said of SG/WUWT.] - Climate Cherry Pickers: Falling sea levels in 2010
Anne van der Bom at 19:10 PM on 6 October, 2010
I just can't resist to comment.
My favourite Steve 'Pixelcounter' Goddard piece is his declaring Hansen's Antarctic ice predictions a failure based on recent trends. On closer examination the Hansen prediction in question appears to be for equilibrium at 2x CO2, i.o.w. somewhere around 2070. We're now in 2010.
The completely uncritical reception of this story at WUWT is jaw dropping and very revealing. - Climate Change: The 40 Year Delay Between Cause and Effect
wingding at 11:34 AM on 4 October, 2010
This article is extremely poorly worded. The title says there is a 40 year delay between cause and effect, which makes it sound like the warming effect of co2 doesn't *start* until 40 years after co2 starts rising. Obviously that's wrong. But throughout the article this impression is given. Eg:
"The reason the planet takes several decades to respond to increased CO2 is the thermal inertia of the oceans."
The planet doesn't respond *at all* to rising co2 until several decades after? Of course it does.
And:
"With 40 years between cause and effect, it means that average temperatures of the last decade are a result of what we were thoughtlessly putting into the air in the 1960’s"
And the 1970s and the 1980s and the 1990s. Not just the 1960s.
Obviously what you mean is that there is a 40 year delay between cause and *maximum* effect.
I only say this because I feel strongly that the way the article is worded, only people who understand this already are going to get it. People who are new to this or are not but are easily confused (*cough* Steve Goddard *cough*), will get (or have already got) the wrong idea. - Climate Cherry Pickers: Falling sea levels in 2010
Doug Bostrom at 07:45 AM on 4 October, 2010
Goddard has no shame, apparently. Against my better judgment but driven by curiosity stimulated by this thread, I mooched over to his blog and within a moment found him likening teachers to pedophiles. - Climate Cherry Pickers: Falling sea levels in 2010
muoncounter at 00:13 AM on 4 October, 2010
#5" "His sample consists of only twelve data points (apparently not grasping that his data set only amounts to less than one third of calendar one year"
Ah, but with such a sample, the graph above and a ruler, one can see the new trend: sea level is falling by 30 mm/yr! Clearly, Goddard must now be considered an alarmist!
An yet, he goes on to throw a stone at our own John Cook, observing
Current sea level rise rates are much lower than the average for the last 15,000 years. Current trends are more than an order of magnitude lower than Hansen’s forecast.
In the-world-according-to-Goddard, trends can simultaneously be both smaller and larger. - 2010 Climate Change Resource Roundup
Doug Bostrom at 03:14 AM on 29 September, 2010
Skeptical Science is "...not 'peer-reviewed science'?
I suppose one could say that Steven Goddard is reviewed by his peers. Still, that remark sort of stands out as unselfconscious. - The contradictory nature of global warming skepticism
Doug Bostrom at 01:29 AM on 26 September, 2010
Baz, when a site such as WUWT includes work such as Steven Goddard's pieces along with other content, how are readers to feel confident they're learning anything trustworthy if they do not already know enough of a given topic to distinguish between fact and fiction? What is the point of reading articles there?
For instance, let's say that I'm intrigued by a story on Arizona's big meteor crater presented at WUWT but I don't already know much about Arizona's big meteor crater, not enough to distinguish truth from fiction. Let's suppose I do know enough about climate to know that Steven Goddard's depictions of climate science are generally unreliable, in many instances are downright incorrect, that this has been shown to be the case many times, yet WUWT continued to publish Goddard's work, refused to help readers by making corrections. Knowing how WUWT lends a patina of authority to unreliable work, why would I want to read about meteor craters on WUWT? How would I know I'm not being told something wrong? Why would I want to waste my time doing fact checking on my own, or trying to tease out the truth by following a thread of dozens or hundreds of comments?
Once a track record of including Steven Goddard-level material has been established, once we -know- there's fiction styling itself as fact infecting the content of a site, for any topic with which we have little familiarity how do we know whether or not we're not only wasting our time but having our minds filled with errors? There's no way of telling short of reading about the topic somewhere else, meaning the site is essentially useless as a fundamental learning tool.
How can such a site be termed "very good?"
It's not a matter of any single or occasional mistake condemning the reputation of a publication; the very best publications sometimes must issue retractions or correctons. In the case of WUWT we see an extended history of publishing what is clearly incorrect and-- worse-- a general refusal to acknowledge error once it's been identified. In the matter of climate, WUWT has refused to help its readers understand the topic, to the contrary appears to have frequently actively promoted misinformation. That's not "very good," that's very bad. - The contradictory nature of global warming skepticism
Albatross at 16:46 PM on 12 September, 2010
Steven Mosher @67,
"Most people do not understand how content gets staged for WUWT, how it gets approved and what the editorial criteria are."
Well, going by Steven Goddard's posts the editorial criteria are not at all high at WUWT. Are you permitted to share what the "editorial criteria" are? I like you use of the word "staged"...very revealing ;)
There are contradictions at WUWT Steven, and you are probably going to regret standing by Anthony on that, because anyone here can go to the website and identify the myriad of contradictions there. You gave one example. Here is another. Anthony is only too happy to highlight regional cold snaps, but when it comes to warming, the surface data are allegedly corrupted and can allegedly not be trusted. So in Anthony's world the station data are good enough for him to highlight cold snaps (gotta keep people thinking that the planet is not warming), but not not good for anything else. And not to mention that the long-term trends in global temperatures (not regional) derived from the RSS MSU and Radiosonde (RATPAC)data are in very good agreement with the various SAT datasets.
You also say that he accepts the theory of the radiative forcing of GHGs, then why does he have posts on his site which are effectively challenging that theory (e.g., Goddard's posts on Venus)?
In a warming planet it is expected that the Arctic sea ice (and land ice) will reduce in extent. That is in fact what we are observing, but Anthony goes to great lengths to assure/convince readers that the Arctic sea ice is doing just fine. That is a contradiction in logic.
Anthony claims to have a "science" blog. Well having posts by the likes of Monckton, Goddard, Smith and D'Aleo and others is contrary to what one would expect on a science blog. So yet another contradiction.
We are going to double CO2, so going by what you said concerning his understanding of the climate science, Anthony should then accept that we can expect at least 1 C of warming associated with doubling CO2, and consequently the long-term trends in global SATs should be positive as the radiative forcing from elevated GHGs continues to slowly increase. Yet, he spends an awful lot of time and effort on invoking a myriad of reasons as to why that should not happen and to show why the planet is not warming [including cherry-picking short-term windows to avoid obtaining statistically significant warming (thanks to Lindzen)]. That is a huge contradiction right there.
I challenge people reading this to go to WUWT and highlight for you Steve ALL the contradictions (and logical fallacies) that have been made in recent years at WUWT. It will require lot of work and but I hope that people are up to the task.
While they are at it they can also document the misinformation and distortion of the scientific literature and misinformation made by guest posters.
As for the science being settled, well that is a whole different story. What does that mean, and to what aspects of climate science does it apply? Some things are settled, others are close and others are not (e.g., clouds and aerosols). The radiative forcing of GHGs and the greenhouse effect are settled, although many of Anthony's readers have a hard time even accepting the theory of the greenhouse effect. The fact that humans are increasing GHGs is settled (isotopes and all that). Milankovitch cycles...settled, it is not referred to as a theory for nothing. IMHO, the only really important issue left up for debate is climate sensitivity (transient and long term, very important to distinguish between the two), and even there a huge number of independent studies converge over a fairly narrow range.
Also, you here have acknowledged that Anthony "plays up" other factors/drivers-- what you did not say is that their role in modulating global temperatures are well understood and have been quantified and which have been shown to be either be of only short-term importance and/or have a minimal impact globally.
Anyhow, I'm sure that you feel obliged to defend Anthony and Charles, but maybe it is time for the sake of your own reputation, to distance yourself from the folks at WUWT.
More than 100 comments found. Only the most recent 100 have been displayed.
More than 100 comments found. Only the most recent 100 have been displayed.


THE ESCALATOR

(free to republish)