


 Arguments
Software
Resources
Comments
The Consensus Project
Translations
About
Support
Arguments
Software
Resources
Comments
The Consensus Project
Translations
About
Support
![]()
![]()
![]()
![]()
![]()
![]()
![]()
![]()
![]()
![]()


![]()


Latest Posts
- EGU2024 - An intense week of joining sessions virtually
- Skeptical Science New Research for Week #16 2024
- How extreme was the Earth's temperature in 2023
- At a glance - Is the science settled?
- What is Mexico doing about climate change?
- 2024 SkS Weekly Climate Change & Global Warming News Roundup #15
- Fact Brief - Did global warming stop in 1998?
- Skeptical Science New Research for Week #15 2024
- EGU2024 - Picking and chosing sessions to attend virtually
- At a glance - The Pacific Decadal Oscillation (PDO) is not causing global warming
- Climate Adam: Is Global Warming Speeding Up?
- 2024 SkS Weekly Climate Change & Global Warming News Roundup #14
- Gigafact and Skeptical Science collaborate to create fact briefs
- Skeptical Science New Research for Week #14 2024
- How can I make my retirement plan climate-friendly?
- At a glance - Global warming and the El Niño Southern Oscillation
- A data scientist’s case for ‘cautious optimism’ about climate change
- 2024 SkS Weekly Climate Change & Global Warming News Roundup #13
- Skeptical Science New Research for Week #13 2024
- You can start applying for the American Climate Corps next month
- At a glance - Human fingerprints on climate change rule out natural cycles
- Want clean electricity? These are the overlooked elected officials who get to decide.
- 2024 SkS Weekly Climate Change & Global Warming News Roundup #12
- Climate - the Movie: a hot mess of (c)old myths!
- Skeptical Science New Research for Week #12 2024
- Climate Adam: Could the Amazon Rainforest Collapse?
- At a glance - Does CO2 always correlate with temperature?
- The U.S. has never produced more energy than it does today
- 2024 SkS Weekly Climate Change & Global Warming News Roundup #11
- Skeptical Science New Research for Week #11 2024
Comment Search Results
Search for cycles
Comments matching the search cycles:
- Welcome to Skeptical Science
Bob Loblaw at 01:07 AM on 5 April, 2024cookclimate @ 118:
I have looked at the paper in the volume I linked to in comment 121. There are definite changes compared to an earlier version I found that said "submitted to Earth and Space Science", so I presume that you've had some sort of review and modified the paper since the earlier drafts.
It looks like you have identified the 1470-year cycle using your eyecrometer. I see nothing in the paper that actually does any sort of signal processing to identify cycles using any objective statistical technique. You are seeing a cycle because you want to see a cycle.
Your speculation includes arguments that include all sorts of stuff that has been debunked many times before. Pages are available on Skeptical Science that cover thee topics:
- Geothermal heat flux is included in this post.
- The "CO2 lags temperature" argument is discussed here.
- Most of your examples use regional, not global, temperature proxies. Regional temperatures are far more variable than global ones, and it is invalid to compare the two directly. This is discussed in this SkS post.
- You're convinced that an increase in volcanoes are adding to warming. That is the opposite of the argument commonly made by "skeptics" that increasing volcanic activity caused the Little Ice Age, so a subsequent decrease is causing warming (discussed here). In any event, just counting the number of volcanoes (your figure 3) is extremely simplistic. Arguing that more volcanoes implies more geothermal heat is a non-starter, as discussed in the post linked above.
- Your "computer models are unreliable" is an old, tired argument, scoring position 6 on the SkS Most Used Climate Myths. The rebuttal is here.
So, your paper is really nothing more than an "I see it" 1470-year cycle mixed with a rehash and Gish Gallop through a variety of common "skeptic" myths. I could probably find more, but it isn't worth the time.
I hope you didn't pay too much money to get it published.
- Welcome to Skeptical Science
Bob Loblaw at 11:22 AM on 4 April, 2024Cookclimate @ 118:
Your paper link seems to be broken.
Google Scholar finds multiple links to papers by you with that title, but it's hard to tell if they are all the same paper. Most links seem to be pre-prints, not actual peer-reviewed publications. One of them states that it was submitted to Earth and Space Science in 2020. Another seems to indicate that it was published in late 2023, in Journal of Marine Science Research and Oceanography, which is a title published by Opast. That journal's web page seems to use a DOI: 10.33140/JMSRO prefix, but searching for "Eugene Cook" fails to find the paper.
Opast is listed on Beall's List as a predatory publisher. As such, it appears to have little or no proper review. Can you tell us anything about the efforts you have made to publish your work, and what any reviewers have told you (if there have been any)?
So, by all appearances, you have pointed us to a "paper" that has not been peer reviewed. Perhaps between 2020 and 2023 you had the paper rejected by other journals? And finally managed to "publish" it in a pay-to-play journal?
Anyway, your 1470-year cycle looks awfully close to previous efforts that have identified 1500-year cycles. Skeptical Science has a page that covers this:
https://skepticalscience.com/1500-year-natural-cycle.htm
I'd hate to waste time looking at a pre-print that may have been changed before publication, so if you can properly point us to the correct copy of the paper, that would help.
...and please post anything else on the correct page, linked above. And read that post, and give us some reason why you think that your magical 1470-year cycle is any different from the many other cycles that people have failed with.
Eclectic is most likely correct: your analysis probably has some serious errors.
- Climate - the Movie: a hot mess of (c)old myths!
nigelj at 04:41 AM on 2 April, 2024Two Dog @55
"You make the same point I am searching for - namely that "blips" in the temperature record can be driven by natural factors. What puzzles me is others on this thread, whilst they recognize these natural impacts, appear confident that the natural factors that we are aware of are "temporal and not significant" (my words) when pitted against the powerful impact of human GHG emissions"
Nobody has claimed natural factors are all 'insignificant' forcings. Only that the natural cycles are in a cooling or flat phase in recent decades so cannot explain the recent warming trend. However the solar cycle is not a particularly powerful factor, and if it was in a warming phase it would struggle to explain more than a small amount of the recent warming. Refer to the climate myth "It's the sun" on the left hand side of this page.
"They rely on climate scientists for this - a group who are highly unlikely to admit the strength and frequency of natural factors is unpredicatble and hard to measure."
Incorrect. Climate scientists freely admit that the frequency of natural factors can be unpredictable to an extent. I provided you with data on the solar cycle, ENSO, and The PDO oscillation which depicts the degree of regularity of these cycles. You can see there is a repeating cycle bit its not perfectly regular.This data is prepared by climate scientists.
In addition whether they are not precisely predictable doesnt stop us detecting how they are affecting temperatures at any given time.
Climate scientists are quite open about accuracy of data. If you dig into the details the data has error bars. However the data has generally good accuracy. Solar irradiance in particular is meaured by satellite sensors with reasonable accuracy, and the Sorce network used since 2003 is highly accurate:
www.ngdc.noaa.gov/stp/solar/solarirrad.html
ENSO index is not that hard to measure with decent accuracy:
www.ncei.noaa.gov/access/monitoring/enso/technical-discussion
"I think this is where the climate scientists tend to differ from the physicists and geologists, whose very existance does not require them to claim knowledge of all factors that impact the climate."
Incorrect. Most climate scientists are in fact physicists, geologists, chemistry graduates etc. There is a degree in climatology, but its very recent and not many climate scientists have that degree. It typically has modules in physics and geology anyway. I suggest google it for your local university.
- Climate - the Movie: a hot mess of (c)old myths!
Bob Loblaw at 23:38 PM on 1 April, 2024diff01 @ 51,52:
If you want to apply a "modicum of reasoned thought", the answers to your questions are available if you look. Given your use of labels such as "true believers" and "sham", I doubt that your mind is open to any reasoned discussion, but here are a few pointers. Basically, your short post is kind of like the movie: a hot mess of (c)old myths.
Skeptical Science posts that are already linked in the OP:
Additional Skeptical Science posts:
I hope that if you come back with "a myriad of other questions", that you will have given them more than "a modicum of reasoned thought". So far, what you have said here suggests that your level of thought is at the "trifling" end of "modicum" (per Wictionary). Scientists, on the other had have given these issues a lot of thought.
Noun
modicum (plural modicums or (rare) modica)
A modest, small, or trifling amount.
- Climate - the Movie: a hot mess of (c)old myths!
John Mason at 20:35 PM on 1 April, 2024Re - #51 diff01:
I'll break this up into Q&A because there's a range of questions:
Q. Will changing one small ingredient (0.04%) of the earth's greenhouse gases (CO2) arrest gloabal warming (if that is what is happening)?
A. CO2 has increased 50% since pre-industrial times. Can you imagine if sunshine became 50% stronger?
Q. If the scientists(?) believe this to be the case, how will it be regulated to adjust the climate to maintain an average that is not too hot or cold?
A. We have yet to see!
Q. If all anti-carbon emitting policies were implemented, what says the climate will not be too cool?
A. Already locked into further warming for centuries.
Q. How will the climate be regulated (say changing one greenhouse gas does the trick) if the sun's intensity changes (sun spots), the reduction in carbon emission works, and it cools too much?
A. Changes in total solar irradience across a sunspot cycle are very low, but not neglibible.
Q. Another question I have is about other factor's, such as the recent eruption at Hunga Tonga. Apparently water vapor increased by 10% in the stratosphere. Won't that affect the climate?
A. It may be accoutable for a few tenths of a degree of recent warming, but research continues.
Q. What about the earth's orbit, and it's distance from the sun?
A. You are referring to Milankovitch cycles that affect three orbital parameters. However they do so over tens of thousands of years, not in a couple of centuries.
- Climate - the Movie: a hot mess of (c)old myths!
nigelj at 04:48 AM on 1 April, 2024Two Dog @41
"Finally, on the "cherry picking" of the 50s, 60s and 70s. I think its a fair point to pick 30 years out of 150 in this case. Indeed, the argument above is, as I understand it, that the main and dominant factor in the current warming is human GHG emissions. For that theory to hold, in any period where GHG emissions are increasing year on year, then only a few years "blip" in warming must presumably call the theory into question? (unless we can find another new and temporary factor like air pollution)"
The reason the temperature record has "blips" and is not a smooth line is because the trend is shaped by a combination of natural and human factors that have different effects. However the overall trend since the 1970s is warming. The known natural cycles and infuences can explain the short term blips of a couple of years or so, (eg el ninos) but not the 50 year overall warming trend since the 1970s. Sure there may be some undiscovered natural cycle that expalins the warming, but its very unlikely with chances of something like one in a million. And it would require falsifying the greenhouse effect which nobody has been able to do. Want to gamble the planets future on all that?
The flat period of temperatures around 1940- 1977, (or as OPOF points out it was really a period of reduced warming) coincides with the cooling effect of industrial aerosols during the period as CB points out. This is the period when acid rain emerged as a problem until these aerosols were filtered out in the 1980s.
However the flat period mid last century also coincided with a cool phase of the PDO cycle (an ocean cycle), a preponderance of weak el ninos, and flat solar activity after 1950 and a higher than normal level of volcanic activity. Literally all the natural factors were in a flat or cooling phase. In addition atmospheric concentrations of CO2 were not as high as presently, so it was easier for the other factors to suppress anthropogenic warming.
So for me this is all an adequate explanation of why temperatures were subdued in the middle of last century. Just my two cents worth. Not a scientist but I've followed the issues for years.
- Climate - the Movie: a hot mess of (c)old myths!
Charlie_Brown at 02:15 AM on 30 March, 2024Two Dog @32
The reason for a plateau in the temperature data in the 50’s, 60’s, and 70’s (the 40’s were relatively hot, so a setup for part of the reason for a plateau) was large increases in air pollution, primarily sulfates, that reduced solar radiation incident on the Earth’s surface. SO2 control systems were installed to prevent acid rain and that cleaned up the sulfates. Don’t be fooled by data cherry-picked for the short term to mislead about the global warming over the longer term of 150 years.
We know that current warming is not, not even in part, caused by the same historical factors observed in the temperature record because none of those historical factors are supported by the evidence. E.g., it is not the Milankovitch orbital cycles around the sun that caused ice ages in the past. Meanwhile, man-made increases in GHG concentrations have never happened before in the history of the planet. The mechanism of warming from increasing GHG is well understood and well supported by evidence. - CO2 lags temperature
Charlie_Brown at 09:26 AM on 16 March, 2024RBurr @ 654
1) CO2 lags temperature rise at the end of an ice age because CO2 evolves from ocean waters as the temperature rises. This is Henry’s Law. In that case, temperature rises first due to the Milankovitch Cycles. Note that ice age temperatures cool slowly and warm rapidly. Modern CO2 emissions are different because they come from burning fossil fuels. Therefore, temperature rises as a result of CO2. Cause and effect in both cases is clear in both cases, and different in both cases.
2) The quantum mechanical mechanism on IR radiation that explains the greenhouse warming theory has been proven. It is based on fundamental principles of energy balance and radiant energy transfer and has been verified by massive amounts of data, cross-checks, and validation.
3) The Earth’s energy “balance” is fundamental:
Input = Output + Accumulation
Output is reduced as greenhouse gases increase. Thus, energy accumulates.
4) Your description of quantum mechanics does not make sense. Quantum mechanics is fundamental to the specific frequencies (i.e., wavelengths) that are absorbed and emitted by CO2, CH4, and H2O. There is a huge amount of energy carried by IR radiation. It is naturally emitted (not dissipated) and lost to outer space by IR. By the overall global energy balance at steady state:
Input solar = Reflected solar + Emitted IR
Accumulation is zero at steady state, as before CO2 emissions of the industrial revolution.
5) The hot object in this case is the sun at about 5800 Kelvin. That is more than hot enough to warm the earth. The temperature profile is 5800 K of the sun to 288 K (60F) of the Earth 217 K of the lower stratosphere to 2 K of outer space. Increasing CO2 reduces the energy loss to space at specific wavelengths (e.g., approx. 13-17 microns). The absorptance/emittance lines in that range increase, meaning that energy is emitted from a cold 217 K instead of a warm 288 K. This upsets the energy balance. The balance is restored by accumulating energy until the surface temperature increases enough to make up the reduction by CO2. Nothing about this violates either the 1st or 2nd law of thermodynamics. Some mistake the 2nd law by describing the energy balance being at steady state, but the steady state was upset by increasing GHG.
6) Neither the Milankovitch Cycles nor the Schwabe Cycles (sunspots) explain the cause of modern global warming. The long-term Milankovitch Cycles have not been in a period of significant change for the last 12,000 years after warming from the last ice age. Measured radiosity data from the sun show that short-term Schwabe Cycles have not changed significantly either and do not explain modern warming.
- CO2 lags temperature
RBurr at 08:51 AM on 15 March, 2024The analogy was cute, that the observation that CO2 rises lag temperature rises, means that the Temp rise causes the CO2 rise, is a bit like saying that chickens do not lay eggs because they have been observed to hatch from them. I would submit that, by the same token, opining that CO2 increases cause global warming is a bit like saying that chickens to not hatch from eggs, because they they’ve been observed to lay them.
This all suggests (as inferred) a co-dependent process.
However, this overlooks the same thing that MOST public blogs overlook, and that is the quantum mechanical mechanism on IR radiation (per greenhouse warming theory) has never been proven, and is actually false. New research indicates the fundamental error in the theory, presumes that Heat is ADDITIVE (eg. The Earth’s energy ‘budget’). The quantum process for Thermal transference is not additive. It is a function of frequency resonance. This is why microwave ovens work. Solar heating occurs because the spectrum of frequencies included in sunlight (which reaches the Earth’s surface) sets the maximum temperature which the recipient object may reach. An object in an oven set to 400 degrees will never reach 500 degrees no longer how long it is in the oven, because heat transference is not additive over time. The low energy IR waves received by CO2 molecules will naturally dissipate into the atmosphere with negligible net effect upon the atmosphere, but will never cause planetary ‘heating’ because, per thermodynamic law, no object can heat something beyond the temperature it possesses. Irradiated CO2 molecules can never heat the earth beyond the temperature frequency that already exists within the earth, which generated the IR light waves to begin with. IR Radiation does not raise the temperature of the Earth. The greenhouse warming theory is flawed. THAT is why the universally accepted historical record shows zero correlation between atmospheric CO2 levels and average temperature over the entirety of the past 4 Billion years. Zeroing in on the last 400k or 800k years, and pointing to an anomaly amounts to cherry picking, which disregards the other dynamics in play, such as Milankovitch Cycles. Note: Ozone depletion CAN increase surface temperatures because the range of UV frequencies that reach the surface is expanded. - I drove 6,000 miles in an EV. Here’s what I learned
nigelj at 05:01 AM on 28 December, 2023Prove we are smart. I tried to watch the EV video, but I gave up after five minutes. The video was a nasty, patronising, empty, hate filled rant against EV's and people who drive them, full of swearing and taking ages to get to anything useful. Not going to tolerate that and waste my time. I already know the downsides of EVs, and I doubt some motor repair mechanic will add anything.
Since you are so keen to "prove you are smart" what do you think we should do when we run out of oil? The point is electric cars in some form seem pretty much inevitable. The other alternative is running cars on artificially created electrofuels, but I don't find that very persuasive when you research that issue.
Or do you think we should all give up on cars and ride bicycles? Is that a realistic solution?
There is a group of people on the hard left of politics and academia who dislike EVs (and sometimes wind and solar power) because they are the product of the capitalist society and industrial society and because rich people drive them and profit from their manufacture. You see this in internet discussions sometimes.
While unrestrained greed and laissez faire capitalism is not my thing, their reasoning seems shallow and emotive. It is a fallacy of perfectionism - where a perfect, implausible socio- economic utopia is prioritised, and more realistic attainable compromise solutions are discarded.
- At a glance - Evidence for global warming
John Mason at 15:12 PM on 5 December, 2023@Paul #32:
"As it turns out we are now in the midst of a definitely emerging El Nino. The ENSO cycles can transiently override the gradual warming of AGW, so this is a factor to point out. "
I think most readers on here are well aware that the EN phase of ENSO overdubs the AGW signal on a temporary basis!
- At a glance - Evidence for global warming
Paul Pukite at 03:01 AM on 5 December, 2023Because the present post is mentioning ENSO
"Sea-surface temperature patterns in the tropical Pacific were characteristic of La Niña, a phenomenon that should have mitigated against atmospheric heat gain at the global scale. However, the annual global surface temperature across land and oceans was among the six highest in records dating as far back as the mid-1800s. 2022 was the warmest La Niña year on record.
At the time of writing, there is still about a month of 2023 to run. Yet once again we have record-breaking temperatures, with some records smashed by huge margins, so that 2023 looks as though it may well go down as the hottest on record."
As it turns out we are now in the midst of a definitely emerging El Nino. The ENSO cycles can transiently override the gradual warming of AGW, so this is a factor to point out.
concerning
https://skepticalscience.com/el-nino-southern-oscillation.htm
There was a long-running discussion on ENSO at the Azimuth Project forum started in 2014 that recently ended. The original motivation was to collaborate and analyze ENSO data and consider different math approaches to modeling the cycles, as the organizers of the project were skeptical as to a chaotic or random origin for ENSO. Alas, the owner of the site shut it down and wiped out the entire archive. Fortunately, some of the open source code for the effort was kept on a GitHub repo and I was able to grab ownership and keep that alive, so a remnant discussion is available for those that have GitHub accounts. https://github.com/azimuth-project
- At a glance - Evidence for global warming
One Planet Only Forever at 13:41 PM on 2 December, 2023Paul Pukite @13,
Your latest comment does not address the questions I raised regarding your initial comment and the ways you have commented regarding this point.
@2 You said “...Not the middle of the equatorial Pacific. The temperature variation there is also not well understood because El Nino & La Nina cycles dominate and these are difficult to predict more than a year in advance.”
I am open to learning (even though I still struggle with right vs left hand). Years ago I learned that the difficulty in ‘predicting the ENSO’ does not affect the ability to evaluate trends in the equatorial Pacific SST. Due to the trend of SST in the Niño 3.4 region (the middle of the equatorial Pacific) NOAA had revised their methodology for the Ocean Nino Index (ONI) values to be relative to a regularly updated baseline.
The following is from the NOAA webpage (linked here) that presents the ONI values identifying the “Cold & Warm Episodes by Season”.
“DESCRIPTION: Warm (red) and cold (blue) periods based on a threshold of +/- 0.5oC for the Oceanic Niño Index (ONI) [3 month running mean of ERSST.v5 SST anomalies in the Niño 3.4 region (5oN-5oS, 120o-170oW)], based on .”centered 30-year base periods updated every 5 years.”\
And the linked NOAA webpage for “centered 30-year base periods updated every 5 years” shows the annual temperature curves for each of the 30-year base periods. In that presentation there is an undeniable warming trend since 1950.
What you will notice is that the NOAA ONI and the related base periods start in 1950. This ties directly to the paper you made the unrepresentative quote from mistakenly believing that it supported your incorrect ‘declared belief’ about the middle of the equatorial Pacific.
In closing I will say that a statistical evaluation of the data points is the proper way to determine a trend in the data. However, when I look at the NINO3 graph you have chosen to share I see a warming trend for the portion from 1950 to 2010. That would be consistent with the more valid evaluation of the data done by the authors of the paper you misrepresented in your comment @2.
- At a glance - Evidence for global warming
Paul Pukite at 09:13 AM on 29 November, 2023"All these show a similar warming trend."
Not the middle of the equatorial Pacific. The temperature variation there is also not well understood because El Nino & La Nina cycles dominate and these are difficult to predict more than a year in advance.
"SST trends in the equatorial Pacific Ocean are especially controversial due to the discrepancy in the sign of the trend in the central and eastern Pacific among various SST datasets (Vecchi et al. 2008; Karnauskas et al. 2009; Deser et al. 2010a)"
https://link.springer.com/article/10.1007/s00382-012-1331-2#Sec5
- John F. Clauser: the latest climate science-denying physicist
Rob Honeycutt at 12:24 PM on 27 October, 2023TWFA... "...because the effects of cloud cover and weather is my primary area of interest I would appreciate links to that data."
Aside from your childish passage prior to this ask, there is a full body of research on cloud effects on climate. Perhaps you should endeavor to read the research instead of just assuming a preferred position.
One key clue that cloud effects aren't going to save us is merely the fact that, over the past million years we can see (through all kinds of paleo records) that the earth has gone through numerous glacial-interglacial cycles. We know the pacing and forcings that drive those cycles.
So, think about it. If cloud/weather effects were capable of offsetting changes in modern climate forcings, why would it not have done so over the past million years?
If what you're assuming were true, then we'd see no climate cycles because clouds/weather would always keep global temperature in equilibrium.
- From the eMail Bag: Carbon Isotopes, Part 2: The Delta Notation
Bob Loblaw at 23:20 PM on 17 October, 2023Rabelt:
Again, you are saying "I never said..", and avoiding the logical consequences of what you are saying.
The conversation has all the hallmarks of the following sequence:
A person says:
- A = 3
- B = 8
- C = A+B
Someone else says "So, you are claiming that C = 11?
And the first person says "I never said that C = 11. Stop putting words in my mouth."
You keep referring to "the main narrative". Unfortunately, what you have written here tells me that your idea of "the main narrative" is pretty much a strawman. I don't think you have any clue how the carbon cycle works, how different carbon isotopes fit into that cycle and why they would change over time.
Your comment at 23 illustrates this very well. You see a correlation over the period 1750-1860, and then expect to see the exact same response at later times. You seem incapable of realizing the following:
- There is no direct cause-effect between C13 ratios and atmospheric CO2 levels. They are part of the same large carbon cycle, but one does not cause the other, regardless of any fantasies you have about "the main narrative". As long as you ignore all the indirect connections (known as "the carbon cycle"), you will continue get everything wrong.
- The different time periods have different conditions, different fluxes, and different relative important of atmospheric inputs and sinks of carbon as a result, they would be expected to show slight differences in the patterns.
- Your overly-simplsitic "I see with my little eye..." analysis is telling us nothing about the global carbon cycle. Where you see inconsistencies you think can't be explained (because you won't look) and invalidate climate science, climate science sees the carbon cycle working as expected (because they have looked).
You are hitting two of the five main components of FLICC - the 5 technicques of science denial:
- Logical fallacies [your misunderstanding of "the main narrative" is just one]
- Impossible expectations [your overly-simplistic view of what you think should be happening, and your belief that this disproves something]
FYI, yes I have some authority with respect to carbon cycles, having been involved in analysis of forest carbon cycles and storage, and having my name on several publications related to that. You can read more about my background on the SkS Team page.
- From the eMail Bag: Carbon Isotopes, Part 2: The Delta Notation
Bob Loblaw at 10:41 AM on 17 October, 2023Frankly, Rabelt, you are not making any sense. You are throwing out vague assertions, and you are not providing any logical argument for those assertions.
Carbon cycles are not interpreted solely on the basis of correlations, which is essentially all that you have referred to.
You state "..that Delta C13 is a precise indicator of FF usage...", which clearly shows that you do not understand what C13 ratios tell us. As I explained, it is one small piece of the puzzle, and it is combined with additional information to draw conclusions. You seem to expect a perfect correlation - but if you understood why C13 ratios change (different sources and sinks over time), then you would realize how the specific C isotope characteristics of different sources can help us identify which sources are active.
I have provided additional links to places that will explain it to you, and all you can say is that you think part 1 is irrelevant. I see no evidence that you have understood anything in part 1, or any indication that you have bothered to read any of the other links I provided.
You also state "I have never said that because there was change before any other change is normal/justified in nature", but that is essentially the logical consequence of what you say. Read Michael Sweet's comment at 10. You are assuming that behaviour patterns of C13 ratios and CO2 concentrations prior to 1800 must follow the same variations that occur once fossil fuel sources are added to the mix. Any argument that you make includes the logical consequences of what you state, whether you state it explicitly or not.
You finish with "I said Delta changes previous to human emissions following co2 concentration not FF emissions as there were none, and the ones that existed were accountable for insignificant amounts of co2." The way you have worded this suggests that you think that either CO2 concentration changes cause C13 changes ("delta changes ... following CO2 concentration"), or that C13 changes cause CO2 concentration changes ("delta ... accountable for ... CO2"). This is not even wrong. Both CO2 changes and C13 ratios are the result of other factors in the global carbon cycle. As long as you persist in ignoring the carbon cycle overall, you will be doomed to drawing erroneous conclusions.
- Climate Confusion
Bob Loblaw at 06:16 AM on 2 September, 2023Markp @ 27:
Bluntly, when you dismiss information you don't like with statements such as this one:
I've spoken to established research scientists who laugh off the climate modelers who so cheerfully say "temperatures will just stop rising" if net zero is achieved. These are people I trust. They've had long careers doing real science, not short ones playing with computers.
...then it is hard to take you seriously.
If you want me to actually believe that such "established research scientists" exist, then you will have to point to a credible source of the statements they make and their arguments against the "established research scientists" that have studied and modelled carbon cycles for many years.
And I'll see your "working in climate science for a couple of years now" and raise you "studying and working in climate science for 45 years now". Only five of those years were spent dealing with forest carbon cycles and their relationships with climate, though. And I've only been "playing with computers" for 45 years, too.
- Ice age predicted in the 70s
Bob Loblaw at 22:57 PM on 17 August, 2023Frankly, Don, you are now reaching the point where you are just spouting bull$#!^.
I challenged you in comment #113 to provide two things:
- State clearly what you think the "both sides" are.
- State clearly who you think was a well-known climate scientist that was on "both sides".
You have not done this. You have just engaged in a game of "Look! Squirrel!" to jump to some other rhetorical talking point. You are playing games of "maybe this, maybe that" with no actual demonstration of understanding the physics of climate and what is likely or even reasonable possible. You have done selective quoting, and taking those quotes out of context, in order to try to show some grand disagreement or lack of understanding that does not exist.
The "abrupt about-face/reversal of opinion" that you are hanging your hat on is only "abrupt" if you refuse to look at the actual history of climate science and refuse to learn about the well-understood physics that explains the different observed trends and supports our understanding/interpretation. There is a term for that sort of refusal to look at the information available.
As Rob Honeycutt explains in #122, there has been no "reversal" in our understanding of orbital mechanics and long-term trends related to glacial/interglacial cycles. There has been no "reversal" in our understanding that CO2 is a greenhouse gas, and that greenhouse gases have a significant effect on global temperatures. There has been no "reversal" in our understanding that atmospheric aerosols (dust, soot, etc.) cause reductions in global surface temperatures.
What has changed is which of these factors is playing a dominant role in current temperature trends. CO2 is "winning", and it is winning rapidly.
You will probably come back with some sort of quip about "Oreskes said this". Well, the anti-evolution crowd is fond of claiming that Darwin said that evolution could not produce the eye. No, he didn't, and you are using the same rhetorical ploy in quoting Oreskes out of context.
You have now switched to shouting "hiatus!" from the treetops. Guess what? Climate science is interested in what factors affect these short-term variations in global temperatures. So, they study them in greater and greater detail (because instrumentation improves) each time they happen. And they happen on fairly regular intervals. So regular that you can track them by how often the contrarians need to update their "no warming since..." myths. Pretty soon, we're going to have to start to rebut "no warming since 2023", since 1998 2016 won't work any more:

We even have a term for these "hiatus" events: we call it The Escalator. The graphic is in the right-hand margin of every SkS page, but here it is in full glory:

You keep saying "isn't this interesting?". No it is not interesting, it is tiresome. This site exists because some people refuse to learn the science and understand it. The "hiatus" was yet another temporary pause in one metric of global climate, and does nothing to reverse our expectations of future warming as CO2 continues to increase.
Your continued use of ":)" at the end of your comments suggests that you are now just trolling. (Gee. Isn't speculation without evidence just so much fun?)
- There is no consensus
Eclectic at 17:56 PM on 15 August, 2023Rkrolph @948 , as far as I have seen, Dr Curry has not changed her expressed views in recent years (she has retired academically, but AFAIK still maintains a commercial interest in weather/hurricane season predictions). # I follow her blog most days ~ the blog is slightly redeemed by one or two of the commenters there. The blog is a somewhat more genteel version of WUWT blog.
Unlike Drs Spencer & Christie, and the definitely-emeritus Prof Lindzen, the good Dr Curry maintains a certain amount of vagueness in her speech and presentations . . . implying that she is not quite opposed to the mainstream climate science. Vagueness & a degree of "uncertainty" are her game ~ enough fuzziness for some Plausible Deniability, when someone tries to pin her down now or at a future date. But it is as obvious as an elephant in your kitchen, about which side of the scientific fence she occupies. And this goes down well with the usual group of denialist U.S. senators.
** Up to as much as two-thirds of modern rapid global warming might possibly be owing to "natural variations" or ocean/atmosphere cycles . . . that's the sort of Plausible Deniability she goes for. So no need to take any climate action.
Mr John Stossel is a reporter that has gone over to the Dark Side, years ago. Basically a propagandist. I haven't followed him closely enough to allow me to make a psychiatric assessment.
- A Frank Discussion About the Propagation of Measurement Uncertainty
nigelj at 07:01 AM on 12 August, 2023MAR @14. Good points.
Franks "wondrous theory" does indeed sound crazy. What mystifies me is how a guy with a Phd in chemistry, thus very highly scientifically literate could get relatively basic things like that wrong. Because its fairly well doumented that the up and down variation in year to year temperatures is due in large part to a component of natural variability cycles. And he does not seem like a person that would dispute the existence of natural climate cycles.
It makes me wonder if he hasnt actually read much background information like this on the actual climate issue - and perhaps feels he is such a genius that he doesn't need to. Yet this would be astounding really that he is unaware of short term climate cycles and cant see their relevance. I do not have his level of scientific training by a long way, but its obvious to me.
It seems more likely he is he just being crazy about things for whatever reasons and this craziness seems to be the main underling characteristics of a crank. But their frequent narcissim means no matter how much you point out the obvious flaws they just go on repeating the same theories, thus their nonsense certainly compounds over time.
- 2nd law of thermodynamics contradicts greenhouse theory
EddieEvans at 07:58 AM on 7 June, 2023scaddenp at 07:01 AM on 7 June 2023
2nd law of thermodynamics contradicts greenhouse theory
I've forgotten how to use this board and answer. I'm not clear on what you don't understand. The blanket analogy is a common metaphor because the Earth's heat is being trapped by greenhouse gases, not unlike Venus.
I understand that the Earth warms and cools, primarily, by the Malankovich Cycles and trapped greenhouse gases. Is someone saying otherwise, and if so, how do they explain worldwide glacier melt and sea level rise?
- Antarctica is gaining ice
scaddenp at 07:41 AM on 25 May, 2023Just for clarification for other readers, as I pointed out above, Bart's conjecture "reduced sea ice mean more snowfall" is not expected given very low sea surface temperatures. To demonstrate that, Bart would need to show that precipatation varies in sync with sea-ice (which has both increased and decreased in recent history). By contrast, there is evidence for variations being due to multiyear weather cycles.
As to ice loss (overwhelmingly calving since most of Antarctica is too cold for melt), while the SAM is positive then continued basal erosion of the ice shelves is expected from warm deep water (eg see "The circum-Antarctic ice-shelves respond to a more positive Southern Annular Mode with regionally varied melting" ) and a useful summary here.
Loss of ice shelves leads to increased calving (see here with its links to relevent papers) as does loss of sea ice. That is why my money is on continued ice loss despite some weather noise. Let's see what an El Nino will bring after three La Nina years.
- Antarctica is gaining ice
scaddenp at 07:54 AM on 23 May, 2023"Nobody knows.." Hmm. Certainly investigated. See "Interannual ice mass variations over the Antarctic ice sheet from 2003 to 2017 were linked to El Niño-Southern Oscillation"
Shows correlation of AP and WAIS with ENSO and anticorrelation of EAIS.

Hmm. ok, only 2017. What about GFO and recent records. There is some detailed analysis in "Spatially heterogeneous nonlinear signal in Antarctic ice-sheet mass loss revealed by GRACE and GPS (2023)"
and another study of links with other quasi-periodic cycles in Antarctica in "Antarctica ice-mass variations on interannual timescale: Coastal Dipole and propagating transports"
Evidence to date - based on correlations of where the changes in ice mass are occurring - links interannual change to short term (2-8 year) quasi-periodic weather cycles (ENSO, Antarctic Circumpolar Wave, Antarctic Occillation) influencing Antartica.
My money (literally) would be on continued long term ice loss. Short term variation as observed here to date would certainly NOT be a reason for change in climate mitigation policy.
- EPA’s car pollution rules would save Americans trillions of dollars
Eric (skeptic) at 23:13 PM on 11 May, 2023758 page EPA "proposed rules" link above is broken. I tried looking the same document up and found other sites with the same link like this eelp.law.harvard.edu/wp-content/uploads/EELP-EPA-Clean-Cars-Rule-Summary-April-2023.pdf. They describe some more of the quantitative benefits in that document.
I have a question however. Have the vehicle emissions been segmented into tailpipe and non-tailpipe? In this source they say "Thus, non-exhaust sources, including brake and tire wear PM, have become larger contributors to traffic-related emissions as well as to ambient PM2.5 (particles less than 2.5 um) concentrations." www.me.ucr.edu/news/2020/10/05/brake-and-tire-wear-particles-emerging-source-air-pollution
Another question is hormesis. There's a J-curve to many things like particulates. There's a slight detriment to having none, then a benefit at low amounts, then more detrimental at increasing amounts and very detrimental at high amounts. Figuring out where people are on the curve will change the costs and benefits for various groups. City dwellers will always have more pollution but will also (and have also) benefitted the most from EVs. I can't tell if they did that segmentation or not.
Final question is how soon to transition for various groups considering the grid mix. In some places it will make sense to wait considering the battery will be worn out with charge cycles before the grid has been transitioned away from mostly fossil. The segementation by group could probably be applied by county based on vehicle-mile density and grid fuel mix.
- CO2 is not the only driver of climate
Bob Loblaw at 07:54 AM on 9 May, 2023piotr @ 73:
I am not sure what your "not directly" statement refers to. I presume that the Martin Mlynczak quote is the one in comment 69. To put it simply, the thermosphere and the earth's surface respond to solar radiation in very different ways. You can read about the thermosphere on Wikipedia. Note that the thermosphere is at very high altitudes (>80km), and its temperature structure is the result of the absorption of UV radiation. It also has very low density, so even though average kinetic energy is high ("temperature") it does not hold a lot of heat. It is not strongly linked to the surface, which is heated by the absorption of solar radiation over the full spectrum.
This paper by Lean, Beer, and Bradley (1995) shows in figure 2 that variations in total solar irradiance are much less than for the UV range (in %).

To use the 4W/m2 drop in that figure, you need to first reduce it by a factor of 4 (area of a sphere vs. area of a circle), and then adjust for global albedo (0.3), giving an overall forcing of only about 0.7 W/m2. Sustained over only a period of about 50 years, this is not going to have a major cooling effect on its own.
You say that "it noticeabl[y]e cooled large parts of the no[r]thern hemisphere", which I presume is a claim with respect to surface temperature responding to these solar variations. You then throw in volcanic effects. You seem to grossly overestimate those solar effects, though - with no references to any supporting information. If you look at this SkS post, the first figure shows that reconstructed global temperatures for that period are much smaller than your claimed "decrease up to 1.5°C".

In your second paragraph, you start talking about "The past 10.000 years where up and downs in global mean temperature like +/- 2°C for dozen decades, even for nearly 2000 years - as we can reconstruct with little data-points." This starts to wander into the last glacial period, where Milankovitch cycles start to play a role. You are mixing together a lot of different forcing mechanisms, as if they are all equivalent in some fashion.
You then start into urban heat island effects, and finish off with a couple of paragraphs that represent an argument from incredulity. If you actually want to learn something about temperature reconstructions from proxies, Wikipedia has a decent article on this, too. The Wikipedia page also has a graph that shows even less variation in temperature than the one above:

The numbers you are throwing around in your "just imagine" scenarios seem to be ones that you have a lot of confidence in. The problem is that they also appear to disagree with broad swaths of the scientific literature. You appear to be claiming that science is unsure of what happened in the past - but you are. It seems highly unlikely that you are correct.
If you want to have any credibility here, you are going to have to provide references to the numbers you post. This is not a site where you will be permitted to post a lot of unsubstantiated opinion. As you are a new user here, I strongly suggest that you read the Comments Policy.
- There is no consensus
Albert at 09:46 AM on 20 April, 2023"Such low ECS figures would mean the earth's climate should be almost perfectly stable over geologic time (no glacial-interglacial cycles) and we know that's not true."
Rob, believe it or not there are other factors that effect global temperature like, the sun, solar winds, magnetic fields, cosmic rays, transportation and retention and expulsion of ocean heat, volcanic activity above and below water, aerosols, clouds, gravitational pull of other planets, milankovitcg cycles, earth rotation wobble, shifting of poles, etc.
Our current warming cycle started around 1700 as The little ice age peaked negatively and we have been warming sporadically ever since.
its all perfectly normal with many historical precedents in the Holocene and previous interglacials.
1000 years ago Vikings colonised and farmed parts of Greenland that are still permafrost today. How can this be unless Greenland was far hotter than today. etc Etc etc.
But Michael Mann showed us in his model that the medieval warm period and little ice age never existed so all those thousands of scientists that proved they did exist must be wrong.
- There is no consensus
Rob Honeycutt at 00:52 AM on 20 April, 2023Albert @920... "...but if you believe that feedbacks are "well known" pleas provide an exampl that is not ambiguous."
a) You've accepted that the direct effect from doubling CO2 would cause 1.2°C of warming, therefore there would be some loss of ice cover and some increase in water vapor, both producing additional warming.
b) We have currently raised CO2 levels by about 50% and already seen about 1.2°C of warming in the modern era.
c) Such low ECS figures would mean the earth's climate should be almost perfectly stable over geologic time (no glacial-interglacial cycles) and we know that's not true.
d) CO2+feedbacks (~3°C) explain a great many other geologic effects related to temperature including the gradual fall in global temp over the past 60my.
Dismissing feedbacks is an assertion of blind faith in the face of overwhelming evidence to the contrary. You just have to read the body of research.
- 2023 SkS Weekly Climate Change & Global Warming News Roundup #8
Bob Loblaw at 05:27 AM on 28 February, 2023ubrew12 @12:
I don't think Evan was trying to fool anyone, but he was trying to make people think. Seeing his original comment @3, and the responses @4 and 5, the path my brain went into was:
- 100,000 years sounds an awful lot like glacial cycles.
- 120m sounds an awful lot like sea level changes between glacials and interglacials.
- Effects of Saturn and Jupiter sound an awful lot like the kinds of gravitational forces that cause wobbles and slight shifts in earth's orbital patterns...
- ...which leads to Milankovitch theory.
Rather than jumping into a mode of "this seems absurd..", I went into a mode of "maybe Evan is thinking about something other than the obvious..."
- 2023 SkS Weekly Climate Change & Global Warming News Roundup #8
Evan at 14:20 PM on 27 February, 2023ubrew12@12, glad we cleared that up. I simply like to remind people how delicately balanced Earth's systems are. The current effect of the Milankovitch cycles on our planetary systems fascinate me.
- 2023 SkS Weekly Climate Change & Global Warming News Roundup #8
ubrew12 at 14:02 PM on 27 February, 2023Evan@7 said "I am simply framing the effects of the Milankovitch cycles in a way that people may not normally think of them." Yes, you certainly fooled me. It makes sense that they would be a 'forcer' for those cycles, but I thought you were refering to some kind of direct gravitational effect.
- 2023 SkS Weekly Climate Change & Global Warming News Roundup #8
Evan at 11:14 AM on 27 February, 2023scaddenp@9, good points. Isn't it remarkable that the Earth ever so slowly changed over millions of years until we arrived at this delicate position where ice-age cycles took us up and down, cycling between 180m and 60m equivalent sea level rise worth of ice on land. The incredible sensitivity of Earth to the tugs and pulls of Jupiter and Saturn are a true indication of the delicate balance that Earth has functioned in for so long.
- 2023 SkS Weekly Climate Change & Global Warming News Roundup #8
scaddenp at 10:58 AM on 27 February, 2023The milkankovich cycles are only able to force ice ages (and sea level) when GHGs levels are so low that summer insolation at high latitudes doesnt not melt snow. (The milankovich cycles operated long before the Pleistocene ice ages). The simple geoengineering to prevent an ice age is to increase GHG to such a level (around 400ppm) that they dont have an effect. Whoops! we have just done that.
We definitely agree with Wally Broecker that climate is an angry beast and that we shouldnt be poking it with a stick.
- 2023 SkS Weekly Climate Change & Global Warming News Roundup #8
Evan at 06:35 AM on 27 February, 2023Bob@6, correct. These are not tidal forces due to Jupiter and Saturn, but rather complex feedback processes triggered by varying orbital cycles due to the tug and pull of Jupiter and Saturn on the Earth, ala the Milankovitch cycles.
I did not give a reference because I am simply framing the effects of the Milankovitch cycles in a way that people may not normally think of them.
- 2023 SkS Weekly Climate Change & Global Warming News Roundup #8
Bob Loblaw at 05:35 AM on 27 February, 2023ubrew12, Phillippe:
At a guess, I expect that Evan may be claiming that the variations in the Milankovitch cycles are due to the gravitational effects of Saturn and Jupiter, such that we have glacial/intergalcial periods at 100,000-year intervals. And that causes sea level changes of 120m.
Just a hunch. Evan can confirm.
- It's the sun
Jim Hunt at 00:42 AM on 13 February, 2023As blind chance etc. would have it I currently find myself engaging with Judith Curry's denizens under her article about the recent joint venture with Jordan Peterson.
This is presumably the cause of some or all of the "it's the sun, stupid!" nonsense currently being promulgated in the Twittodenialosphere?
As a consequence my Arctic alter ego felt compelled to bring the following NASA article to the attention of one such Dunning-Kruger sufferer:
https://climate.nasa.gov/ask-nasa-climate/2949/why-milankovitch-orbital-cycles-cant-explain-earths-current-warming/
Elon's new thought police helpfully suggested that I might want to reconsider my attempted violation of Twitter's community guidelines:
The allegedly "offensive language" was merely echoing that of the DK sufferer in question.
What a "Brave New World" we currently inhabit!
- The escalator rises again
nigelj at 06:12 AM on 7 February, 2023"The New Pause lengthens again: 101 months and counting …"
This astounds me. Have these denialists nothing better to do? Haven't they noticed a decades long repeating pattern of pauses of various sizes such that the temperature trend is step like? Havent they figured out by now that is how the warming trend progresses? Haven't they studied the obvious reasons it would be like this, such as the influence of solar cycles, etc,etc?
Are they really that lacking in thought? Or perhaps its more of an activity that just makes them feel good and gives them comfort by throwing mud at perceived enemies! Or perhaps its just wanting to protect vested interests for as long as possible. Or are they just cranks? Probably WUWT is an unholy alliance of all these types of personalities and more.
- Human CO2 is a tiny % of CO2 emissions
Bob Loblaw at 06:12 AM on 27 December, 2022Doug Cannon @ 358:
Where do you get your 77 tons per acre number from? Is that tons of carbon, or tons of CO2 equivalent? And since you are using acres, is that an imperial ton, rather than metric?
I am fairly familiar with forest carbon cycles in the boreal forest, and 77 tons per acres is close to 200 metric tonnes per hectare, which is a reasonable number for entire ecosystem carbon in the boreal forest. But this includes tree biomass, root biomass, leaf litter, dead branches, and soil carbon. And soil carbon (in the boreal forest) is often as much or more than the tree biomass. And this ecosystem carbon does not accumulate in a day, or a year, or even a decade - we're talking centuries-old ecosystems.
Please explain your calculations, and give us a rate of carbon uptake per year. Then you can compare it to annual fossil fuel emission rates. Then you can calculate how much area is needed to offset current emissions - and then how much area (and time) is needed to suck out the CO2 we've already added over the past century..
- Skeptical Science New Research for Week #50 2022
peterklein at 07:12 AM on 16 December, 2022I mostly became mostly aware of the climate and global warming issue about the time that Al Gore began beating the drum (even while he continued to fly globally in his private jet). Since then, I've read about climate change and climate modeling from many sources, including ones taking the position that ‘it is not a question if it is a big-time issue, but what to do about it now, ASAP?’.
In the past few weeks, it appeared to me there has been a of articles, issued reports, and federal government activity, including recently approved legislation, related to this topic. While it obviously has been one of the major global topics for the past 3+ decades, the amount of public domain ‘heightened activity’ seems (to me) to come in waves every 4-6 months. That said, I decided to write on the topic based on what I learned and observed over time from articles, research reports, and TV/newspaper interviews.
There clearly are folks, associations, formal and informal groups, and even governments on both sides of the topic (issue). I also have seen over the decades how the need for and the flow of money sometimes (many times?) taints the results of what appear to be ‘expert-driven and expert-executed’ quantitative research. For example, in medical research some of the top 5% of researchers have been found altering their data and conclusions because of the source of their research funding, peer ‘industry’ pressure and/or pressure from senior academic administrators.
Many climate and weather-related articles state that 95+% of researchers agree on major climate changes; however (at least to me) many appear to disagree on the short-medium-longer term implications and timeframes.
What I conclude (as of now)
1. This as a very complex subject about which few experts have been correct.
2. We are learning more and more every day about this subject, and most of what we learn suggests that what we thought we knew isn't really correct or at least as perfectly accurate as many believe.
3. The U.S. alone cannot solve whatever problem exists. If we want to do something constructive, build lots of nuclear power plants ASAP (more on that to follow)!
4. Any rapid reduction in the use of fossil fuels will devastate many economies, especially those like China, India, Africa and most of Asia. Interestingly, the U.S. can probably survive a 3 or 4% reduction in carbon footprint annually over the next 15 years better than almost any country in the world, but this requires the aforementioned construction of multiple nuclear electrical generating facilities. In the rest of the world, especially the developing world, their economies will crash, and famine would ensue; not a pretty picture.
5. I am NOT a reflexive “climate denier” but rather a real-time skeptic that humans will be rendered into bacon crisps sometime in the next 50, 100 or 500+ years!
6. One reason I'm not nearly as concerned as others is my belief in the concept of ‘progress’. Look at what we accomplished as a society over the last century, over the last 50, 10, 5 and 3 years (e.g., Moore’s Law is the observation that the number of transistors on integrated circuits doubles about every two years!). It is easy to conclude that we will develop better storage batteries and better, more efficient electrical grids that will reduce our carbon footprint. I'm not so sure about China, India and the developing world!
7. So, don't put me down as a climate denier even though I do not believe that the climate is rapidly deteriorating or will rapidly deteriorate as a result of CO2 upload. Part of my calm on this subject is because I have read a lot about the ‘coefficient of correlation of CO2 and global warming, and I really don't think it's that high. I won't be around to know if I was right in being relaxed on this subject, but then I have more important things to worry about (including whether the NY Yankees can beat Houston in the ACLS playoffs, assuming they meet!).
My Net/Net (As of Now!)
I am not a researcher or a scientist, and I recognize I know far less than all there is to know on this very complex topic, and I am not a ‘climate change denier’… but, after
also reading a lot of material over the years from ‘the other side’ on this topic, I conclude it is monumentally blown out of proportion relative to those claiming: ‘the sky is falling and fast’!
• Read or skim the book by Steven Koonin: Unsettled: What Climate Science Tells Us, What It Doesn't, and Why It Matters /April 27, 2021; https://www.amazon.com/Unsettled-Climate-Science-Doesnt-Matters/dp/1950665798
• Google ‘satellite measures of temperature’; also, very revealing… see one attachment as an example.
• Look at what is happening in the Netherlands and Sri Lanka! Adherence to UN and ESG mandates are starving countries; and it appears Canada is about to go over the edge!
• None of the climate models are accurate for a whole range of reasons; the most accurate oddly enough is the Russian model but that one is even wrong by orders of magnitude!
• My absolute favorite fact is that based on data from our own governmental observation satellites: the oceans have been rising over the last 15 years at the astonishing rate of 1/8th of an inch annually; and my elementary mathematics suggests that if this rate continues, the sea will rise by an inch sometime around 2030 and by a foot in the year 2118… so, no need to buy a lifeboat if you live in Miami, Manhattan, Boston, Los Angeles, or San Francisco!
• Attached is a recent article and a Research Report summary.
Probably the most damning is the Research Report comparison of the climate model predictions from 2000, pointing to 2020 versus the actual increase in temperature that has taken place in that timeframe (Pages 9-13). It's tough going and I suggest you just read the yellow areas on Page 9 (the Abstract and Introduction, very short) and the 2 Conclusions on Page 12. But the point is someone is going to the trouble to actually analyze this data on global warming coefficients!
My Observations and Thinking
In the 1970s Time Magazine ran a cover story about our entering a new Ice Age. Sometime in the early 1990s, I recall a climate scientist sounding the first warning about global warming and the potentially disastrous consequences. He specifically predicted high temperatures and massive floods in the early 2000’s. Of course, that did not occur; however, others picked up on his concern and began to drive it forward, with Al Gore being one of the primary voices of climate concern. He often cited the work in the 1990’s of a climate scientist at Penn State University who predicted a rapid increase in temperature, supposedly occurring in 2010 and, of course, this also did not occur.
Nonetheless many scientists from various disciplines also began to warn about global warming starting in the early 2000’s. It was this growing body of ‘scientific’ concern that stimulated Al Gore's concern and his subsequent movie. It would be useful for you to go back to that and review the apocalyptic pronouncements from that time; most of which predicted dire consequences, high temperatures, massive flooding, etc. which were to occur in 10 or 12 years, certainly by 2020. None of this even closely occurred to the extent they predicted.
That said, I was still generally aware of the calamities predicted by a large and diverse body of global researchers and scientists, even though their specific predictions did not take place in the time frame or to the extent that they predicted. As a result, I become a ‘very casual student’ of climate modeling.
Over the past 15 years climate modeling has become a popular practice in universities, think-tanks and governmental organizations around the globe. Similar to medical and other research (e.g., think-tanks, etc.) I recognized that some of the work may have been driven by folks looking for grants and money to keep them and their staff busy.
A climate model is basically a multi-variate model in which the dependent variable is global temperature. All of these models try to identify the independent variables which drive change in global temperature. These independent variables range from parts per million of carbon dioxide in the atmosphere to sunspot activity, the distance of the earth from the sun, ocean temperatures, cloud cover, etc. The challenge of a multi-variant model is first to identify all of the various independent variables affecting the climate and then to estimate the percent contribution to global warming made by a change in any of these independent variables. For example, what would be the coefficient of correlation for an increase in carbon dioxide parts per million to global warming?
You might find that an interesting cocktail party question to ask your friends “what is the coefficient of correlation between the increase in carbon dioxide parts per million and the effect on global warming?” I would be shocked if any of them even understood what you were saying and flabbergasted if they could give you an intelligent answer! There are dozens of these climate models. You might be surprised that none of them has been particularly accurate if we go back 12 years to 2010, for example, and look at the prediction that the models made for global warming in ten years, by 2020, and how accurate any given model would be.
An enterprising scientist did go back and collected the predictions from a score of climate models and found that a model by scientists from Moscow University was actually closer to being accurate than any of the other models. But the point is none were accurate! They all were wrong on the high side, dramatically over predicting the actual temperature in 2020. Part of the problem was that in several of those years, there was no increase in the global temperature at all. This caused great consternation among global warming believers and the scientific community!
A particularly interesting metric relates to the rise in the level of the ocean. Several different departments in the U.S. government actually measures this important number. You might be surprised to know, as stated earlier, that over the past 15 or so years the oceans have risen at the dramatic rate of 1/8th of an inch annually. This means that if the oceans continued to rise at that level, we would see a rise of an inch in about 8 years, sometime around 2030, and a rise of a foot sometime around the year 2118. I suspect Barack Obama had seen this data and that's why he was comfortable in buying an oceanfront estate on Martha's Vineyard when his presidency ended!
The ‘Milankovitch Theory’ (a Serbian astrophysicist Milutin Milankovitch, after whom the Milankovitch Climate Theory is named, proposed about how the seasonal and latitudinal variations of solar radiation that hit the earth in different and at different times have the greatest impact on earth's changing climate patterns) states that as the earth proceeds on its orbit, and as the axis shifts, the earth warms and cools depending on where it is relative to the sun over a 100,000-year, and 40,000-year cycle. Milankovitch cycles are involved in long-term changes to Earth's climate as the cycles operate over timescales of tens of thousands or hundreds of thousands of years.
So, consider this: we did not suddenly get a lot more CO2 in the atmosphere this year than we had in 2019 (or other years!), but maybe the planet has shifted slightly as the Milankovitch Theory states, and is now a little closer to the sun, which is why we have the massive drought. Nothing man has done would suddenly make the drought so severe, but a shift in the axis or orbit bringing the planet a bit closer to the sun would. It just seems logical to me. NASA publicly says that the theory is accurate, so it seems that is the real cause; but the press and politicians will claim it is all man caused! You can shut down all oil production and junk all the vehicles, and it will not matter per the Theory! Before the mid-1800’s there were no factories or cars, but the earth cooled and warmed, glaciers formed and melted, and droughts and massive floods happened. The public is up against the education industrial complex of immense corruption!
In the various and universally wrong ‘climate models’, one of the ‘independent’ variables is similar to the Milankovitch Theory. Unfortunately, it is not to the advantage of the climate cabal to admit this or more importantly give it the importance it probably deserves.
People who are concerned about the climate often cite an ‘increase in forest fires, hurricanes, heat waves, etc. as proof of global warming’. And many climate deniers point out that most forest fires are proven to be caused by careless humans tossing cigarettes into a pile of leaves or leaving their campfire unattended, and that there has been a dramatic decrease globally on deaths caused by various climate factors. I often read from climate alarmists (journalists, politicians, friends, etc.), what I believe are ‘knee-jerk’ responses since they are not supported by meaningful and relevant data/facts, see typical comments below:
• “The skeptical climate change deniers remind me of the doctors hired by the tobacco industry to refute the charges by the lung cancer physicians that tobacco smoke causes lung cancer. The planet is experiencing unprecedented extreme climate events: droughts, fires, floods etc. and the once in 500-year catastrophic climate event seems to be happening every other year. Slow motion disasters are very difficult to deal with politically. When a 200-mph hurricane hits the east coast and causes a trillion dollars in losses then will deal with it and then climate deniers will throw in the towel!”
These above comments may be right, but to date the forecasts on timing implications across all the models are wrong! It just ‘may be’ in 3, 10 or 50 years… or in 500-5000+ before the ‘sky is falling’ devastating events directly linked to climate occur. If some of the forecasts, models were even close to accuracy to date I would feel differently.
I do not deny there are climate related changes I just don’t see any evidence their impact is anywhere near the professional researchers’ forecasts/models on their impact as well as being ‘off the charts’ different than has happened in the past 100-1000+ years.
But a larger question is “suppose various anthropogenetic actions (e.g., chiefly environmental pollution and pollutants originating in human activity like anthropogenic emissions of sulfur dioxide) are causing global warming?”. What are they, who is doing it, and what do we do about it? The first thing one must do is recognize that this is a global problem and that therefore the actions of any one country has an effect on the overall climate depending upon its population and actions. Many in the United States focus intensely upon reducing carbon emissions in the U.S. when of course the U.S. is only 5% of the world population. We are however responsible for a disproportionate part of the global carbon footprint; we contribute about 12%. The good news is that the U.S. has dramatically reduced its share of the global carbon footprint over the past 20 years and doing so while dramatically increasing our GDP (up until the 1st Half of 2022).
Many factors have contributed to the relative reduction of the U.S. carbon footprint. Chief among these are much more efficient automobiles and the switch from coal-driven electric generation plants to those driven by natural gas, a much cleaner fossil fuel.
While the U.S. is reducing its carbon footprint more than any other country in the world, China has dramatically increased its carbon footprint and now contributes about 30% of the carbon expelled into the atmosphere. China is also building 100 coal-fired plants!
Additional facts, verified by multiple sources including SNOPES, the U.,S. government, engineering firms, etc.:
• No big signatories to the Paris Accord are now complying; the U.S. is out-performing all of them.
• EU is building 28 new coal plants; Germany gets 40% of its power from 84 coal plants; Turkey is building 93 new coal plants, India 446, South Korea 26, Japan 45, China has 2363 coal plants and is building 1174 new ones; the U.S. has 15 and is building no new ones and will close about 15 coal plants.
• Real cost example: Windmills need power plants run on gas for backup; building one windmill needs 1100 tons of concrete & rebar, 370 tons of steel, 1000 lbs of mined minerals (e.g., rare earths, iron and copper) + very long transmission lines (lots of copper & rubber covering for those) + many transmission towers… rare earths come from the Uighur areas of China (who use slave labor), cobalt comes from places using child labor and use lots of oil to run required rock crushers... all to build one windmill! One windmill also has a back-up, inefficient, partially running, gas-powered generating plant to keep the grid functioning! To make enough power to really matter, we need millions of acres of land & water, filled with windmills which consume habitats & generate light distortions and some noise, which can create health issues for humans and animals living near a windmill (this leaves out thousands of dead eagles and other birds).
• So, if we want to decrease the carbon footprint on the assumption that this is what is driving the rise in the sea levels (see POV that sea levels are not rising at: www.tiktok.com/t/ZTRChoNTg) and any increase in global temperature, we need to figure out how to convince China, India and the rest of the world from fouling the air with fossil fuels. In fact, if the U.S. wanted to dramatically reduce its own carbon footprint, we would immediately begin building 30 new nuclear electrical generating plants around the country! France produces about 85% of its electrical power from its nuclear-driven generators. Separately, but related, do your own homework on fossil fuels (e.g., oil) versus electric; especially on the big-time move to electric and hybrid vehicles. Engineering analyses show you need to drive an electric car about 22 years (a hybrid car about 15-18 years) to breakeven on the savings versus the cost involved in using fossil fuels needed to manufacture, distribute and maintain an electric car! Also, see page 14 on the availability inside the U.S. of oil to offset what the U.S. purchases from the middle east and elsewhere, without building the Keystone pipeline from Canada.
Two 4-5-minute videos* on the climate change/C02/new green deal issue, in my opinion, should be required viewing in every high school and college; minimally because it provides perspective and data on the ‘other’ side of the issue while the public gets bombarded almost daily by the ‘sky is falling now or soon’ side on climate change!
* https://www.prageru.com/video/is-there-really-a-climate-emergency and
https://www.prageru.com/video/climate-change-whats-so-alarming - Models are unreliable
Bob Loblaw at 07:31 AM on 29 November, 2022Eddie et al (comments 1314-1417) on Spencer's video and blog post.
Thanks, MAR, for the link to Spencer's blog post. I followed his link to the NOAA data source, and looked at the numbers. If I grab the June, July, and August monthly values (the standard climatological "summer"), I get the same results: about 0.26C/decade. That checks out. A few things that Spencer does not mention:
- The overall trend is not particularly linear.
- The r2 value is rather low.
- The standard error on the slope esitmate is 0.04 C/decade.
Here is a graph of the data:

The uncertainty on the trend covers some of the model range he provides in the blog post. Two sigma range places the observed trend between 0.17 and 0.35 C/decade.
The model trends also include a level of internal variability. The observations follow a specific pattern of "unforced variations" related to cycles such as El Nino, etc., while individual model runs and models will have different patterns within a specific model run. Over shorter periods, and smaller areas, you need to consider this in making any comparisons. For models, they often get an "ensemble mean" of many runs with different variability - but the observations are still a "single roll of the dice" that can fall anywhere in the range of the collection of model runs and still be consistent with the models.
I see that you have already found the Great Global Warming Blunder post at RealClimate. They also have a couple of other relevant posts:
This one talks about how unforced variability affects model runs.
This one talks about things to consider in comparing models and observations.
Tamino's blog is also a useful place to look whenever statistical stuff comes up. In this post, he points out several aspects of the use of the continental US for data. He covers the non-linearity of trends, the variations in trends in different parts of the US, and points out that the continental US represents 1.6% of the global area (ripe for cherry picking).
In general, Spencer tends to get more wrong than he gets right.
P.S. The preferred abbreviation for SkepticalScience is SkS (for obvious reasons).
- Skeptical Science New Research for Week #43 2022
Bob Loblaw at 23:15 PM on 8 November, 2022Art @ 22: "I can equally argue that fossil fuels are carbon neutral."
Only if you have no idea how time constants influence carbon storage.
"Well, perhaps you should consult a geologist as I did."
If you go to the menus at the top of the SkS page, choose "About" and "Team", you will find that I have quite a bit of my own experience and knowledge about forest carbon cycles.
I see you have not yet bothered to learn anything about tree respiration. If you follow the link I gave you in comment #21, you will see the following:
In general, the sugar produced by a tree is allocated and used in the following order of importance:
- Respiration
- Structure
- Storage
- Defense
- Reproduction
Feel free to continue to flaunt your ignorance.
- 2022 SkS Weekly Climate Change & Global Warming News Roundup #42
MA Rodger at 19:06 PM on 30 October, 2022The TSI data linked by scvblwxq1@6 shows the TSI for sunspot cycle 25 to-date, so TSI for the period 2018-to-date. The same website also gives TSI data back to the start of the satellite record, so since the end of 1978 (sunspot cycles 21 to 24). Comparing the two data sets (they need splicing together) shows the rise in TSI so far for sunspot cycle 25 has yet to top the peak of sunspot cycle 24, itself a rather weak sunspot cycle, as the graphic of sunspot numbers below suggests.
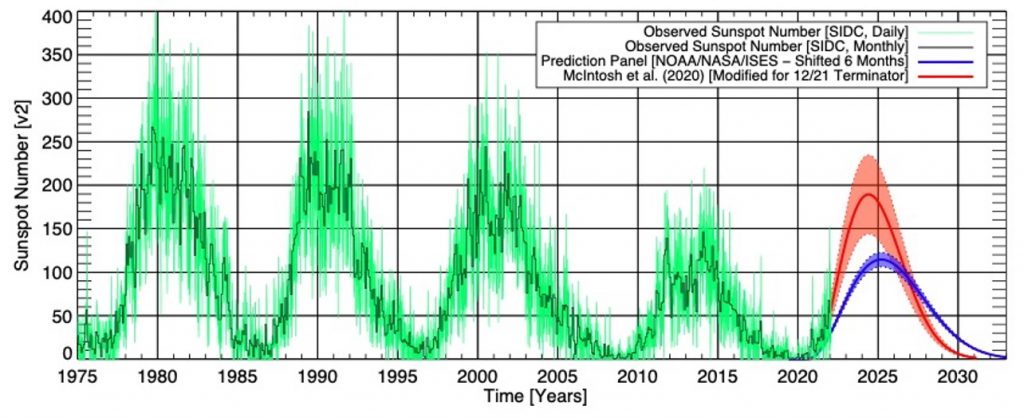
- From the eMail bag: A Review of a paper by Ellis and Palmer
Bob Loblaw at 03:43 AM on 9 October, 2022The albedo argument of Ellis and Palmer is an odd one. They explicitly state in their section 3.2 that they think it is incorrect to consider the albedo effect as a global one. In discussing the common approach to albedo feedback amounts, and comparing it to the CO2 feedback, they state:
The strength of the albedo feedback was calculated as being in the same range, or about 3 W/m2 over the full interglacial cycle (Hansen et al., 2012, Fig. 5c and p12). This figure was derived by equating albedo with sea levels, and therefore with ice extent, which spreads the albedo effect out across the entire globe in a similar fashion to the calculation for CO2. But this is likely to be an erroneous procedure.
They go on to argue that their localized "one day, one latitude" calculation of radiative effects is the proper one to use. They conclude one paragraph with:
As Fig. 3 clearly demonstrates, interglacials are only ever triggered by Great Summer insolation increases in the northern hemisphere and never by increases in insolation during the southern Great Summer, so why spread the influence of albedo across the entire globe?
To put it simply, the change in local or regional albedo represents one part of global albedo. To address the question of how much solar radiation the globe absorbs (which is the proper question for looking at global climate), you need to consider all of the globe - each latitude, each day, and each individual surface cover. The contribution of a single location is directly proportional to the area it covers - as a fraction of the total area of the planet.
Global changes in global albedo, caused by large white ice sheets replacing dark forests (or the reverse), is an important feedback. When climate science speaks "albedo feedback", it is this large scale issue that they mean, not Ellis and Palmer's local microclimate one.
The Rapp et al unpublished paper that MA Rodger refers to is an interesting side note. It still focuses on albedo and high-latitude insolation. It at least considers the entire year, not just the summer solstice, but it's efforts at modelling still are extremely simplistic - empirical fits between ice volume and variations in solar input. No actual climate model to provide precipitation inputs or melt processes, or glacier dynamics models to accumulate ice and move it from zones of accumulation to zones of melt.
The Rapp et al paper also seems to be rather confused about CO2 as a feedback vs. CO2 as a forcing. They argue against a straw man: that mainstream climate science thinks that CO2 is supposed to force the glacial/interglacial cycles. (It does not.) CO2 is one feedback. The overall CO2 level influences whether climate will respond to Milankovitch cycles by producing glacial/interglacial cycles, but it does not cause the individual glacial/interglacial periods. A world at 200 ppm CO2, a world at 300 ppm CO2, and a world at 450 ppm CO2 will not respond to orbital changes in solar insolation in exactly the same way.
- From the eMail bag: A Review of a paper by Ellis and Palmer
MA Rodger at 00:49 AM on 9 October, 2022One criticism of Ellis & Palmer (2016) that can be hurled with some confidence is that it has not exactly set the literature alight since it was published six long years ago. That tends to suggest it presents a badly failed hypothesis.
I note one of the citations listed by Google Scholar is for a later unpublished work co-authored by Ellis (evidently 2019 or later) which doen't make such a big thing about this CO2-dust mechanism, although it does continue to stress that CO2 was not the main driver of the ice-age cycles, which most would agree with.
One of the factors working against the grand assertion of Ellis & Palmer (2016), that CO2 leads to reduced plant-growth and thus more dust & lower albedo; one factor is the switch of ice-age period from 40k to 100k. This switch is usually explained by the dust during the earlier 40k phase being diminished as the bare plantless lands close-by glaciated areas were being scoured clean of any dust-generating soils by prior glaciations, scoured back to the bedrock. If this dust is alternatively explained by reduced CO2 suppressing plant-growth, the 40k-100k transition requires a new explanation. And given this requirement the apparent silence by Ellis & Palmer (2016) on the matter is entirely wrong.
- From the eMail bag: A Review of a paper by Ellis and Palmer
Bob Loblaw at 23:20 PM on 8 October, 2022nigel:
You have to read the paper to try to follow the logic (as such) of their argument about CO2 and temperature. It is rather convoluted.
Section 2 of their paper discusses the Milankovitch cycles, and introduces their "see - huge difference in input of energy on summer solstice at 65N" calculation. They use this to argue that albedo reductions due to dust on snow are the real feedback factor explaining how Milankovitch cycles can grow or melt a continental glacier.
In section 3, they do their bogus comparison between the dust-albedo feedback and CO2 radiative effects.
In section 4, they expand on the dust albedo factors.
In section 5, they give their hypothesis how low CO2 leads to reductions in vegetation cover, and how this is what leads to high dust concentrations that accumulate on the ice/snow of the glaciers. It's this last step that allows low albedo that allows the increased solar input (again, summer solstice at 65N) of the Milankovitch cycles to trigger deglaciation.
At the end of it all, they are basically saying that nothing else makes much difference as Milankovitch cycles go through their many wiggles, until vegetation gets so low and albedo of the snow and ice gets low enough so that a high in the 65N summer solstice Milankovitch cycle can finally melt a continent worth of ice.
It's all hanging together by a very thin thread, and their "analysis" is sadly lacking in any sort of model that actually incorporates anything of global/regional climate, the carbon cycle, and glacial dynamics and accumulation/melt.
- No, a cherry-picked analysis doesn’t demonstrate that we’re not in a climate crisis
Eric (skeptic) at 23:14 PM on 8 October, 2022Clausius-Clapeyron means that with global warming the atmosphere can hold more water vapor. Whether it does hold more water vapor depends on a surprisingly complex set of factors. Drought intensification is a simpler case. C-C means there almost always be more evaporation and will often (not always) be more transpiration.
Short term rainfall is a much more complex case. I have found no trend in US 1 hour to 6 hour rainfalls in 500+ stations over 70 years. However as rainfalls get progressively longer (6 instead of 1) there are consistently more increasing trends and fewer declining trends. That's also why we almost never see a new 1 or 5 or 10 minute rainfall record. C-C has essentially zero influence at the very short term. But C-C definitely has more influence at the longer durations which is why we see new 24 hour (and longer) all-time records being set like with Harvey. But Harvey brings up an important point, the water vapor has to come from somewhere and it came a warmer gulf of Mexico. That much is quite obvious.
There are changes in regional tornado climatology. I have yet to do that analysis and it will be a bit difficult with relatively rare events. But overall in the US EF-3 and EF-4 tornadoes are declining, EF-5 are statistically flat. There are flat statistics for winter and generally declining statistics for warmer months, but fewer declines 1990-present than 1950-present. In short, complicated and dependent on time periods affected by natural cycles. Easy to cherry pick.
My Atlantic hurricane analysis found a notable uptick in >= 120 knot storms. I set that threshold to avoid the small numbers problems using categories. RI is interesting, someone needs to write a paper with a new definition because the old definition (>= 30 knots increase in 24 hours) is true for 60% of Atlantic hurricanes. The increase in RI from warmer oceans shows up most strongly at >= 40 knots in 24 hours. Ian met that threshold. But there's also an increase in rapid weakening over water. Over land weakening is expected and I exclude all such cases. Globally Ryan Maue's data shows fewer hurricanes but the average hurricane in stronger. Also have to be careful not to cherry pick intervals.
Overall I agree with the article above that there are many other impacts that need to be considered. That's particularly true if we are going to decide how to rationally spend money on impact mitigation.
- Welcome to Skeptical Science
Joel at 08:00 AM on 13 September, 2022I think it is beyond healthy to differentiate between skepticism and denial as described in this post, as there are many who may claim to be "skeptical" in regards to climate change but, in reality, believe that climate change is almost completely natural or an outright falsity. Sure, there are some natural effects that may cause a very slight and negligible effect on Earth's temperature, such as the mildy fluctuating temperature of the Sun or orbital pattern of Earth, but these phenomena do not appear to be the cause of the sudden and rapid increase in temperature worldwide. There is also an argument that the Earth experiences natural heating and cooling cycles which, while true, is pretty irrelevant considering these cycles take thousands upon thousands of years to develop and create significant impacts to Earth's temperature anomaly. The changes in climate that we are seeing now have been developing more and more since just the Industrial Revolution, and they have only been getting worse in the past several decades. Humans are technically not the only cause of climate change, as there are natural forces that can change Earth's environment in such a way, but it is important to understand that these natural factors are, again, negligible, and humans have done most of the heavy-lifting in contributing to global warming, especially through carbon dioxide emissions. I haven't been the most well-researched person when it comes to climate change, but in no way have I ever once thought of denying the possibility that maybe, just maybe, humans are a direct cause for the plethora of climate related problems we are facing to today.
- How climate change spurs megadroughts
Eric (skeptic) at 11:09 AM on 10 September, 2022Thanks for the reference to the "History of ENSO..." and for the link that worked for me too. The paper references some of the same authors earlier work (e.g. Stahle 1998) for part of the reconstruction: Google Scholar for Stahle 1998. In that 1998 paper they say:
The reconstruction model relies heavily (though not exclusively; Table 1) on the tree-growth response in subtropical North America to wet conditions during El Nino years and dry conditions during La Nina years. However, this model does not uniquely fingerprint ENSO extremes because other circulation patterns can bring drought or wetness to the Texas-Mexico region
It is complicated and the correlation is being used for a reconstruction, not a study of North American drought or causation. As Stahle 1998 points out the drought and wetness has other causes.
I looked through some of the references from History of ENSO and found there were suggestions of more intense and/or prolonged ENSO as early as 1996 (Trenberth and Hoar):
The late 20th century contained a number of extreme and prolonged ENSO episodes (Trenberth and Hoar 1996), including the two most intense El Niños (1982– 1983 and 1997–1998) and La Niñas (1988–1989, 1973–1974).
I think the evidence for prolonged and more intense ENSO cycles is stronger now. Some papers that cite the History of ENSO paper and use that same history to study other drought and rainfall effects. One is Multicentury Evaluation of Recovery from Strong Precipitation Deficits in California which looks at the role of very strong El Nino (e.g. 2016) in drought recovery (2012-15 drought) in California. Note that paper does not look at what role if any that La Nina had, just the role of strong El Nino in drought recovery.
We know from further experience that the 2016 recovery didn't last long. Any effect of global warming on the sign of ENSO will be important if ENSO is an important factor in drought and drought recovery. Also prolonged La Nina like the current one will be problematic if it causes drought and is prolonged by global warming.
- CO2 lags temperature
BudRoberts at 06:58 AM on 27 August, 2022Figure 2a in the Shakun paper seems to confirm that the very minor warming due to higher CO2 after the peak temperature is reached following deglaciation is substantially smaller than the effects of the Milankovitch cycles, which clearly dominate earth's climate. Is that not apparent from the graph?
- How not to solve the climate change problem
Eclectic at 10:20 AM on 24 August, 2022Scvblwxq1 , may I offer a couple of points to save you time (and you may wish to check them against the record of published scientific papers & expert views).
A / The length of interglacials varies considerably. You are correct in saying that an interglacial length does average somewhere around 10,000 years. Yet the present Milankovitch cycle has an unusually low level of ellipticity ~ which likely results in a long interglacial . . . thought to extend for 20-30,000 years (as best as can be judged from prior effects of the Milankovitch cycles during the past million years). In other words, the deep glaciation will next occur in something around 15,000 years from now.
So there is no need to hurry to warm our planet. And it has been estimated that the current (420ppm) level of atmospheric CO2 has already exceeded the level required to make a major postponement in the next glaciation that you were worried about. A postponement of some tens of thousands of years. And so the present-day concern is the adverse effects of the current rapid global warming.
B / Will the proposed Grand Solar Minimum have a (beneficial) cooling effect on planetary temperatures? Evidently not ~ for a GSM typically will produce a global warming of 0.5 degrees or less : and that effect will be insufficient to counter our ongoing AGW of approx 0.18 degrees per decade. Sorry, but there is more warming ahead (even if Prof. Zharkova's very uncertain predictions of GSM turn out to be mostly correct).
- CO2 effect is saturated
Bob Loblaw at 23:28 PM on 6 August, 2022OldHickory @ 646 and 648
Although you have not explicitly stated your definition of "saturation", the reference you provide to Barton Paul Levenson's web page suggests that you are making the argument based on transmission through a finite distance of a medium, as calculated from the Beer-Lambert law.
The Beer-Lambert Law is an exponential decay, and as a result the absorption never reaches 100%. Thus, to use it as an argument for "saturation", you need to make an argument of the form "this is close enough to 100% for all practical purposes". On Levenson's page, he uses 99% to perform the calculations he presents in his table 1.
The catch is, for any given distance you choose where absorption is 99% (and transmission is 1%), I can give you a shorter distance where absorption is less than 99% - even as low as 1%, if I make it short enough. Even if you choose something more that 99%, I can always choose a shorter path with a much lower absorption total.
Let's call your distance L1, and my distance L2. Your "saturation" argument is that increasing CO2 will have a negligible change on tramission through the layer to L1, since it is already almost 100%. But it will have an effect. If the original result is 99%, and increasing the absorption so that it is now 99.6%, is the change important? Well, you will probably argue that 99% and 99.6% are "the same for all practical purposes" - in fact, your "saturation" argument is completely dependent on making such a claim.
But what is the difference if we look at my distance. L2? What was 1% absorption is now 1.2%, and your saturation argument also depends on claiming that 1% and 1.2% are "the same for all practical purposes". The catch is, they are not. We are nowhere close to "saturation", and absorbing 1.2X greater radiation is significant.
One of the major factors in the radiative transfer equations is that absorbed radiation energy will most likely eventually be emitted again, and that emission will be equally likely to be up or down. Small changes in absorption lead to a larger number of absorbed/reemitted cycles before radiation is lost to space from the upper atmosphere, and as that number increases, so does the radiative greenhouse effect.
Your "saturation" argument depends on looking at the process as a single layer, thick enough that you reach "close enough to 100% for all practical purposes", and it fails because you are rolling the effect of many atmospheric layers into one.
I suggest that you read this post on the Beer-Lambert Law (including the comments).
- SkS Analogy 7 - Christmas Dinner and the Faux Pause
Evan at 20:36 PM on 26 July, 2022David-acct@2, as nigelj pointed out, the variation due to solar fluctuations is small. We are currently warming about 0.2C/decade. I think it is difficult for most people to realize just how rapid that really is. Nature gave us cycles which, for the most part, slowly vary, such as TSI. The anthropogenic warming is currently swamping all other natural warming/cooling cycles.
- SkS Analogy 7 - Christmas Dinner and the Faux Pause
nigelj at 11:17 AM on 26 July, 2022David-acct @2
Changes in solar irradiance produce a much smaller warming effect than the anthropogenic greenhouse effect, so any solar heat energy thus sequestered in the oceans and later released, isn't going to be hugely significant. As follows:
"The Sun's overall brightness varies on timescales from minutes to millennia, and these changes are detectable in the global temperature record."
"During strong solar cycles, the Sun's total average brightness varies by up to 1 Watt per square meter; this variation affects global average temperature by 0.1 degrees Celsius or less. "
"Changes in the Sun's overall brightness since the pre-industrial period have been minimal, likely contributing no more than 0.01 degrees Celsius to the roughly 1 degree of warming that's occurred over the Industrial period."
"Projected warming due to increasing greenhouse gas levels in the coming decades will overpower even a very strong Grand Solar Minimum."
"Rising amounts of atmospheric carbon dioxide have postponed the next Milankovitch-driven ice age by at least tens of thousands of years."
www.climate.gov/news-features/understanding-climate/climate-change-incoming-sunlight
- Taking the Temperature: a dispatch from the UK
One Planet Only Forever at 08:17 AM on 26 July, 2022Fixitsan @42 (and other comments),
Thank you for accepting that averaging larger amounts of data provides a clearer indication of long-term trends like the impacts of increasing CO2 levels. That understanding leads to awareness that the surface temperature impact of increased CO2 in the atmosphere is best seen by the trend of the global 30-year moving average (the global version of the one for CET presented on the Wikipedia page I linked to @40). Also, the 30-year ‘global average’ is understandably the better indication of the trend than any regional 30-year average.
I have more to share regarding CO2 and temperatures. But the following will hopefully help explain the comments I will make.
We appear to agreed that many people appear to be uninterested in putting the effort into pursuing the most logical explanations for the ever increasing evidence of what is going on. Learning requires a willingness to change your mind based on ‘new information and evidence’. It can require giving up on developed (status quo) beliefs and actions (no matter how popular, profitable or enjoyable they are).
The following 6 minute BBC Reel item “The psychology behind conspiracy theories” is informative. Watch it. Think about it. Then watch it again. Then seriously consider the possibility that you are resisting learning for some reason(s).
When there is a lot of evidence, as there is regarding climate science (especially since the first IPCC Report in 1990), the understanding still improves as additional evidence is obtained. But the fundamental understanding developed by 1990 is very unlikely to change ‘statistically significantly’ due to new evidence. And the observations you make regarding CET are not ‘new evidence’ (btw, Why is your focus on anything other than what the CET 30-year average trend since 1990 indicates?)
Many other comments have been helpful (they really are), but I will only refer to a few of them.
Bob Loblaw @47 provides a great overlay of the history of CO2 levels and global average surface temperature (GAST). But the 30-year moving average temperature line looks even more like the CO2 line.
You can use the SkS Temperature Trend Calculator to see the 30-year GAST trend for the GISS v4 (the temperature dataset Bob Loblaw used). Choose GISTEMPv4 and set the follow: Start date = 1880; End date = 2023; Moving average = 360 months (30 years). The GISTempv4 30-year moving average increases between 1920 and 1950, and after 1965 (note that there is no ‘levelling off’ in a 600-month moving average). What is happening in the CET is similar. But local conditions can be understood, and expected, to vary relative to the global trend. The term ‘vary’ leads to the next points.
Many variables affect the GAST. It isn’t just the CO2 levels. Increased CO2, primarily due to fossil fuel use, is known to be ‘the major factor’. However, additional variables affecting GAST are already well understood (with more being learned – because – well that’s science for you). They include:
- Aerosols (see nigelj @45)
- Other ghgs in the atmosphere, not just CO2
- ENSO (el Nino, la Nina)
- Solar radiation levels
- Milankovitch (Orbital) Cycles
In addition to variables affecting GAST, there are other factors affecting local climates including:
- ENSO (it affects regional climates as well as being large enough to affect the GAST)
- Atlantic meridional overturning circulation AMOC
The AMOC is weakening due to Global Warming. That could mean cooler winters in the CET region even with increased Global Warming due primarily to increased CO2, due primarily to human activity (primarily fossil fuel use).
So ... it is not wrong to say “Increased CO2 = increased GAST”. All that needs to be understood is that CO2 due to fossil fuel use is only the primary part of the 'increasing GAST and resulting Climate Change' problem.
Closing with a brief bit about the future of the Maldives due to increasing GAST. Reviewing the Climate Central Map of “Land projected to be below annual flood level in 2050” (a detail you missed or misunderstood when commenting about bridges near Edinburgh) you can see that only ‘most of the Maldives’ will be expected to be annually flooded by 2050 (using the default settings). More of the Maldives would be annually submerged in subsequent decades. Mind you, with the default settings, even by 2100 there are still little bits of the Maldives above the annual flood level. A related understanding is that people playing marketplace games can make 'very bad bets'.
A related understanding is that people playing marketplace games can make 'very bad bets', like investing in fossil fuelled pursuits, or buying in the Maldives (like the unfortunate people on Kona, the Big Island, Hawaii who chose to buy property and live in areas that are now under lava).
- 2nd law of thermodynamics contradicts greenhouse theory
MA Rodger at 21:11 PM on 18 July, 2022grindupBaker @1509,
You ask about a particular statement within this talk by Jennifer Kay 2021 'How do clouds affect global warming?'. @6:30 the video addresses the question "How do clouds affect the mean climate?" pointing to a net global mean effect of -21.1Wm^-2 (thus cooling), this comprising -47.3 Wm^-2 (cooling effect) due to albedo and +26.2 Wm^-2 (warming effect) due to a "longwave effect." Thus the statement:-
[From 8:04] "Clouds also have a longwave effect on the system. Just like greenhouse gases in the atmosphere, clouds absorb and re-emit long wave radiation and that actually causes the surface and the atmosphere to be warm."
My own objection to this statement would go no further than pick up on the use of the term "re-emit."
Your objection that "only a tiny portion" of the LW radiation arriving at the surface were 're-emitted' from clouds apparently expresses a similar concern.
But I'm not sure why you would then go beyond simply suggesting the replacement of "re-emit" with "emit". You appear to want to distance these cloud IR emissions from surface warming with description of them setting off "absorb-and-re-emit cycles before succeeding in achieving surface absorption," a description that deploys the very same objectionable "re-emit" term.
The point the video makes is that the climate system ("the surface and the atmosphere") is warm to the level it is significantly because of this long wave cloud effect. And I think we agree it is this warmth that sets the level of IR whizzing about in the atmosphere as well as the level being absorbed and emitted by the surface.
(And as a point of note: I recall that perhaps some 10% of the LWR from clouds will be due to reflection and presumably some will be directly returning surface-emitted IR back to the surface.) - 2nd law of thermodynamics contradicts greenhouse theory
grindupBaker at 16:03 PM on 18 July, 2022MA Rodger @1508 Your "grindupBaker @1507, You ask ... that atmosphere." Thanks. I'll put some thought this winter into wording gooder that bit because "sourced from surface re-emit" is precisely what I object to as being stated as the source of all downwelling LWR at surface and yet the Bob Loblaw glossed right past "re-emit" and focussed a challenge on 50% when I could have readily typed "most" or "some" or "a bunch" instead of "50%" without changing the meaning of my objection at all, and then you stated outright that I was silent ("unchallenged") on "re-emit" so my phrasing there is somehow poor. It isn't just a junk-science cartoon, it's one of the scam types that have served the "Skeptic" community very well the last couple of decades (Henrik Svensmark did a nice one). That junk-science cartoon is the nasty, cunning Scam of Omission (aka The Dog That Barked in The Night). A photon leaves surface, absorbed by CO2 molecule, re-emitted upward, no change, another photon leaves surface, absorbed by CO2 molecule, re-emitted downward, warming surface, got trapped (maybe a couple of repeats in cartoon). It's obvious even to an uneducated mind that this will cause warming so the "greenhouse effect" makes perfect sense. However, an uneducated mind doesn't think to wonder "so is this all that CO2 molecule does regarding photons then ?". The cartoon states outright that the CO2 molecule never gets vibration due to a collision and then sometimes emits a photon in a random direction even though it didn't absorb a photon to re-emit. I could modify that cartoon to show that CO2 molecule emitting 2 photons without absorbing a photon for every photon it absorbs and then adding a CO2 molecule increases upward radiation, so using that junk-science cartoon I could show the public how increased CO2 is actually cooling Earth and how "they" have been deliberately leaving this out to fool people as a hoax. Of course, we both know that radiation to space must decrease with increased tropospheric GHGs because the average emission level becomes higher, becomes cooler and emits less. The bods presenting that cunning Scam of Omission cartoon need to be brought to task by presenting the "greenhouse effect" correctly (like Andrew Dessler does) or the public is going to think it's all a scam when what I've pointed out here is pointed out to them in a form without explanation that's not designed at all to educate them.
Do you concur with physicist climate scientist Jennifer Kay statement at 8:09 at https://www.youtube.com/watch?v=kE1VBCt8GLc that "clouds absorb and re-emit long-wave radiation and that actually causes the surface and the atmosphere to be warm", or do you concur with me that Jennifer provides incorrect physics regarding what "actually causes the surface ... to be warm" because only a tiny portion of the photons that arrive at the surface are "clouds absorb and re-emit" photons, with the vast majority being "manufactured by H2O collisions in clouds" photons (with any number 0 to n of interim absorb-and-re-emit cycles before succeeding in achieving surface absorption) ?
- Skeptical Science New Research for Week #26 2022
Doug Bostrom at 10:03 AM on 4 July, 2022Eclectic, indeed it's true.
Even more, there are about a billion arguably useful (for life-support purposes) years left in our main sequence star. A number of cycles of spectacular folly are left available, though none will likely be so grand as ours given the virgin, ample and easily wasted resource endowment we're chewing up. See the book A Canticle for Leibowitz for a rough picture of how our opportunity may unfold.
Given that hope is where we flee when we have no plan and instead must consign ourselves to some fate immediately at hand ("I hope I don't sink even though I neglected to install a bilge pump"), I'm not sure that the concept of deeper time unpacks as hopeful.
But comforting, yes. Comfort being the term for what we offer the bereaved, when hope is played out. :-)
- Skeptical Science New Research for Week #26 2022
peppers at 00:53 AM on 4 July, 2022I see this as a sort of misplaced approach to this issue, as all this data does little to folks passing by your stand at the swap meet. You are addressing people who may be saying there is no changing happening, and I dont think that remains logical. But some may be saying that to be obstinant or antagonistic. For myself, I dont think that change is happening is hard to see. The crisis stated by all this refers to the hockey puc being a precident in history, and the world will now be ending shortly by a runaway cycle. The train barreling down on a next generations child was the fearsome icon. But the world has experienced this before. That meteor 66 millions years ago ( killed dinosaurs and 3- of every 4 living things on earth) lowered the world 5 degrees overnight and darkened the earth completely sunless for 6 years. 30 degree F drop in 6 years, then swinging higher than previous normal and climbing to 2000-2500ppm once the sun returned. It all came back. My point is that, no matter it happening or the source, the world ( the universe ) balances. More co2 increases foliage (detected by Nasa's MOTIS), more transpiration, more moisture in the air, more low clouds with higher albedo. You will find even more paths of balance if you turn your capable eye to the cycling of nature, meaning the inescapable balance of all cycles. It is physically impossible that the balance is not there, I assure you. I am happy to elaborate more if there is interest. Thanks and best, David
- How to inoculate yourself against misinformation
Eclectic at 13:54 PM on 2 July, 2022David-acct @14 , you are making an extraordinary comment.
Firstly, your <"if scientists discover a forcing that is a greater factor than CO2 as a primary driver of warming"> argument is a complete strawman. (Presumably you are talking about the modern rapid "AGW" part of the Holocene . . . i.e. the sole topic of climate controversy during the past half-century.)
A strawman, because no mysterious unknown forcing has shown a niche for its own existence. No evidence has been demonstrated that might point to its possible existence.
Yes, in the past there were suggestions/proposals by Svensmark, Lindzen and others, but all such ideas crashed due to lack of any supporting evidence. But importantly, their "counter-CO2" ideas were not suppressed or censored. Those ideas were examined by scientists, and found to be without validity ~ and they are now in the category of disinformation (their only supporters are crackpots or worse).
The same goes for the continuing purveyors of <"it's all due to natural cycles of ocean currents/ orbits of Jupiter/ etcetera. >" Cycles which are 90% fanciful and 100% unphysical as a causation of [AGW]. These purveyors are desperadoes who a not censored by scientists, but are simply laughed at (or more generally ignored).
David-acct , I should also point out that if a significantly large "unknown" warming forcing were to be discovered, then there would also need to be the discovery of a (simultaneous) unknown cooling forcing (to neatly counteract the modern rise of CO2's forcing). David, I suspect you know in your heart that the chance of such a Double Whammy is infinitesimally small. In other words - you have created a strawman argument. Pigs = flying.
Suppression, stifling, censorship . . . all are fanciful arguments. Let's not waste any more time going down that road.
As to Covid matters : you will need to find another thread to discuss the issue. Unfortunately, you have been extremely vague in your accusations against the CDC. And I strongly suspect you are harboring a hotch-potch of distorted half-truths there ~ but I will wait to see if you can provide any evidence on that other thread. Good luck with it. My initial bet is that you have chosen to be the victim of medical misinformation and/or disiniformation.
Philippe C @7 , I owe you an apology for my slightly ungrammatical misquote "Vive la indifference" @13. It looked better that way for English readers, I thought. You will forgive me I hope, even if the Academie cannot.
- Climate Confusion
peppers at 21:44 PM on 28 June, 2022Love the balance acknowledgements. I dont hear this much yet it covers all of nature. By nature I extend to include the universe. Balance to me is like gravity. It is everywhere and will drop the apple on your head for lunch or speed you to demise when you step off the ledge. Orbits, plantlife, rivers and mineral cycles; even the milky way is in a 350M year orbit around our galaxy group. Balance. Co2 is a close brother of oxygen, and even though we draw up old reserves of that goo, Ox too is captured in the limestone and will require storms and erosion to bring it back up. Ox is in a steady decline for a M years in another cycle. I am watching for Co2 to balance with the 20% increase in foliage (Nasa) since 2000, 5% each last couple years, and the evaporation and cooling and added clouds and albedo this brings. Until once again there is balance, as this author references. There are millions of cycles interacting and the only constant is change and a desire to balance, without regard to one species or intent (see apple and falling above). Earth balanced after the big one (which sequestered the co2 and ox in the calcium and carbon slew), back from 4k ppm co2. If we consider balance, then warmer and erosion and trusting gravity and balance could mean the bigger picture just has us hubristically interjecting ourselves in to something, well, that might be needed later. Involving ourselves in something, not past our understanding, but past our paygrade. Interjections we are too important to get understanding just from an apple or acknowledging we know truly little, and that we can and will fall when we go past the edge.
- 2022 SkS Weekly Climate Change & Global Warming News Roundup #22
Aeyles at 12:10 PM on 7 June, 2022Maybe I have not figured out what off topic means. I was citing the essay above by Zach Budrik. Is that a topic, or do I look in a particular place for the topic? I don't wish to be offensive, but I would like to know if the term eco-fascist has a definition. I am aware of the meaning of Hadley Cell, eutrophication of the oceans, Milankovich Cycles, AMOC, carbon capture, CFCs, IPCC, and many other terms SKS and similar organization use in discussing climate, but eco-fascism is a stumper for me. Labelling is not considered academic discourse, but is certainly a common characteristic of political commentary. Your rules discourage politics, yet it seems to me that Zach's essay reeks of it. How does this fit into SKS' rules for discourse? What am I missing that leads you to erase my comments?
- Why and How to Electrify Everything
Eclectic at 10:01 AM on 11 May, 2022Indeed, Doug Bostrom @9 , it appears the commenter "Iain R" has not been keeping up with advances. In his post @3 , he claims that 'clean' electricity from renewables is an unworkable proposition, owing to the grid becoming "uncontrollable".
Iain R 's opinions are 10 years out of date. The evidence is in the South Australian example [mentioned @5 above] ~ where a big Tesla battery provides millisecond matching of load demand on the electricity grid, along with frequency control. All this is very desirable for electricity generators. And that ability, combined with grid market arbitraging, has made the S.A. Tesla big battery so profitable for the company owning it, that it has quickly paid off the battery's capital cost. And the company has even recently enlarged the battery by 50% .
It is a marvel how obsolete ideas can linger on.
(B) Slightly off-topic, Doug, but could you comment on how your car's (lithium?) battery battery is doing so well. Is this despite you "abusing" it with rapid recharges and lots of regenerative braking? . . . or are you babying it: with trickle charges, gentle accelerations, 20-80% charge cycles, and suchlike?
- CO2 lags temperature
Pepper at 11:25 AM on 5 April, 2022The time lag between CO2 and temperature is due to the time offset between warming oceans and continued ocean CO2 emissions. with this cumulative effect Carbon dioxide, therefore it will becomes the main driver of temperature during glacial and interglacial warming. Shakun et al 2012 paper showed that warming was indeed triggered by the Milankovitch cycles and that a small amount of orbital cycle-caused warming eventually triggered the CO2 release, which caused most of the glacial-interglacial warming. So while CO2 did lag behind a small initial temperature change, it led and was the primary driver behind most of the glacial-interglacial warming. According to the Shakun data, approximately 7% of the overall glacial-interglacial global temperature increase occurred before the CO2 rise, whereas 93% of the global warming followed the CO2 increase.
- Addressing the Climate Crisis:
Evolution orRevolution1
wilddouglascounty at 02:04 AM on 9 March, 2022Congratulations! And by waiting 25 years, you have a clearer picture of what you're going to need now and will be employing people with jobs that are needed to make whatever transition we can muster. If I can suggest some "reconnecting" strategies to your new abode, it would be to follow the slope of your yard to the nearest creek, then introduce yourself to your local watershed basin, creating green corridors whenever possible to link up your land with native habitat, and learn the local cycles and nurture them whenever possible. They are already changing but if you don't know what they are, you won't be able to help nurture them through the inevitable additional changes ahead. And it's a two way street: the life in the land will help those who are listening and helping the land to survive those changes.
It's not too late to continue the fight, it's not too late to help the planet adapt to the changes ahead, and by doing so, we might learn enough to save ourselves. We humans think with a laser-like focus, but when we start paying attention to the rest of the fabric of life that clothes our planet, our task gets easier. It's easier to light a room by opening the drapes rather than trying to make things out with a laser.
- Addressing the Climate Crisis:
Evolution orRevolution1
wilddouglascounty at 01:07 AM on 9 March, 2022So we get back to this situation: where is the evidence that it is not too late, and what real alternatives exist to the "spilling people's drinks" as the only criteria we are capable of implementing as individuals, as businesses, as governments, as a species?
I fail to see anything in this discussion that reaches beyond this, which you probably agree with. The primary dynamic driving reduced population grown seems to be by increasing consumption, unfortunately, and knocking off the rich seems pretty unlikely since they are the drivers of misinformation in our global culture, let alone the beneficiaries of consumption, so not sure how that will work.
Don't get me wrong: I firmly believe that we should do everything we can to implement a degrowth strategy: increase the cost of carbon emissions, get renewables to replace fossil fuels, not just compete with them, reduce consumption patterns, elect politicians committed to implementing policies that will increase the pace of the shift, and so on, but from what I can tell, we will be fortunate to just get better at spilling drinks, not slamming on the breaks.
I have spent most of my life promoting sustainable lifestyles, and think that one of the best things folks can do is to look at an even bigger picture: learn as much as they can about the local seasons and cycles of life in the ecosystems they are a part of in order to nurture its health and enable it to survive the bottleneck we are all going through. Aware or not, we are dependent at the capillary level of existence to these parts of our landscape, and if we focused on meeting our needs more by nurturing that relationship, we can actually live more fullfilling lives, reduce our consumption patterns, reduce GGE, and be a significant part of something greater than ourselves in a very visceral, non-abstract way. Reconnecting ourselves and our homes to the planet seems like a silly thing to suggest, but nothing will work in the long run if this isn't part of the equation.
- 2022 SkS Weekly Climate Change & Global Warming News Roundup #7
Philippe Chantreau at 09:37 AM on 27 February, 2022The "article in point" claims this: "In fact, the
climate sensitivity to a doubling of CO2 from 400ppm to
800ppm is calculated to be 0.45 Kelvin."
However, there has already been over 1 degree of temperature increase compared to pre-industrial, with the concentration going from 290 ppm to 400 ppm and we are nowhere near equilibrium for 400, which would take some time.
I did not see in the paper a competing explanation for the measured increase. I also did not see why exactly they believe that all the rest of the litterature that concludes the equilibrium sensitivity for a doubling of pre-industrial concentration is around 3 degrees is wrong.
The argument against feedbacks is not very detailed and amounts to little more than hand-waving. It flies in the face of an extensive body of research into the glacial/interglacial transitions associated with Milankovitch cycles.
At first glance, I am not very impressed. Hopefully, more qualified commenters will look into it. I am also not sure about the publication where this piece appeared.
- SkS Analogy 1 - Speed Kills: How fast can we slow down?
Eclectic at 19:18 PM on 20 February, 2022Santalives @62 , since you mention me, I'll give my 2 cents, too.
The Y2K threat, as an analogy? Love it. Very droll of you.
But no real parallel, at all. And so poster John Mason @61 will still be waiting to see if you express your actual emotional motivation for you doubting the laws of physics. Will Newton's famous apple fall downward, or upward? Gosh, what a problem to solve.
Let me stand back and look at the overall problem. You, as an intelligent inquirer about climate . . . you have of course learnt about the 100,000-year Milankovitch cycles of warming/cooling of this planet. So you know that things have been gradually cooling ( around 0.7 degreesC over 4000 years, until about 1850 A.D. ) . . . which would naturally lead to a new "Ice Age" setting in around 16,000 - 20,000 years in the future.
Except now ~ for the past 170-ish years ~ the planet's temperature has reversed direction, is now going upward a at a rapid rate of knots (geologically speaking). The ocean is warming; the sea level is rising; and the planetary ice is melting rather than increasing.
In fact, the surface temperature is about 1.1 degreesC hotter than the mid-1800's (and it's slightly hotter than the plateau peak of the Holocene era, 5-10.000 years ago ~ according to the expert scientists who study past temperatures).
And the temperature is still rising rapidly ~ because physics. You know ~ Newton, Maxwell, Einstein . . . them guys. So the climate scientists of the past 100 years have predicted it would get warmer, and it's very clearly been getting warmer . . . and is continuing to do so. (Sorry Santalives ~ there's no contradictory observations there ~ and the ice and oceans don't lie to us.)
Climate predictions accurate enough for practical purposes? Check! World continuing to get warmer? Check! Scientists understand the reasons causing it? Check!
Sorry Santalives, but you've struck out: Three Times. And your batting average is still zero. Next innings better, perhaps? Seems unlikely, going on track record.
If you want a stretched analogy, Santalives (but not as stretched as your Y2K analogy) . . . then think about that old joke of the guy who fell off the top of the Empire State Building. Yeah, he was an optimist, saying:- 32 floors and okay so far . . . 45 floors and okay so far . . . 62 floors and okay so far . . .
For me, Santalives, I'm not such an optimist as you are. You, as a skeptic (aka science-denier) want to wait for the clear-cut splat onto the pavement. Me, I go with the scientific evidence, and vote for pulling the ripcord on the parachute [yeah, I know, that wasn't in the original joke . . . but you know what I am alluding to] .
In tally : climate predictions ~ Scientists 1 , Santalives 0 .
And real world observations ~ Scientists 1 , Santalives 0 .
Next innings please.
And a pleasure to talk with you, Santalives. Entertaining !
- From the eMail Bag: the Beer-Lambert Law and CO2 Concentrations
Eclectic at 08:55 AM on 2 January, 2022Thank you, Bob Loblaw @11
CD = Climate Detective . . . well now, who da thunk ;-)
But it is now more than 24 hours since the presumed bloggy author has posted here at SkS. Likely he has sailed away . . . or quite possibly sunk (considering how you delivered some heavy hits below his waterline).
To save SkS readers from wasting their time on the Climate Detective's blogsite, I will give a quick thumbnail sketch of the blog's contents. The author's blog contents range from: some technically correct stuff . . . to some definitely incorrect stuff . . . through to some quite bizarre stuff.
Much of the author's content has a mildly Wattsupian flavor . . . such as the cherrypicking of temperature charts for times and regions which are intended to demonstrate the wrongness of mainstream climate science & of all the national scientific bodies. That sort of thing ~ rather Wattsupian, but with a soft-pedal on the International Conspiracy Theories.
Then there was a slightly political take on the recent International Climate Conference in the UK ~ and the disastrous immorality of cutting out the consumption of petroleum oil. # "we [the rich West] will devastate the economies of many [Third World] oil producers." (Such callous disregard . . . cataclysmic impact . . . etcetera.) But # "alternative strategy . . . getting the producers to cut supply by 5% per year . . . result . . . global economic collapse."
~ An interesting demonstration of Motivated Reasoning. Binary thinking - only two future possibilities in that direction: Catastrophe A or Catastrophe B . Third or fourth possibilities are not conceivable. (Such is the effect of emotional bias on the intelligent mind - and there is no doubt that the author has an above-average I.Q. )
Elsewhere, the author raises the flag of Chaos, and becomes almost mystical: "[the AGW] that climate scientists think they are measuring is probably all just low frequency noise resulting from the random fluctuations of a chaotic non-linear system." And more: "this is because the fluctuations are actually the result of dynamic effects that played out long ago but which are only now becoming visible." (Not even the good Dr J. Curry rises to such elevation of the Butterfly Effect.)
And more (after plotting certain noisy graphs) ~ With a grand sweep of a mathematical wand, the author abolishes the multi-millennial swing from glaciation to deglaciation; abolishes Milanovitch cycles; abolishes solar variability . . . CO2 variations . . . volcanic aerosols . . . etcetera.
Apparently it is all a result of chaos mathematics and fractal geometry and self-similarity in nature. By this time, the author has disappeared down a fractal rabbit hole, into his own microcosmic concepts. He has failed to recognize that his ideas are unphysical.
- From the eMail Bag: the Beer-Lambert Law and CO2 Concentrations
Bob Loblaw at 01:57 AM on 28 December, 2021Charlie Brown:
Yes, your discussion touches on some of “the complexity of radiation transfer in the atmosphere” that I dismissed in a single paragraph at the end of the blog post. The blog post was only intended as a counter to the “CO2 exists in small concentrations” misinterpretation of the Beer-Lambert law, and leaves a whole host of other fundamental principles in atmospheric radiation transfer to the imagination of the reader.
You refer to several issues that deserve more discussion – issues that take entire university courses or textbooks to cover. You mention at least four specifics I’d like to elaborate on:
- re-emission of IR radiation
- the three-dimensional aspect of the atmosphere
- the vertical structure of the atmosphere
- the concept of “saturation”
With regard to re-emission, the amount of IR radiation leaving the cylinder is the sum of what was transmitted through the cylinder plus the amount that was emitted within the cylinder (and manages to leave before being re-absorbed within the cylinder). With regard to the emitted IR:
- Any CO2 that absorbs energy will lose it by collision with other molecules, so chances are that it will be a different gas that is emitting, which means it might be at a different wavelength. Thus, to look at the whole situation we need to consider all the greenhouse gases in combination.
- The emissions of IR radiation will depend on the temperature of the gases within the cylinder, which will depend on the balance of all energy fluxes, not just radiation.
- Just as adding CO2 increases the absorbance within the cylinder, adding CO2 increases the overall emissivity within the cylinder, so more IR can be emitted at the same temperature.
- The emission of IR happens in all directions, as you state, which means that only half of the emitted radiation can be said to be continuing in the same direction as any IR radiation that entered the cylinder (figure 4).
You mention IR lost through the side walls of the cylinder. There is also IR gained through the side walls, coming from adjacent cylinders that are behaving the same way as the one in figure 4. If the adjacent cylinders are identical, then each cylinder will be gaining and losing identical IR radiation amounts through the sides, so the net effect is zero.
Can we say the same things about the IR transfers between cylinders in the vertical stack of cylinders (figure 4b)? No, and there is a very important reason why. The net effect between adjacent cylinders (side by side, or top over bottom) depends on the temperature within each. If the temperatures are equal, the net IR transfer effect will be zero – but if they are not equal, there will be a net transfer from the warmer one to the cooler one. In the horizontal direction, temperature gradients are very small, so it is reasonable to ignore that direction. Vertically ,however, we see strong temperature gradients – the environmental lapse rate averages 6.5 C°/km. So, the top cylinder tends to be colder than the bottom cylinder, and the net IR transfer is upward.
So, we get to think in terms of up/down fluxes of IR radiation, and need to consider the thermal stratification of the atmosphere, as you mention. The up/down aspect has a formal label: the two-stream approximation. The extension of the use of the Beer-Lambert Law to include the emissions of IR radiation and the net IR flux along a temperature gradient also has formal solutions, one of which is called Schwarzschild’s equation.
Of course, the vertical temperature structure of the atmosphere is not purely due to radiation, so we can’t model it purely using radiation theory. Weather and climate models need to include convection, etc. - anything that transfers energy.
We also can’t leave the 3-d atmosphere discussion without mentioning clouds. Although gases in the atmosphere have absorption/emission characteristics that are highly dependent on wavelength, clouds (either as liquid or solid/ice) are essentially black bodies. In the same way that the two-stream approximation treats radiation transfer as either up or down, we can begin to cover cloud effects by dividing the atmosphere into a clear sky portion and a cloudy portion. Clouds have layers, too, and three-dimensional characteristics of clouds become quite complex, but the clear/cloudy categorization is place to start.
Lastly, you discuss saturation. I tend to dislike the use of that term, because it seems to mean so many different things to different people. One of the issues not mentioned in the blog post is pressure broadening, where overall increases in atmospheric pressure reduce the absorbance coefficient of the greenhouse gases such as CO2. This leads to a “law of diminishing returns” as CO2 concentrations increase, but we are far from running out of space on that one.
You use “saturation” in the context of IR radiation leaving the surface and escaping to space – and point out that nearly all the IR escaping to space is lost from the upper atmosphere. This is correct, and one way of looking at this is to ask “how many times will IR emitted from the surface be absorbed and re-emitted before the energy reaches the upper atmosphere and can finally be lost to space?” Even now, the probability that surface-emitted IR escapes directly to space is very small – but if adding CO2 increases the number of absorb/re-emit cycles from two to four, to eight to sixteen, etc., there is a reduction in the efficiency of transfer of energy from the surface to space.
For each absorb/emit cycle, only half gets emitted upwards. The half that emits downwards must go through at least one more absorb/emit cycle to get moving upwards again – and it only has a 50% chance that the next absorb/emit cycle will get it going in that direction. If it emits downward again, then it needs another absorb/emit cycle – with only a 50% chance again that it will emit in the upward direction. Adding more and more CO2 will always increase the number of absorb/emit cycles involved, but there is a law of diminishing returns here, too, which leads to the closing paragraph of yours where doubling CO2 from 200 to 400, or 400 to 800 ppm will have the same warming effect. Remember that convection is involved in that warming response, too – as radiation transfer becomes less efficient, convection takes a more dominant role (and it is already important).
- Is Nuclear Energy the Answer?
sekwisniewski at 04:59 AM on 27 December, 2021The following paper provides a comprehensive assessment of the environmental footprint of the French nuclear power generation around 2010. Specifically, it compares the material throughput of once-through (UOX) and twice-through (UOX+MOX) fuel supplies. For example, it finds that both fuel supplies generate around 1.5 m3/TWhe of HLW+ILW-LL that requires geologic disposal, but twice-through requires 3.5 times less geologic storage volume due to a smaller proportion of HLW/ILW-LL. In terms of emissions there is almost no difference - 5.29 vs 5.45 gCO2eq/kWhe for twice-through and once-through, respectively. (If I’m not mistaken, this paper hasn’t appeared in this long discussion yet.)


- CO2 lags temperature
Yoski at 22:51 PM on 12 November, 2021article: CO2 lags temperature - what does it mean? LINK
"This positive feedback is necessary to trigger the shifts between glacials and interglacials as the effect of orbital changes is too weak to cause such variation.
...
While the orbital cycles triggered the initial warming, overall, more than 90% of the glacial-interglacial warming occured after that atmospheric CO2 increase"
Summary:
- Orbital changes alone are too weak to cause such variation.
- 90% of the glacial-interglacial warming occured after that atmospheric CO2 increase
Question: What caused the cooling? Certainly not orbital changes, since they are too weak as pointed out above.
With CO2 causing 90% of the warming and, at the end of the warming trend the atmosphere having very elevated levels of CO2, we should have a runaway warming trend that is unstoppable, but clearly that was not the case as the next ice age approached.
There seems to be a serious logical flaw in the argumentation of that article. - Supreme Court to weigh EPA authority to regulate greenhouse pollutants
swampfoxh at 20:37 PM on 11 November, 2021Further, a 3 to 5 centigrade increase in average surface temperature will probably extinctify much, if not most of the human race. This would be a good thing since "anthropogenic" is the sole cause of short to medium term climate change (Milankovich Cycles ignored). A mass human extinction event would "save" the planet because it would save the plant and animal organisms that seem to have helped make the Earth livable in the first place. When one looks back some 8,000 years, it's clear that only humans have fostered the slow changes that have brought the planet to its "boiling" point. Even until the dawn of the 19th Century, the Anthropogenesees harmed the planet very little. But now, reckless indifference has wrought...so technology and courts will not save us.
- It's albedo
Bob Loblaw at 11:49 AM on 11 September, 2021coolmaster @ 82:
Congratulations. Another comments policy violation. You can't find anything using Google? Maybe if you look at the Skeptical Science Team page, you will find some clues about my background and why your Google search failed.
It is amusing that you complain about a lack of links or references, when you still have yet to provide a reference for your claim that local surface evaporation will lead to a 1% increase in cloud cover. Just in case you have forgetten it, here is your original claim again:
This volume can be retained by a wide variety of measures before it flows into the oceans and converted into evaporation. - 9L / m² corresponds to ~ 1% of the average annual rainfall over land and should therefore create ~ 1% additional clouds over the land mass.
You repeat a diagram previously linked to. Let's us try to find the evidence we seek in that diagram.
- Cloud cover data? Yes, for three types (high, middle, and low).
- Clear annual cycles, especially for middle and low.
- Global total cloud cover? We don't see sums, but it is obvious that the low and middle cloud amounts are counter-cyclical... when one goes up, the other goes down. Less variation in high cloud. Could it be possible that these cloud types are responding differently to whatever the seasonal cycles are? Maybe there are changes in geographical distribution? Maybe differences between land and sea?
- Trends over time? Yes, And different trends for different cloud types.
Oh, there is that pesky cloud type issue again. Maybe it's actually important?
Now, let's look for evaporation data, so we can finally verify the elusive "1% increase in evaporation causes 1% increase in clouds" story.
Hmmm. I'm looking hard, but I don't see it.
- I see "atmospheric water". Is that "evaporation"? I don't think so. I seem to remember that "evaporation" is a flux from the surface to the atmosphere, not the storage in the atmophere.
- Are we looking at a system where increased evaporation is actually causing these cloud changes? I see no evidence of that.
- Oh, wait. Coolmaster has pointed out that this graph shows "...clouds feedback during the last decades triggered by a warming atmosphere..." My mistake - I thought you were trying to show data that supported your grand theory.
This is typical of what coolmaster has produced here: links to papers or diagrams, with no explanation as to how they are supposed to support his argument, leaving the reader to try to examine the paper or diagram in search of something only coolmaster sees. There is no "there" there.
You seem to like the IPCC reports. Since you appear to have a copy of AR6, I'll skip linking to it. Maybe it has something to say about your grand theory that irrigation can increase evaporation and cool the planet.
[search]
[search]
Oh, maybe this is it!
Section 7.3.4.1 Land use.
It mostly covers albedo changes for land, but the second last paragraph says: "The contribution of irrigation (mainly to low cloud amount) is assessed as –0.05 [–0.1 to 0.05] W m -2 for the historical period (Sherwood et al., 2018)."
Hmmm. With those error bars, it's hard to tell if the effect is positive or negative. It's also the total effect attributable to all the increases in irrigated land over the historical period. If the -0.05 number is correct, would there be a linear response to more irrigated land, so that 100x the historical area would lead to -5W/m2 and offset the CO2 forcing? How much water is used each year for current irrigated land?
That might give coolmaster a glimmer of hope. Why has he not presented this information before? Maybe the more detailed results in the reference the IPCC uses do not support coolmaster's grand theory? Maybe he just doesn't know what to look for?
Maybe coolmaster will eventually provide us with the evidence we need, but I won't hold my breath.
- Is Western U.S. experiencing a ‘megadrought’?
swampfoxh at 16:25 PM on 19 August, 2021A shorcut to understanding Western drought cycles can be found in William DeButs book "A Great Aridness", Oxford U., 2011. I think he reminds us that those cycles have been repeating about every 1,000 years since the end of the last ice age. The last "bad one" was around 1050 CE
- It's albedo
Bob Loblaw at 02:35 AM on 15 August, 2021Also in response to blaisct's comment #66 posted over on the Urban Heat Island discussion.
Blaisct:
You continue to make poor choices in the numbers and calculations that you are doing. Going over your latest effort by number:
1. You continue to select an albedo for urban areas that is too low for anthropogenic surfaces, and you have failed to cite a reference for your value. In my comment # 64 on the Urban Heat Island discussion, I gave a reference to several artificial surface materials, all with albedo values that exceed the the value you have chosen. "Urban" areas are a mix of things like grass, roads, houses, etc. You would need to calculate how much of the surface is covered by each type, and work out an albedo for an "urban" area that way. If that is what you have done, you need to show your detailed calcuations on how you arrive at the 0.08 value.
2. There are no assumptions in the 0.31 albedo value for the earth as a whole. That is based on satellite measurements, and includes reflection from the surface, clouds, clear atmosphere, etc. Note that the only part of the surface reflection that reaches space is the part that makes it back out through the atmosphere and cloud cover. To calculate this in a model (which is what you are trying to do), you need to account for spatial variations (and daily/seasonal cycles) of solar input, surface albedo, cloud cover, and atmospheric conditions.
3 to 14. You continue to make unreasonable assumptions about the area that is undergoing a surface change, and how it relates to population. There is no reason to think that they are related through a simple proportion.
15 to 20. You continue to make errors in converting solar output (1367 W/m^2 measured perpendicular to the sun's rays) to an areal average over the surface of the earth. As MIchael Sweet points out, there is a factor of 4 involved, not a factor of 2. I also mentioned this in my earlier comment. If you do not understand why this is the case, then it is difficult to see how you can expect to do any useful calculations. You also need to consider seasonal variations in solar radiation distribution and seasonal albedo.
21. Converting radiative forcing to global temperature change involves looking at the top-of-atmosphere changes (what is seen from space), not surface changes alone. To properly incorporate surface changes into a calcuation, you need to use a much more complicated model of climate response to surface albedo changes.
22. You still get a wildy incorrect answer, due to bad data input and bad assumptions.
I have not bothered to follow the link to the Mark Healey document you mention. If that is the source you are getting your incorrect ideas from, then it is not worth bothering. The result you quote (that albedo changes can account for all the obsvered temperature rise) is completely inconsistent with the science.
Over at RealClimate, they have recent posted several articles on the just-released IPCC reports. One of those summarizes 6 key results. In that post, they provide the following graph from the IPCC report, which shows the estimated temperature response due to a variety of factors over the last 100 to 150 years. "Land use reflection and irrigation" is the second-last bar on the right. Note that the calculated effect is minor cooling, not warming.

Michael Sweet's suggestion to read the IPCC reports is a good one. I often suggest that people start with the first 1990 report, as this covers a lot of the basic climate science principles in a manner that is easier to understand for the non-expert. In the 1990 report, they mention the Sagan et al paper I linked to in my first comment. Google Scholar can probably help you fnd a free copy.
https://science.sciencemag.org/content/206/4425/1363.abstract
- CO2 effect is saturated
Bob Loblaw at 23:41 PM on 25 July, 2021Yet another aspect of Ingrahammark7's failure is to only think in terms of the radiation that starts its upward travel at the surface and ends its travel at the top of the atmosphere, in one single passage.
In reality, IR radiation emitted at the surface will undergo several absorption/re-emission cycles, and increasing CO2 will shorten the distance for each cycle - which means more cycles. Each re-emission also sends some energy back down (well, half), which further reduces the efficiency. Even if one sees very little difference at the end (direct IR transmission to space, after surface emission), there is a lot fo difference in the middle. And given that the entire atmospheric profile plays a role, along with other energy transfers such as convection, what happens in the middle is important.
As Phillippe points out, Ingrahammark7's comments are yet another case of reinventing the flat tire. I pointed out the problems of this particular flat tire in comment #529. In that comment, I provided the followiing diagram showing the intermediate effects on IR transmission of decreased atmospheric transparency.

Even though both transmission coefficients result it essentially nothing making it through 200 layers, the differences in the first 100 are obvious.
There's that "obvious" word, yet again...
- Exxon's Own Research Confirmed Fossil Fuels' Role in Global Warming Decades Ago
Philippe Chantreau at 03:42 AM on 16 July, 2021And an opinion piece from Newsweek resulting from the unintentional disclosure I linked above:
The underlying reality is unescapable and very simple: there is no long term future for humans on this planet that includes continued, industrial scale use of fossil fuels. Everyone knows it. The ones profiting from it just want to make sure they extract every last little penny before they are forced to change.
I don't say this lightly. I come from a culture that values speed and skill at handling machines powered by fossil fuels. When I was growing up, the coolest thing one could do was riding motorcycles, doing Rallye racing or flying airplanes. I am a pilot, flight instructor, love to fly and I still love to ride motorcycles. However, reality does not change according to our preferences, despite what some would have the crowds believe.
- Additional Fact Briefs published on Repustar
Bob Loblaw at 02:05 AM on 15 July, 2021Until the link MAR mentions is fixed in the blog post, you can follow this one:
It looks like the orignal has an echo. It looks like the orignal has an echo.
- Additional Fact Briefs published on Repustar
MA Rodger at 00:40 AM on 15 July, 2021The link to Do natural climate cycles disprove that modern global warming is caused by humans? ... read more needs editing.
- Climate's changed before
Eclectic at 17:35 PM on 13 July, 2021TVC15 , from experience, you know how anything & everything is grist for the deniers' mill, in their attempts to minimize and/or deny the climate science. It's always ABCD ~ Anything But Carbon Dioxide.
And their excuses come in cycles of excuse ~ first: It's Not Warming . . . then: It's only warming a bit . . . then: Yes, it's warming a lot, but it's Not caused by humans . . . then: Well yes it's half-caused by humans, but the Warming is really very very good for us and is saving us from disastrous cooling.
Then it's back to: the Warming has Stopped and it's cooling now (for at least 6 years' cooling, says the deluded Monckton) . . . and a Colossal Grand Solar Minimum will have all of Canada under a mile-thick ice sheet by 2050 or somesuch date.
For millennia, the US Southwest has been arid - the opposite of the Northeast. And you can find other regions of the world likewise arid. All it needs is a slight variation in climate, and you've got a mega-drought (a drought defined as >20 years) or a super-mega-drought (for centuries). Nothing very new about that ~ except that now our Anthropogenic global warming is exacerbating the droughty tendency. (The exacerbation being the point your denier wishes to deny.)
I haven't studied past Interglacials w.r.t. aridity & droughts. Presumably similar overall conditions in the past have caused rather similar episodes. But that's all rather irrelevant to the current situation, which must be dealt with on its own terms. And the current droughty tendency doesn't disprove the climate science, nor does it fail to point to more of the same trouble in future, as AGW worsens.
Of course, as we look back in time, the proxy evidence (in past Interglacials) gets fuzzier & fuzzier ~ so conclusions of any sort get more difficult to make.
The "Anthropocene" is a semi-humorous label. Not official. But the label does get up the deniers' noses. Still, it does rhetorically emphasize that the Holocene is transitioning into something significantly different from the "natural".
- Climate's changed before
TVC15 at 16:07 PM on 13 July, 2021Eclectic @874, 875
Hi Electric,
Thanks for the responses!
I don’t understand why this denier is trying to make it a fact that the Western half of the US always undergoes a drought during Inter-Glacial Periods when I don’t think we really know, or do we?
They mention the other 11 interglacial periods, during which modern humans did not exist until the Holocene. I’ve also head a new epoch called the Anthropocene, with the start date of this new epoch still in debate. Not sure if this is recognized as the most current epoch.
Since humans did not occupy most of those interglacial cycles, I don’t understand the deniers argument. There is nothing to connect the dots between past interglacials and our current situation.
Now instead of saying climate always changes, deniers are claiming that what we are witnessing all over the globe today is typical during an interglacial cycle.
How can we know the conditions of ancient interglacials? Did they all cause drought in the Western half of the US?
Thanks!
- Climate's changed before
Bob Loblaw at 11:17 AM on 13 July, 2021TVC15.
Your interlocutor seems to be using a combination of "Climate has changed before" (this thread) and "we're coming out of an ice age", which is an odd twist on "we're going into an ice age". Maybe he's confused with "we're coming out of the Little Ice Age".
There is a post here at SkS that talks about sea level over the past 150,000 years. It includes the following graph of sea level, covering the last glaclal/interglacial cycle:

I do not see anything on that graph to support his claim that sea level is normally 4 to 14m higher than now during interglacials. The peaks of that graph may be a touch higher, but there sure isn't a steady period of higher sea levels in the last interglacial. I suspect his claim is completely bogus, but you could always try to get him to provide his source of data.
On very long time periods, ocean basin size/shape changes have dramatic effects on relative sea level. On short time scales (glacial/interglacial cycles), local sea level in areas subject to the weight of ice have serous effects due to isostatic depression and rebound.
Of course, the answer to "why should this interglacial be different?" is "because we're adding CO2 to higher levels than seen in hundreds of thousands of years, and we're looking at rising temperatures and conditions not seen in past interglacials".
- The New Climate War by Michael E. Mann - our reviews
Philippe Chantreau at 04:15 AM on 9 June, 2021Of course Nick, they do.
However, I'm sure that I don't have to remind you of the infinite ability of humans to rationalize any decision they make. It is entirely possible that these executives feel that their children will be shielded from adverse consequences because their parents have amassed a little fortune, which can afford one a lot of protection against a degrading world. It is possible that they find that to be enough.
It is entirely possible that they estimated that every parent should do what they can to protect their own children and that if they fail, it's their fault, regardless of the obstacles these parents face.
It is entirely possible that they have convinced themselves that it's natural cycles, or this, or that, and they sincerely believe it to be the case. Executives are good at finance and the human relations of power games, but they can very well suck at judging scientific information.
It is entirely possible also that they made a risk/cost/benefit analysis that, somehow, placed profits at the top of the priority scale. Stranger things have happened. Look at the opiates crisis.
It is possible that these executive have absolutely zero notion about ecosystem services, treshold events in biodiversity and all sorts of concepts that belong in areas of studies and activity other than the ones where they operate. Even if they do hear about, they will be much more likely to dismiss such seemingly "abstract" concepts in the face of hard financial targets.
Anything is possible, we'll never know because we are not in their heads. What we do know is what Exxon's own research showed in the early 80s, and the direction the company took in the late 80s and 90s, SkS has actually looked at that:
https://skepticalscience.com/1982-exxon-accurate-prediction.html
One is free to draw any conclusion about the executives' motivations or thoght processes from the company's actions. I agree that it is indeed of little usefulness to do so. Fighting the disinformation put forth by the actors they supported and still support to this day is more useful. It does fit into that effort, however, to point attention toward the extreme dissonance between the serious research done by the company and the crackpottery they decided to promote instead, and continued to promote even after it failed to be confirmed by all the rest of the scientific litterature.
- The New Climate War by Michael E. Mann - our reviews
nigelj at 17:54 PM on 8 June, 2021Nick Palmer @9 wow reading your comments was a bit like looking in a mirror. I am also towards the political centre and I have an eclectic mix of views. I think this is because I'm an individualist and not a group orintated sort of person. Not saying this is necessarily a superior thing but its how I'm built. Most people appear more group orientated and tribal (that dreadful word) and very reluctant to adopt any idea coming from the "other side". This is hard to change, and is probably why politics has cycles of progressive and conservative governments.
I agree both sides of the climate debate misbehave. I've been labelled a luke warmer for suggesting some warmists get utterly carried away and feed the denialists or have confirmation bias etc. Its tough going taking a contrary view to your "group". However its important to avoid false equivalence. The denialists are clearly the worst offenders. Don't loose touch of that.
- SkS Analogy 22 - Energy SeaSaw: Part II
Bob Loblaw at 05:59 AM on 30 May, 2021Good post, Evan.
The idea that a complex variation (in this case, temperature versus time) is the sum of components of predictable simple variations is fundamental to science and statistical analysis. A very useful technique.
In this case, you have used a linear trend versus time, summed with a sinusoidal variation over time, and it is clear from figure 3 that this simple variation of two types can closely match observations.
There are still squiggles left, and these could be "matched" by adding more cycles. You don't want to go to far without some physical reasons to expect cycles at different intervals, though.
Although it is purely curve-fitting, you can do a sine that repeats once in the time period, then add a sine that repeats twice in the time period, then a sine that repeats three times, then four, then five, etc. Keep adding cycles, and you can match a very complex set of observations.
Sound odd? No, it's called a Fourier series, and by comparing the amplitude of all those cycles you can use it to identify the important frequencies/periods of repeating patterns in your data.
Overuse it, and you can always say "it's cycles". Read How Curve-fitting can ignore physics. A common thread in the Anything But CO2 crowd is to fit cycles and claim you don't need CO2 to explain recent global temperature trends. (Spoiler alert: they are wrong.)
Where else do we see this? Ptolemy's geocentric model of planetary motion used cycles this way. But it wasn't based in physics, just math. A better model - simpler, and more in tune with our knowledge of the physics - is the Heliocentric model.
Cyckes are a very useful tool for exploring data, and helping us see what is there. Physics is an even more useful tool for explaining data, helping us understand why it is there. A good scientist uses it all.
- 2021 SkS Weekly Climate Change & Global Warming News Roundup #19
Eclectic at 00:34 AM on 12 May, 2021Jim Hunt @12 :-
Well congratulations and bravo, Jim, for your multiple comments in the Judith Curry blog (Post titled: Climate book shelf , on 10 May 2021).
Your droll ironies were entertaining/enjoyable. Such as: "It seems safe to assume that Dr. Koonin has heard of NASA ... [which is mentioned] once in the body of the book."
Meanwhile the "opposition" [the usual suspects] were parading themselves in typical form. Such as Turbulent Eddie's face-palming fatuosity about arctic maxima/minima. Others were in good form too ~ one stating the certainty of massive cooling due in the coming century or two. While another stated that the present arctic warming was, yes, caused by humans . . . but even in the absence of humans, the same amount of warming would have occurred in a few decades' time anyway! Others were deeply into "cycles" explaining all climate variation . . . yet they never seem to understand that there must be an underlying physical cause of every variation (cyclic or otherwise).
In some ways, Curry's blog "ClimateEtc" is more fun than the proverbial barrel of monkeys. But it is partly rescued by sane contributions from JH, Willard, and the very deft Joshua, plus some (erratic) others.
Curry herself (and likewise Koonin, who uses a partly similar style) is like a magician making a stage presentation. Rhetorical vagueness and obfuscation, like smoke and mirrors. All designed to keep the audience's attention away from the physical realities.
Yet overall so far, the deniosphere's response to the Koonin book is somewhat more muted than I expected.
- Is Nuclear Energy the Answer?
John ONeill at 16:04 PM on 30 April, 2021'The storage of the Terrapower reactor would only raise output less than 50% for 5 1/2 hours.'
That would be adequate for demand cycles on most grids, where peak power, as a rule, is on the order of 50% higher than base. Remember, it's going from ~ 60% to 150% - at night much of the heat production goes to storage. Solar thermal storage has pioneered the technology, but has nowhere near the capacity factor -even in deserts, in summer - to match the reliability of nuclear.
The BN600 and BN800 in Russia seem to be operating without any leaks or fires - unlike some of the new grid storage battery plants, which, although nowhere near the gigawatt-day scale, or the price point, to be able to power a country through a cloudy, windless spell, are claimed to be ready to rescue part-time power sources from their role as sidekicks to the fossil industry.www.spglobal.com/marketintelligence/en/news-insights/latest-news-headlines/burning-concern-energy-storage-industry-battles-battery-fires-51900636
'If we really try to build out wind and solar there will be a substantial decrease in carbon emissions in a short period of time.' That's something I haven't seen, though I rather obsessively scan www.electricitymap.org/zone/JP-KY?wind=false&solar=false for examples of it. Today, for the first time I've seen, Kyushu got well below 100 grams CO2 per kilowatt hour - but only briefly, at midday. For most of the 24 hours, it was three or four times as much. Areas that have invested mostly in nuclear - or hydro, when available - are routinely well below that mark, 24/7.
www.electricitymap.org/zone/CA-ON?wind=false&solar=false
www.electricitymap.org/zone/FR?wind=false&solar=false
www.electricitymap.org/zone/SE?wind=false&solar=false
( I'd have added Switzerland, but lately they've gone above the 100g/kwh mark most of the time. I'm not sure if it's because they've been closing reactors, or because, like here in New Zealand, they're having a dry hydro year. Either way, it's not a good augury for the country's goal of nuclear free, zero carbon, by 2050. Part of it could also be that they're importing a lot of power from Germany, which dirties their average.)
- 2021 SkS Weekly Climate Change & Global Warming News Roundup #17
Dale H at 15:01 PM on 27 April, 2021RH, Ecelctic, MA Rodger
Thank you for the help on where to look for the best articles on the changes in temperature and causes for the last 2 million years. I have read them a few times as well as other articles on the Milanovitch cycles. I am still digesting all of the learning and supporting documents but it gives me a good start on the earth's movement on climate plus some of the other factors that drive change and will have more questions soon.
It was also very impressive on all of the hard work and thought that has gone into this area and very much appreciate you spending time to help me sort through the numerous studies. As mentioned I have worked in the data and modelling field for 30+ years helping people understand what drives their business and love looking at facts and ideas. You both mention the declining CO2 levels which would lead me to my next question.
Do we have data or hypothesis on temperature and CO2 levels back to the dinosaur timeframe and how the CO2 levels became so high. Also on temperature do we have mid latitude increases because most of the people live in this area?
As mentioned I appreciate any of your wisdom you can share and if anyone else has any articles or ideas in the precurrent timeframe that they believe would be of interest please let me know.
RH I still haven't mastered the pasting of the image to fit into the webpage. Is there somewhere I could learn more about it?
- 2021 SkS Weekly Climate Change & Global Warming News Roundup #17
MA Rodger at 17:49 PM on 26 April, 2021Dale H @3,
Further to #3, the declining CO2 levels over the last few ten-of-million years are usually put down to errision following the Himilayan mountain-building. The Antarctic ice appeared about 35Mya on the cooling planet. On a shorter time-scale, the shutting-off of the oceans between N & S America 3 Mya ago resulted in the appearance of the Arctic ice which has been fuelling ice ages ever since.
The frequency of these ice ages swapped from 40,000yr to 100,000yr roughly 1 Mybp (so your 1.2Mya @1). A mechanism for this transition is not entirely nailed down quite yet (eg see Chalk et al 2017 or Willeit et al 2019). However the usual suspect is the level of dust from exposed land during glacial cycles and its reduction of the ice albedo. So when the lands of northern lattitudes have been scoured clean back to the bedrock, the dust is greatly reduced and thus the albedo of the less-dusty ice caps does not decline so much during high glaciation, allowing ice a longer period before destablising into an interglacial.
- It's planetary movements
MA Rodger at 18:07 PM on 1 April, 2021Likitwarm @7,
The intervening comment provides answer to the direct question you pose.
I think it should be added that this correlation you invoke certainly does not imply any causation. This is not because it is but an instance of coincidental curve-fitting, but simply because there is no correlation.
The measure of Scalar Sum of Angular Momentum which provides one side of the corelation is in the words of its creator "nonsense" while the other side (already a very poor fit for a correlation,) is but one version of the measure and additionally incomplete in its presentation. Note the prediction of the creator of the graphic.
"According to this connection, the current warming rate should slow down a little now, but will grow to local maximum arround year 2040, from which point it should drop to next little ice age arround year 2430 and to next warming arround year 2900."
The "current warming rate" presented runs up to 1979. Has the post-1979 warming rate 'slowed down'? It hasn't. It has done the exact opposite and has been doing so for forty years. Thus the complete presentation of this second side of the correlation results in a very very bad fit.
Then you do tell us @3, "I think I'm in over my head." You apprear to be correct with that statement.
- It's planetary movements
MA Rodger at 03:32 AM on 30 March, 2021Likeitwarm @3,
You appear to be wanting to convert Semi's assertions into something more than they merit.
Semi says that the Scalar Sum of Angular Momentum (which even Semi brands as as "nonsense") "seems to match the climatologic events" and also "roughly correspond to human civilization thriving" (although I would suggest Semi demonstrates a pretty poor grasp of the chronology of "human civilisation").
From that rather weak relational description you are asserting there is a "correlation" (your assertion because Semi does not go so far). And if you examine the data that you assert is correlated (as shown in Semi's Fig 81 on p50), it is far from convincing. And it gets worst. Note the Moberg et at proxy data only reaches to 1979, since when NH temperatures have risen by +1.3ºC. Semi strangely omits the vertical scaling from his graphics, but a quick look at Moberg et al shows his smoothed 2000-year NH proxy reconstruction has a full range of 0ºC down to -0.7ºC meaning if the last 40 years were plotted onto that Fig 81, the NH temperature trace wouldn't just be off the graph, it would be off the page!!
So I would strongly caution you to ignore all ideas of there being something 'matching' or 'corresponding' shown and certainly not any correlating.
- It's planetary movements
Rob Honeycutt at 01:57 AM on 30 March, 2021It's important to note that it's unlikely anyone here will be alive in 2100 to see what transpires after that point. Decisions we make today must be made on what the best available science tells us is likely to happen.
As far as science goes, I wouldn't put much credence on a paper that claims that the modern tech boom is a product of solar cycles.
- It's planetary movements
MA Rodger at 21:19 PM on 29 March, 2021
You link to comment presented in Semi (2009-unpublished) 'Orbital resonance and Solar cycles' specifically p48 which says:-
The "wave" of approximate period of 934* years, which could also probably be anti-correlated with Sun spin rate, seems to match the climatologic events of Medieval optimum and Global warming, and also the Little Ice age of Maunder minimum, and similar periods in earlier ages (fig. 81)...
If this is right, now the Solar activity could drop a little, but will approach a larger maximum arround year 2050, not disturbed by the peak anomally, and then drop to a next little-ice-age arround 2400 AD. The time-lag between the spin rate change and activity change is still uncertain...
The periods of low scalar angular momentum (and higher Solar activity) roughly correspond to human civilization thriving: 1450BC Egypt, 600BC Greece, India and China, 200AD Rome and China, 1200 Medieval optimum (population growth in Europe), 2000AD (present "technical boom"). The periods of high scalar angular momentum (and lower Solar activity) correspond to crisis periods of human civilization.
According to this connection**, the current warming rate should slow down a little now, but will grow to local maximum arround year 2040, from which point it should drop to next little ice age arround year 2430 and to next warming arround year 2900. [**This referring to the paper's Fig 81 which plots the scalar sum of angular momentum of 9 planets and Sun with the climatologic data from Moberg et al (2005) which presents a 200-year NH hockeystick.]
This is all about a "wave" in the Scalar sum of Angular momentum and the page also presents a NOTE saying:-
NOTE: It was remarked, that Scalar sum of Angular momentum is a nonsense, which it is...
I think I would have to agree with this NOTE. Angular momemtum is considered maintained in a closed system and any heat-related effects that may work beyond a close system (the sun loses 130 trillion tons of mass a year through nuclear fusion) wouldn't make a great deal of difference to that, processes which themselves may show variation but again not significantly even if the sun's position relative to the solar-system's barycrentre were a factor (which Semi [2009-unpublished] asserts is when peak Scalar Sum of Angular Momentum occur).
Further to the NOTE, Semi (2009-unpublished) also does not set out this as an overall finding as it is unmentioned in either the abstract or conclusions.
Of course, that does not stop the swivel-eyed denialists. I note one of the two papers referencing Semi (2009-unpublished), Holmes (2018) 'Thermal Enhancement on Planetary Bodies and the Relevance of the Molar Mass Version of the Ideal Gas Law to the Null Hypothesis of Climate Change ' is cites Semi (2009-unpublished) as apparently showing "Yoshimura is in evidence throughout the climate system, and in proxy records, on all time-scales," (Yoshimura [1978] being cited to support a 55-year barcentric solar-system cycle but with zero actual mention of Earthly climate in that paper).
- CO2 is not the only driver of climate
Likeitwarm at 13:42 PM on 29 March, 2021I feel that I am a total neophyte, I have a lot of respect for the understanding of the atmosphere that resides in this forum.
I don't deny the atmosphere has been warming for the past 200 years or so.
In looking around the internet for answers, I recently read about a planetary cycle described by P.A. Semi at http://semi.gurroa.cz/Astro/Orbital_Resonance_and_Solar_Cycles.pdf page 48.
He says this 934 year cycle coincides with the relatively short cycles of climate change, i.e., medieval warm period and medieval cold period(little ice age) and prior.
If this cycle is fact, then the earths climate is warming now from natural processes coming out of the "Little Ice Age" and CO2 may not be the driver of recent warming of .9 deg C of the last 170 years.
I'd love to know what others think of this. - Skeptical Science New Research for Week #9, 2021
Rob Honeycutt at 11:49 AM on 15 March, 2021SunBurst... Your question, I'm assuming, is, "When have we had CO2 levels as high as they are today?"
But that question was followed with the comment saying, "The story I keep hearing from the AGW folks is that current CO2 levels are unprecidented."
So... as MA Rogers just pointed out, the last time we've had CO2 levels this high was >3 mya. No one has ever claimed that current CO2 levels are unprecedented in all of earth's history. Current levels are unprecedented, certainly during the holocene, certainly during the past million years of glacial-interglacial cycles.
If you bother to read Dr Tripati's paper you mention you'd see the abstract states:
The carbon dioxide (CO2) content of the atmosphere has varied cyclically between ~180 and ~280 parts per million by volume over the past 800,000 years, closely coupled with temperature and sea level. For earlier periods in Earth’s history, the partial pressure of CO2 (pCO2) is much less certain, and the relation between pCO2 and climate remains poorly constrained. We use boron/calcium ratios in foraminifera to estimate pCO2 during major climate transitions of the past 20 million years. During the Middle Miocene, when temperatures were ~3° to 6°C warmer and sea level was 25 to 40 meters higher than at present, pCO2 appears to have been similar to modern levels. Decreases in pCO2 were apparently synchronous with major episodes of glacial expansion during the Middle Miocene (~14 to 10 million years ago) and Late Pliocene (~3.3 to 2.4 million years ago).
This is consistent with what everyone exchanging comments with you right now has been stating, as well as being consistent with Al Gore's movie.
My suggestion is that you read both the Tripati paper and the Royer paper I previously posted. Then we can at least start to have a reasonably informed conversation about these issues.
- Skeptical Science New Research for Week #7, 2021
Bob Loblaw at 03:43 AM on 21 February, 2021Jamesh @ 8:
As you seem to be struggling to find appropriate places to discuss stuff, let me try to help you.
First, The the most recent ice sheet to cover New York State would have been the Laurentide Ice Sheet, which covered pretty much all of Canada and the northern US states. It had several distinct and somewhat independent areas of motion, though. "Polar" is probably not a good descriptor for it.
https://en.wikipedia.org/wiki/Laurentide_Ice_Sheet
If you want to argue that it represents evidence that climate has changed before and therefore humans can't be the cause now, then the reasons why that argument are wrong is #1 on the Most Used Climate Myths page "Climate's changed before":
https://skepticalscience.com/climate-change-little-ice-age-medieval-warm-period.htm
If you want to use it to argue that climate scientists were predicting a return to ice age conditions in the 1970s, then the reasons why that argument are wrong is #11 on the Most Used Climate Myths page "Ice Age predicted in the 1970s":
https://skepticalscience.com/ice-age-predictions-in-1970s.htm
If you want to use it to argue that we are now heading into another glacial period, then the reasons why that argument are wrong is #14 on the Most Used Climate Myths page "We're heading into another ice age":
https://skepticalscience.com/heading-into-new-little-ice-age.htm
If you want to use it to argue that the current warming is just a continued pattern from a previous cold period, then the reasons why that argument are wrong is #48 on the Most Used Climate Myths page "We're coming out of the Little Ice Age":
https://skepticalscience.com/coming-out-of-little-ice-age.htm
If you want to use it to argue that climate follows natural cycles and the current warming is no different, then the reasons why that argument are wrong is #56 on the Most Used Climate Myths page "It's a Natural Cycle":
https://skepticalscience.com/global-warming-natural-cycle.htm
If you want to use it to argue that you know of some special factor affecting climate that climate science has ignored, and you are the only one that knows this, then you might want to go to Climate Myth #130 "Climate Skeptics are like Galileo":
https://skepticalscience.com/climate-skeptics-are-like-galileo.htm
If you want to use it to argue that humans can survive large shift in climate, then Climate Myth #197 "Humans survived past climate changes" is your destination:
https://skepticalscience.com/humans-survived-past-climate-changes.htm
- Solar Cycle Model fails to predict the recent warming
Hans Petter Jacobsen at 23:53 PM on 20 February, 2021When I wrote this blog post in December 2012, the temperatures measured so far in solar cycle 24 were much higher than SSH (Jan-Erik Solheim, Kjell Stordahl and Ole Humlum) predicted with their solar cycle model in [1] and [2]. In 2014, I wrote about the failure of their model on a Norwegian discussion forum. Solheim, the lead author of the two articles, participated in the discussion afterwards. He defended his model. He stressed that we have to wait till solar cycle 24 has ended before we can evaluate the model's predictions for that cycle. It ended in November 2019, so now we have the answer. The average temperatures in solar cycle 24 became much higher than SSH predicted with their model.
In [1], SSH predicted that the average temperature on Svalbard in solar cycle 24 would be between 1.5 and 5.5°C colder than it was in solar cycle 23. According to the Norwegian Meteorological Institute, the average temperature at Svalbard Airport Longyearbyen increased by 1.7°C from solar cycle 23 to 24. According to Berkeley Earth, it increased by 1.0°C at a location inland, not far from Longyearbyen.
In [2], SSH predicted that the average temperature in a northern region including Iceland and Norway would drop by at least 1°C from solar cycle 23 to 24. According to Berkeley Earth it rose by 0.3°C on Iceland and by 0.7°C in Norway including Svalbard.
Figure 1 in the blog post shows how the HadCRUT3 temperatures in the Northern Hemisphere fit with the predictions of the solar cycle model. Then solar cycle 24 had just started, and the blue star for solar cycle 24 showed the temperatures measured so far in that cycle. Now the blue star can be replaced with a blue circle showing the average temperature in solar cycle 24. That is done in the Updated Figure 1.

Updated Figure 1: The observed and the predicted mean temperatures in solar cycles up to and including cycle 24.
The original Figure 1 used the HadCRUT3 temperatures in the Northern Hemisphere, just as SSH did in [2]. Met Office has replaced the HadCRUT3 temperatures with the HadCRUT4 temperatures. The Updated Figure 1 therefore uses the the HadCRUT4 temperatures in the Northern Hemisphere.
The Updated Figure 1 shows the same for the northern hemisphere as the examples do for Svalbard, Iceland and Norway. The temperatures in Solar Cycle 24 became much higher than they were in the previous cycle. Not colder as predicted by SSH.
See the blog post Solar Cycle Model failed totally when predicting colder temperatures for more information and more plots.
The lead author Jan-Erik Solheim and his two co-authors are members of the Scientific Advisory Board in an organization run by climate deniers in Norway. Some months ago Solheim wrote on their web site (in Norwegian) that solar cycle 25 has started. He did not mention his failed predictions for solar cycle 24. On the contrary, he wrote about the connection between solar activity and the climate, about the little ice age caused by low solar activity, and that it will be exciting to see if low solar activity in this century will cause a colder climate. He has obviously not learned from his failed predictions for solar cycle 24.
References
1. Solar Activity and Svalbard Temperatures
Jan-Erik Solheim, Kjell Stordahl and Ole Humlum.
2. The long sunspot cycle 23 predicts a significant temperature decrease in cycle 24
Jan-Erik Solheim, Kjell Stordahl and Ole Humlum.
- Why does land warm up faster than the oceans?
Bob Loblaw at 00:08 AM on 9 February, 2021AerosGreen:
Regarding ocean temperature gradients, I think you are missing the aspect that ocean circualtion at depth is also driven by salinity differnces (which cause density differnces)
On an annual basis, land temperature cycles only influence the top 10m or so. The ocean mixed layer depth (mixed by surface winds - ie.. interacting more closely with the atmosphere) is more like 60-100m. So increased heat capacity plus much more volume.
TIme constant for the mixed ocean layer is decades.
For deeper oceans, we're talking hundreds of years for circulation patterns to run their course - so adjustment to surface changes is very slow.
- A Climate Bet Impossible to Lose
Philippe Chantreau at 05:20 AM on 2 February, 2021You cheated. Ocean cycles were rebooted in the middle and then commandos of invisible leprechauns were lighting fires everywhere to heat up things. I'm pretty sure I saw it on FaceBook. It's all a hoax.
- 2021 SkS Weekly Climate Change & Global Warming Digest #1
MA Rodger at 01:17 AM on 12 January, 2021Dr. S. Jeevananda Reddy @8,
Your list of "my publications for information only" contains a 2008 book entitled 'Climate change: myths and realities' which I thought to track down to better understand your position on AGW as your position appears worryingly difficult to establish from your comments within this thread.
Your book is partially available on-line and does containI some eye-opening passages. For instance:-
5.2 What is Climate Change?
"Climate Change" is a change in the "average weather". ... In the past climate change refers to the "Systematic Natural Rhythm", expressed in the form of cycles with different time scales. In recent years, it invariably refers to one component of man-induced changes, expressed in the form of global warming "trend". The major culprit in this sordid episode is the Intergovernmental Panel on Climate Change (IPCC).
The book also has a most curious citation in Google Scholar entitled "Who is Dr. S. Jeevananda Reddy?" which well explains some of the "erroneous concepts you have formed" mentioned @9.
More than 100 comments found. Only the most recent 100 have been displayed.
More than 100 comments found. Only the most recent 100 have been displayed.


THE ESCALATOR

(free to republish)