


 Arguments
Software
Resources
Comments
The Consensus Project
Translations
About
Support
Arguments
Software
Resources
Comments
The Consensus Project
Translations
About
Support
![]()
![]()
![]()
![]()
![]()
![]()
![]()
![]()
![]()
![]()


![]()


Latest Posts
- Water is at the heart of farmers’ struggle to survive in Benin
- At a glance - The difference between weather and climate
- India makes a big bet on electric buses
- 2024 SkS Weekly Climate Change & Global Warming News Roundup #16
- EGU2024 - An intense week of joining sessions virtually
- Skeptical Science New Research for Week #16 2024
- How extreme was the Earth's temperature in 2023
- At a glance - Is the science settled?
- What is Mexico doing about climate change?
- 2024 SkS Weekly Climate Change & Global Warming News Roundup #15
- Fact Brief - Did global warming stop in 1998?
- Skeptical Science New Research for Week #15 2024
- EGU2024 - Picking and chosing sessions to attend virtually
- At a glance - The Pacific Decadal Oscillation (PDO) is not causing global warming
- Climate Adam: Is Global Warming Speeding Up?
- 2024 SkS Weekly Climate Change & Global Warming News Roundup #14
- Gigafact and Skeptical Science collaborate to create fact briefs
- Skeptical Science New Research for Week #14 2024
- How can I make my retirement plan climate-friendly?
- At a glance - Global warming and the El Niño Southern Oscillation
- A data scientist’s case for ‘cautious optimism’ about climate change
- 2024 SkS Weekly Climate Change & Global Warming News Roundup #13
- Skeptical Science New Research for Week #13 2024
- You can start applying for the American Climate Corps next month
- At a glance - Human fingerprints on climate change rule out natural cycles
- Want clean electricity? These are the overlooked elected officials who get to decide.
- 2024 SkS Weekly Climate Change & Global Warming News Roundup #12
- Climate - the Movie: a hot mess of (c)old myths!
- Skeptical Science New Research for Week #12 2024
- Climate Adam: Could the Amazon Rainforest Collapse?
Comment Search Results
Search for exponential
Comments matching the search exponential:
- At a glance - Is the CO2 effect saturated?
Bob Loblaw at 23:43 PM on 23 April, 2024Theo:
Taking a quick look at that paper, I see it refers to Angstrom's work in 1900 to support their "saturation" argument. This is already discussed in the Advanced tab of the detailed "Is the CO2 effect saturated?" post that this at-a-glance introduces. Short version - we've learned a few things since Angstrom wrote his paper in 1900.
Searching the recent paper for "saturation", it seems that they are using the typical fake skeptic approach that applies the Beer-Lambert law (which is exponential in nature, and a standard part of radiation transfer theory) to the atmosphere as a whole. That is - they look at whether or not IR radiation can make it through the atmosphere in a single pass.
To nobody's surprise, this turns out to not be the case - IR radiation in the bands absorbed by CO2 rarely makes it directly from the earth's surface to space. The energy in the photons needs to go through a series of absorption/re-emission cycles as it gradually works its way up through the atmosphere. When these processes are included in the calculations, it turns out that this particular flavour of the "saturation" argument falls flat on its face, and adding more CO2 (compared to our current levels) does indeed have an effect.
Executive Summary: the authors of that paper have no idea how the greenhouse effect works, as Eclectic has stated.
Read the full rebuttal here for more discussion - and the details of the Beer-Lambert Law are also discussed in this SkS blog post.
Elsevier is usually considered a reputable publisher, but they screwed up on this one. The rapid passage from "received" to "accepted" is indeed a red flag. The journal - Applications in Engineering Science - is clearly an off-topic journal for this paper. On the page I link to, it mentions "time to first decision" as 42 days, and "review time" of 94 days. If you click on "View all insights", you get to this page that also gives "Submission to acceptance" as 77 days, and "acceptance to publication" as five days. The seven days for this paper (from "received" to "accepted") is, shall we say, a bit shorter than usual?
It is worth noting that several other papers in the same issue also have very short times between "received" and "accepted". Of the four I looked at, none of them had any indication that the authors were asked to revise anything, which is rather unusual. Someone at that journal is in a rush.
(If you click on "What do these dates mean?", below the title/author section of the web page for the appear, it specifically states that "received" is the date of the original submission, and they will say "revised" if a more recent version is submitted - e.g. after review.)
- A data scientist’s case for ‘cautious optimism’ about climate change
William at 03:19 AM on 3 April, 2024lchinitz 13,
It is interesting to compare Covid with climate change. With Covid I was ( certainly at the beginning ) very much on the precautionary side. It was a brand new unknown virus and rising exceptionally .
Climate change is of a completely different order - with Covid speed because of the exponential growth speed was of the essence. No such things occurs with climate change - there is no exponential threat as such . Very importantly the threat is extremely slow moving - if a low lying island is threatened we have years to adapt .
There are no upside benefits to a virus - warming/less cold might be good.
We panicked over Covid because people died and very quickly - we were right to panic - and even if we might ( or might not ) have panicked too much - we did the right thing at the time without hindsight.
We are now more relaxed about Covid because fewer are dying - we have had 40 years of climate change coverage and fewer people are also dying.
I am much more worried about a future pandemic than climate change - a pandemic hist you quickly - we can adapt to climate change and we have plenty of time.
nuclear war , biological terrorism even AI worry me a lot more than climate change - they are scary and unpredictable.
In 2019 the WHO cited climate change as the greatest threat to huma health in the next 12 months. Talk about looking in the wrong place and getting things wrong. - Is Nuclear Energy the Answer?
Rob Honeycutt at 02:22 AM on 3 February, 2024John... "largely because in the west none was being built..."
Don't you think that was primarily because it's hard to attract investment when, once built, these plants wouldn't be able to produce electricity at a competitive price? Even if projects are claiming they can produce at a lower cost, they're very far from proving that out.
In the meantime, wind and solar continue to scale exponentially.
If you're an investor in energy markets it seems pretty darned clear where the best place to put your capital is.
As I said before, I think there's perhaps a place for some nuclear. I know there are going to be people out there insisting it's going to work. I'd just say that's a long, tough row to hoe.
- Cranky Uncle with Dr. John Cook
Rob Honeycutt at 08:09 AM on 7 January, 2024Ben... I think crashing the economy wouldn't be a wise approach to avoiding disaster. You can't rationally trade one form of human catastrophe for another. Crashing the economy would potentially be as bad or even worse than the path we're currently on.
I would note there are no researchers (that I am aware of) suggesting crashing the economy as a solution to the climate change crisis. My suggestion for you is to consider the idea that deployment of carbon-free energy is operating on a exponential scale. That could actually bring us in line with zero carbon goals, if we can achieve that. Probably the bigger concern is resource limitations to carry out exponential deployment of renewables.
- 2023 SkS Weekly Climate Change & Global Warming News Roundup #44
nigelj at 04:49 AM on 14 November, 2023Just Dean @27
Regarding the experts allegedly blaming the warming this year (particularly July to October) on climate change plus a bit from el nino. This doesn't sound convincing to me. El Nino has barely even started so wouldnt have much effect (as others point out) , and greenhouse gas warming and its realted feedback mechanisms is a gradual process that wouldn't cause a sudden spike in warming in a few months of one year.
The reduction in industrial aerosols from the new shipping rules in 2020 is also not a good explanation for this years warming. The reduction in aerosols stared immediately in 2020 and increased from there, so You would expect it to have had a fairly immediate effect and an effect over the three years. Its hard to see why it would create a sudden warming spike three years later.
I think MAR has a good explanation that the Tongan Volcano's aerosols have all fallen out of the atmosphere and remaining water vapour has thus caused a spike in warming. I did a google search a few days ago, and aerosols decrease over a period of a couple of years following a reverse exponential curve and water vapour can remain in the stratosphere for a couple of years. All it would need is for a large part of the water vapour to remain a little bit longer than the aerosols.
But I think that the global warming trend will accelerate and may have already accelerated, due to the reduction in industrial aerosols and various feedback mechanisms, but it is not something we would be able to detect in just a couple of years temperatures. And its most likely going to be a gradual process, rather than a step change in just one year.
- Climate Confusion
Rob Honeycutt at 04:09 AM on 4 September, 2023Markp... The conversation gets unweildy when you do such long posts. Can you please try to engage in a bit more editing to get your comments better focused? I think it would improve the value of this exchange.
I'm only going to address your first observation here: "'A lot is happening towards decarbonization' is vague enough to require examples to qualify the statement."
I'm sure there is a better thread for this but, if the mods will allow, I'll just post a response here for now.
First is the mere fact that onshore wind and solar are now cheaper than FF sources. This is relatively recent yet is already starting to show benefits in the energy marketplace.

The result of this is now renewable energy is scaling exponentially.
Bear in mind, this is still the early phase of exponential growth, so the true effects of that growth are going to be realized out past 2030-2050.
In the latest EIA LCOE (levelized cost of energy) reports they're now including battery storage technologies because those costs are now falling in line with peaker plants.
So, to try to somewhat tether this to the topic at hand, these technologies are the product of decades of very hard, complex work done by a lot of very smart people. These are the fruits of those efforts. This is why I say, while there are still many large and looming challenges, there is a lot of positive change afoot that should not be ignored.
These advances are very likely a product of the sorts of communications and political engagement done over the years by the IPCC and various resulting international agreements. It would have been unlikely any of these advancements would have occurred with out the IPCC's work.
These are the kinds of advancements that have to occur in order to get to net zero and then eventually zero carbon emissions by 2050 and after.
- The Big Picture
peppers at 02:50 AM on 21 March, 2023HI One World, and also Rob made some sea level comments as well.
Im sorry I don’t have more time, and some of you commit large swaths of time here and I appreciate that.
Using NASA data, presuming they have the best resources and equipment, satellites and those argo sea probes et al. to gather original data, they show sea level rising since 1993 to be 3.8 inches.
https://sealevel.nasa.gov/
But what I think you are trying to indicate, and what the graphs show mostly, are that the rate of sea rise increases as the warming continues higher and higher. An exponential effect is presented. So taking past temperature increases will not explain future expected gains. It is either an exponential increase or the suggestion is that the increase is delayed so that as we go up in temperature, the rise happens decades later and there is a build.
I think we have finished with the run away suggestions for nature. The train bearing down on a child and all that. I see that as tactics to get people to listen and pay attention, but nothing true in our environment. Nature balances. She reacts. This Co2 rise is a reaction and right now she is reacting to this human population boom, which is unprecedented in history. And all the energy use associated with all these new counts of people on earth, living longer and healthier than ever, this is increasing Co2 counts and enriching our surface world in all the ways Co2 can do that.
Nasa used 4-5 scales to predict sea rise, 1. tracking if nothing is done, 2. some is done and 3. complete zero new emissions is achieved ( which cannot happen until the population levels out in 60 or so years ).
By 2100 there is Nasa modeling of .4 to .8 meter rise, using the data set of 2. some is being done. Doing what we can will be instrumental in keeping high tide from being higher than usual in that future time. I’ve tries to stay with the median predictions, so this is not discrepancy conversation of the outer 5%’s.
Science American believes no new storms are made but the severity of moisture based storms may increase by 2-4 miles per hour. The threat of sea rise is about the most serious threat.
I understand better where you are coming from. I still have the higher philosophical orientation to grapple with.
If mankind has finally achieved the goal of conquering the mission of dreams pondered throughout the pain filled ages, of solving misery and pain and finding medical success beyond any expectations. Is this worth it? A sea level rise?
The highest gain has been with infant mortality, which has plummeted from the high middle ages at 400-500 per thousand to 5.5 infants per thousand today. Think of all the occasions of birth deaths which also took the mother too, to quantify misery. That and antibiotics alone have caused this phenomenon of Co2 rise. Life spans have increased 61%, living conditions have soared, medicine is in a wonderland of abilities and birth to adulthood stats are beyond anyone’s wildest dreams. The question is; is that worth a side effect of sea level rising a foot and a half, maybe 2 feet at high tide.
This endeavor appears to goad and cajole and shame people using fossil fuel and I suppose that is the fastest way to get attention. But I do not believe it to be honest. This appears to be unwittingly human caused and one must decide if it is worth the subsequent consequences ahead. It is not from derelict and wanton people, it is from the results of scientific achievement, sought after for ages and finally achieved within the science that coincided with the industrial revolution. The origin of this is important to be able to consider context to this issue. If I were there and had the choice in my hands, I’d have us standing exactly where we were today. Reducing Co2 is still important, but I wouldn’t be bullying any brothers from any mothers over this. It is important, but not that important all things considered. - It's not bad
peppers at 02:49 AM on 21 March, 2023HI One World, and also Rob made some sea level comments as well.
Im sorry I don’t have more time, and some of you commit large swaths of time here and I appreciate that.
Using NASA data, presuming they have the best resources and equipment, satellites and those argo sea probes et al. to gather original data, they show sea level rising since 1993 to be 3.8 inches.
https://sealevel.nasa.gov/
But what I think you are trying to indicate, and what the graphs show mostly, are that the rate of sea rise increases as the warming continues higher and higher. An exponential effect is presented. So taking past temperature increases will not explain future expected gains. It is either an exponential increase or the suggestion is that the increase is delayed so that as we go up in temperature, the rise happens decades later and there is a build.
I think we have finished with the run away suggestions for nature. The train bearing down on a child and all that. I see that as tactics to get people to listen and pay attention, but nothing true in our environment. Nature balances. She reacts. This Co2 rise is a reaction and right now she is reacting to this human population boom, which is unprecedented in history. And all the energy use associated with all these new counts of people on earth, living longer and healthier than ever, this is increasing Co2 counts and enriching our surface world in all the ways Co2 can do that.
Nasa used 4-5 scales to predict sea rise, 1. tracking if nothing is done, 2. some is done and 3. complete zero new emissions is achieved ( which cannot happen until the population levels out in 60 or so years ).
By 2100 there is Nasa modeling of .4 to .8 meter rise, using the data set of 2. some is being done. Doing what we can will be instrumental in keeping high tide from being higher than usual in that future time. I’ve tries to stay with the median predictions, so this is not discrepancy conversation of the outer 5%’s.
Science American believes no new storms are made but the severity of moisture based storms may increase by 2-4 miles per hour. The threat of sea rise is about the most serious threat.
I understand better where you are coming from. I still have the higher philosophical orientation to grapple with.
If mankind has finally achieved the goal of conquering the mission of dreams pondered throughout the pain filled ages, of solving misery and pain and finding medical success beyond any expectations. Is this worth it? A sea level rise?
The highest gain has been with infant mortality, which has plummeted from the high middle ages at 400-500 per thousand to 5.5 infants per thousand today. Think of all the occasions of birth deaths which also took the mother too, to quantify misery. That and antibiotics alone have caused this phenomenon of Co2 rise. Life spans have increased 61%, living conditions have soared, medicine is in a wonderland of abilities and birth to adulthood stats are beyond anyone’s wildest dreams. The question is; is that worth a side effect of sea level rising a foot and a half, maybe 2 feet at high tide.
This endeavor appears to goad and cajole and shame people using fossil fuel and I suppose that is the fastest way to get attention. But I do not believe it to be honest. This appears to be unwittingly human caused and one must decide if it is worth the subsequent consequences ahead. It is not from derelict and wanton people, it is from the results of scientific achievement, sought after for ages and finally achieved within the science that coincided with the industrial revolution. The origin of this is important to be able to consider context to this issue. If I were there and had the choice in my hands, I’d have us standing exactly where we were today. Reducing Co2 is still important, but I wouldn’t be bullying any brothers from any mothers over this. It is important, but not that important all things considered. - The Problem with Percentages
michael sweet at 22:59 PM on 20 February, 2023Doug,
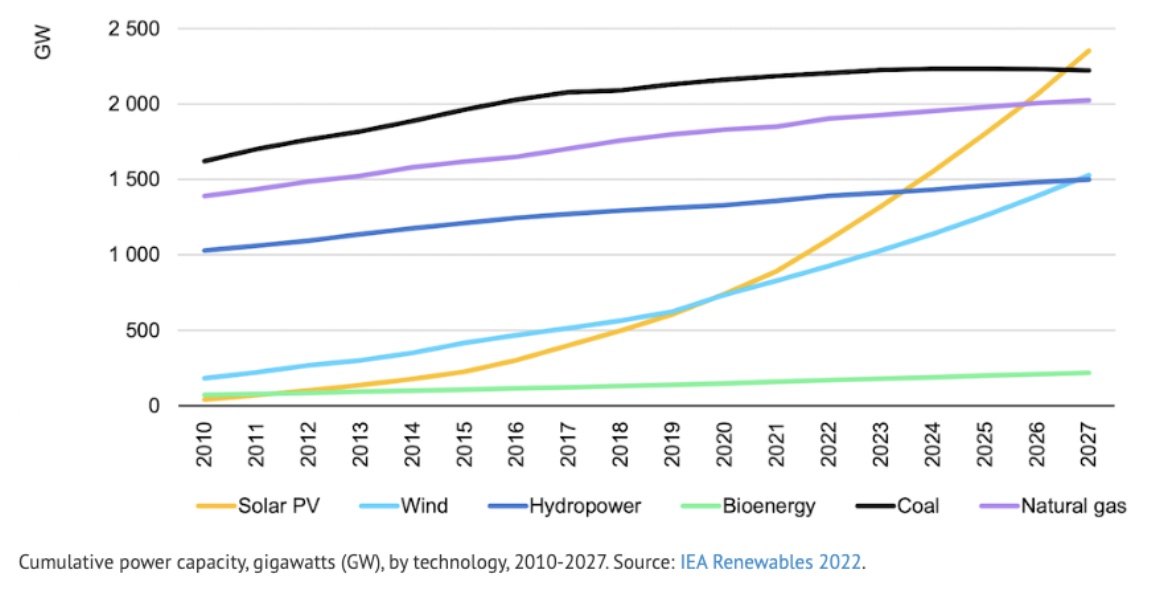
I saw the reference. The entire point of the OP is derived from figure 4 which is the construction of the author and has no reference. Others have pointed out why this figure is not even wrong. According to the IEA report, global electricity demand will be approximately 29,000 TWh in 2025 not the 160,000 TWh shown in figure 4. It appears to me that the author has added a factor of ten to the world energy demand which makes it appear that renewable energy cannot replace fossil fuels. I note that checking the carbon intensity of the EU would immediately show that renewables have significantly reduced the amount of carbon released.
It appears to me that MA Rodgers analysis of figure 4 is correct. Wind and solar energy, especially solar which is the cheapest energy in the world today (only wind can come close to solar), are increasing exponentially. Averaging in hydro, which for all practical purposes has not significantly changed in the past 10 years, makes an exponential increase turn into a small increase.
In the OP it states "it is very difficult, without using energy storage, to generate more than about 30% of the energy from renewables." In comment 8 says " Any of these projections are risky, because continued expansion of renewables beyond producing about 30% of power requires storage technology that must be deployed on a large scale and may compete for materials used in the transportation industry." The published literature has analyzed this and there are sufficient materials for the foreseeable future available. There are bottlenecks that have to be overcome as more renewable energy manfacturing facilities are built. The claim that renewables can only generate 30% of all electricity was shown to be completely incorrect years ago.
The International Energy Agency report that I cited covers the entire globe. I used USA data to address the 30% claim because the data was the first hit on my Google search and met the criteria of wind and solar only. It takes some time to find renewable energy data where the hydro has been left out. The 30% claim was made without any supporting data. Data proving the 30% claim is false anywhere shows the 30% claim is false for the entire world.
The OP is terrible doomerism. The IEA data clearly shows that wind and solar currently replace essentially all of the increase in energy demand worldwide. The question is: can the installation of wind and solar increase fast enough to meet climate goals. Last year over $1 trillion (!!!!!) was spent by governments to subsidize the fossil fuel industry and only about 1/3 of that was spent (primarily by the free market) on building new renewables. How can the politics be overcome?
Renewables including storage are much cheaper than fossil fuels. In addition, fossil pollution kills over 5 million people every year worldwide. Switching to renewables will make everyone healthier because ofreduced pollution. It has been shown that even 2% of EVs replacing internal comustion engines results in less hospital visits for asthma.
The Paris accords could still be met if most governments worldwide subsidized renewable energy as much as fossil fuels.
The OP should be removed from Skeptical Science since the conclusions are false. It will be used as an example of environmental doomerism.
- The Problem with Percentages
PrzemStep at 19:57 PM on 18 February, 2023Evan, thanks for the feedback. I would underline that COViD is 2020, but fossil fuel energy used hasn't risen since 2018, so this could be a global trend - impact of EV and heat pumps should start being felt. Let's wait for 2022 stats, but I believe the picture will be similar. I still believe that the potential of stagnating growth or even a drop in fossil fuel energy use should have been mentioned.
As to the other point: In order for the argument to be more sound it would work better the actual numbers. And the fact is that by coupling wind and solar (degrading exponential) with hydro (linear) you muted the actual percentage growth of renewables. You reached 14000 TWh, I reached 26000 TWh. You must admit growth to 26000 TWh would look way more impactful on the above charts and over 100% of energy growth would be covered by renewables.
- The Problem with Percentages
PrzemStep at 08:31 AM on 18 February, 2023Hi there,
Unfortunately I'm posting because I noticed what can only be called bad trend analysis.
1. The renewable energy growth trend is simply badly done.
a) Renewable energy has four distinct components with different growth trends. Wind, solar, hydro and the rest (primarily bioenergy). Hydro and other renewables is following a linear growth trend, while wind and hydro are growing exponentially. However this exponentiality is hidden if you throw them in together: the dominant hydro represses the actual growth rates of solar/wind. This means your analysis is inherently flawed.
b) Solar is growing from 2011 to 2021 by 38,8% annually, while wind by 16,5%. Assuming hydro and other renewables continue linear growth they reach respectively 5000 TWh and 1100 TWh by 2032. By comparison if solar and wind retain 38,8% and 16,5% annual growth rates they will reach 37600 TWh and 9900 TWh respectively, so jointly renewables would have 53600 TWh by 2032. That would be the result of a proper trend analysis. Surprisingly you seem to have had a problem with percentages...
c) Now both solar and wind seem to be following more of an S-curve, so 38,8% and 16,5% growth rates seem unlikely to hold. Basic analysis of trends suggests average growth rate for 2022-2032 at 25,5% and 14% respectively, worst case scenario 20% and 11%. This average scenario would mean 26300 TWh renewable energy by 2032, while the worst case scenario 19000 TWh. As you can see all result put it much higher than your wrongly done trend analysis suggests.
2. The fossil fuel usage graph has an even simpler flaw. It suggests continued linear growth, but absolutely ignore the fact that fossil fuel usage seems to have stalled in 2018 and shown little growth. We seem to have hit peak oil consumption. IEA notes all these facts. No does this mean that fossil fuel usage will stop growing or even start falling? No. But you should have at least noted the recent stagnation of fossil fuel growth as the sudden jump from 2022 is odd to say the east.
- 2023 SkS Weekly Climate Change & Global Warming News Roundup #5
EddieEvans at 00:20 AM on 9 February, 2023"So we need Draconian rather than Transitioning solutions in order to get out of trouble. Maybe someone can think up a few less Robespierre than mine."
I was there quite a while ago, long before I finally focused on the fossil fuel industry's deception, and then "took a deep dive" into climate and science. I reached draconian language on ecology as a critical science when answering the question, "Does biodiversity matter." Malthus may have been wrong about his philosophy in general, but he got the "geometrical growth right," as Darwin would see growth as a key to the struggle for life. I know that we typically use "exponential growth" these days. I see humanity making a big thud rather than smoothly sliding into a deranged future.
- 2023 SkS Weekly Climate Change & Global Warming News Roundup #2
Rob Honeycutt at 02:24 AM on 24 January, 2023Evan @13... I don't think "scientists" make such a mistake, nor do they make specific assertions about whether we will or won't get to net zero.
Climate research offer up a very wide range of potential outcomes, since obviously no one can predict future events. All researchers are doing is saying "if" we get to net zero (and there certainly is a chance we can achieve this in the next 30 years) then warming should stop as we reach that level.
You say, "But so far, nothing we have done has slowed the upward acceleration of the Keeling Curve." I think the challenge there is, when you're at the inflection point it's very hard to determine where the trend is going to go by eyeballing charts.
I remain positive on this topic because I do see things are happening. Every day when I read the news I see new technologies and new strategies aimed at elimination of greenhouse gases. I know that renewable energy is now the cheapest energy available and is continuing to fall in cost, and it's now scaling exponentially.
I also find pessimism to be a mindset that robs people of motivation to achieve new things. By framing the issue as "we're screwed" tends to act as a self fulfilling prophecy.
I am realistic in that I know for certain things are going to get worse. The tasks ahead are gargantuan. The impacts are going to affect different people to different degrees. But there are levels of how bad this gets. As Dr. Stephen Schneider said, "'End of the world' and 'good for us' are the two lowest probability outcomes."
- 2023 SkS Weekly Climate Change & Global Warming News Roundup #2
Rob Honeycutt at 03:02 AM on 17 January, 2023Eddie... @1: Human extinction is highly unlikely in any scenario. Extinctions (plural) of a broad range of wild species is ongoing and likely to worsen. Those extinctions have impacts on humanity. High emissions scenarios could produce a collapse of modern society as we know it. That would entail a great deal of human suffering. But actual human extinction isn't likely.
@3: The recent research on "warming in the pipeline" is suggesting this is incorrect. Once we get carbon emissions down to "net zero" (to the point where atmospheric concentrations stabilize) warming is expected to stop. Currently, with renewables scaling exponentially, we could get to net zero by mid-century. (Haufather)
Climate related impacts are certainly going to keep getting worse until we can get our emissions stabilized. Bringing them back down to, say 350ppm, isn't in the cards any time in the foreseeable future. Thus, I think the climate we have for quite a while is the one where we stabilize emissions. That's a very different world than the one most of us were born into.
...but, again, human extinction? No.
- Don’t get fooled: Electric vehicles really are better for the climate
Rob Honeycutt at 04:20 AM on 15 January, 2023Doug @44... "So the net result of adding the EV load is an equivalent 'increase' in coal generation compared to the scenario when no EV load existed."
Coal generation is clearly declining.
Renewable energy is now scaling exponentially.
The net result is reduced carbon emissions. Electrifying surface transportation with EV's is a (the most, even) significant part of that equation.
- Don’t get fooled: Electric vehicles really are better for the climate
Rob Honeycutt at 10:15 AM on 7 January, 2023Doug @35... "One report last year listed 26 coal plants either closing early(21) or switching to gas(5)."
Cite that report, please.
"In their best case for renewables eia projects this growth in renewables can allow us to meet a flat demand with no added natural gas plants through 2050 and beyond."
Projections for renewables growth have been notoriously bad. Don't forget that renewables are now scaling exponentially.
- Human CO2 is a tiny % of CO2 emissions
Rob Honeycutt at 08:57 AM on 28 December, 2022Doug... Yes, what you're comparing is the "up front capital costs" which all new facilities incur. The up front capital costs for FF is lower, but then you're burdened with supplying that facility with fuel for the lifetime of its existence. Whereas, the up front cost of renewables are higher but they require no fuel for their lifetime. This is exactly what LCOE is.
Investors do not base their decisions only on up front capital costs but rather on the ROI they will see over the lifetime of the project. Renewables also generally have a shorter lifespan for any given installation, but in that span of time the investor reaps the entire return faster and moves on to a new project well before they can see their full return on a dollar-for-dollar investment for a FF based facility.
This is why renewables are now scaling exponentially.
- Human CO2 is a tiny % of CO2 emissions
Rob Honeycutt at 12:20 PM on 27 December, 2022Doug @363... "It would take little or no up front capital investment to continue with FF."
This is also incorrect. All forms of generation have a useful lifetime and eventually need to be decommissioned and replaced. What is happening is much of the new added generation as well as replacement generation is being filled with some form of renewables. Renewables are currently scaling exponentially.
Moreover, the cost of FF sources is rising as renewables continue to fall in cost. The previous link to the EIA LCOE report this year includes the cost of grid level storage since those cost are now starting to fall below the levelized cost of peaker plants.
- From the eMail Bag: the Beer-Lambert Law and CO2 Concentrations
Bob Loblaw at 00:37 AM on 26 December, 2022Scruffy:
As the article makes no mention of CO2, nor the length of the cylinders, when discussing the 1% per cylinder, 37% for 100 cylinders example in figure 4 and related text, your criticism of those numbers is a straw man argument. The example shows the exponential nature of the absorption relationship, and you are reading more into it than it says.
You do not explain what "NIST data" you are referring to. NIST is not mentioned in the blog post.
As for the rest of your comment, you have missed an extremely important factor. You speak of CO2 molecules absorbing IR radiation and transferring energy to other molecules. You seem to be completely unaware that the same process of molecular collision will add energy to CO2 molecules and allow them to continually emit IR radiation at the same wavelengths that CO2 absorbs IR radiation. Your conclusion that "no energy will be radiated into space in the CO2 absorption spectra" is simply wrong. For it to be true, CO2 molecules would need to drop to a temperature of 0K, which won't happen as long as they can collide with other molecules (of other gases) and maintain a tempesrature above 0K. In fact, they'll be at a temperature equal to those other molecules.
The bogosity of your argument is also made clear by your claim that other greenhouse gases can emit IR radiation "in their own spectral lines", and pass energy up through the atmosphere - energy that they received by collision with CO2 that absorbed IR radiation. This magical thinking requires that other gases follow different physics from CO2 - they can emit IR radiation, but CO2 can't. Standard physics does not claim that CO2 is the only gas that matters - it just accepts that all greenhouse gases can both absorb and emit IR radiation in the spectral lines that match their internal energy state levels. And that collisions are constantly transferring energy from one molecule to the next - in both directions (not just one, as your hypothesis requires).
You clearly do not understand how greenhouse gases play a role in atmospheric energy transfers.
- Skeptical Science New Research for Week #43 2022
nigelj at 11:24 AM on 28 October, 2022"Overemphasized apocalyptic futures can be used to support despotism and rashness. For example, catastrophic and ultimately inaccurate overpopulation scenarios in the 1960s and 1970s contributed to several countries adopting forced sterilization and abortion programs, including China’s one-child policy, which caused up to 100 million coerced abortions (7), disproportionately of girls."
I dont accept that the apocalyptic population scenario was over emphasised. The potential was there for exponential growth and complete disaster. Large families were common back then everywhere with not much sign of this changing. Family size in the USA only barely started changing slighly in the early 1960s, so there was no firmly established trend towards smaller families you could assume would continue.
This was particularly the case In China which already had a huge population. Chinas inhumane response was unfortunate but those sorts of policies were mostly limited to China.
The population problem turned out to be less than anticipated (but still pretty bad imo) because the demographic transition was faster than anticipated, and the contraceptive pill discovered in about 1960, became widely adopted and food production improved more than anticipated especially in asia. Nobody could have predicted that or assumed that those things would happen.
You dont downplay a problem because it might possibly be solved at some point in the future. You would need to be certain it would be solved. If anything you highlight the problem to motivate people, but stopping short of exaggeration.
And one of the reasons the population problem was less than anticipated was Chinas one child policy, something that seems lost on the authors of the study.
And what are we left with anyway? A massive global population using up the earths resources at a prodigious and unsustainable rate according to UN studies. Some of this is very high per capita consumption in developed countries, but even lower consuming people in poor countries have a huge environmental footprint, because of the sheer size of their populations.
IMO the authors of the study are deluded, and writing with a lot of benefit of hindsight.
- No, a cherry-picked analysis doesn’t demonstrate that we’re not in a climate crisis
nigelj at 07:59 AM on 8 October, 2022Sea level rise appears to be following a quadratic (parabolic) curve. Perhaps this is not surprising because steadly increasing and accumulating CO2 levels in the atmophere and known positive feedbacks causing the warming trend, would be consistent with a parabolic function, and not so much a linear or exponential function. But if antarctic ice sheets physically destabilise that could be a local exponential function.
- No, a cherry-picked analysis doesn’t demonstrate that we’re not in a climate crisis
Bob Loblaw at 04:09 AM on 8 October, 2022To pick a nit, I think your trajectory after jumping off a cliff is best described by an elliptical function, with the centre of the earth as one of the focii. You are launching yourself into orbit - albeit a short one once the earth gets in the way.
Next best approximation is a parabola, and that probably fits an exponential increase in vertical speed to a pretty high accuracy.
The one thing it definitely is not, is linear. That very rapidly becomes obvious.
But then, the contrarian industry has long had a habit of trying to force reality to fit their beliefs - e.g. the infamous North Carolina effort to declare that sea level was only allowed to change based on a linear extrapolation of past readings.
- No, a cherry-picked analysis doesn’t demonstrate that we’re not in a climate crisis
ubrew12 at 03:51 AM on 8 October, 2022If the authors of this paper find no statistical evidence of climate change on weather events, it seems incumbent on them to posit a reason.
From the conclusions section: "It would be nevertheless extremely important to define mitigation and adaptation strategies that take into account current trends." This seems reasonable except for two things:
1) the authors are saying the current trends are indistinguishable from zero.
2) Even if nonzero, nobody expects 'current trends' to remain current for long, in an exponential phenomenon.
You can't look at what is happening and conclude anything else: that we're in the midst of something best explained by the exponential function. Which is also used to describe things that are exploding.
After sea level rises 3 feet, it's easy to say we should have done something. But the actual moment to do something is when you jump off the cliff, not when you hit bottom (btw, your trajectory after jumping off a cliff is also best described by the exponential function).
- Is Nuclear Energy the Answer?
MA Rodger at 16:41 PM on 28 August, 2022John ONeill @292,
Really?
Maybe I've missed something but it is quite easy to demonstrate that nuclear is not delivering.
It is not a particularly clever analysis by this economist Edgardo Sepulvda. Cutting the world into tiny bits such that a small country with a nuclear power plant or two will suddenly have a big chunk of low carbon electricity capacity arriving in short order. Isn't that inevitable?
Imagine. Shoe-horn a nuclear reactor into Luxembourg, press the on button and bingo - we have a winner!!
A cleverer approach would surely be to take the global view of this. AGW is after all a global problem requiring a global fix.
OurWorldInData shows the meatiest increase in nuclear generation occurred back in 1984 & 1985 when generation jumped by 221TWh/y & 234TWh/y respectively. This compares with the almost exponential rise in wind generation which jumped 265TWh/y in 2021. Or if longer periods are compared, both nuclear and wind increased massively from under 100TWh/y, wind achieving 1,860TWh in the last 17 years, and nuclear 1,730TWh/y over a similar 17 year period. So the numbers are not dissimilar but the nuclear stuff was back over thirty years ago.
Of course, we don't know for certain how tomorrow will shape out but the near-exponential growth in wind generation will presumably continue in coming years, so presumably easily exceeding a linear increase which would be 265TWh/y. Meanwhile for nuclear we know there is 0.058TW of new build expected to switch on in the next six years which. if it arrives on time to give say 90% load factor and none of the existing capacity shuts down, that would result in 76TWh/y increase in low carbon generation, a level well below 30% of the wind delivery.
And that is why I say that, in comparison with wind, a sensible analysis shows nuclear not delivering. But then, have I missed something?
- Water vapor is the most powerful greenhouse gas
Bob Loblaw at 01:27 AM on 20 August, 2022Oh, darn. The moderator has pointed Likeitwarm to a place where the answers to my homework assignment can be found.
The infinite series I had in mind is:
1 + x + x*x + x*x*x....
or
1+ x + x2 + x3 ...
where x is the additional single-step feedback temperature rise added to the initial 1 degree rise. At each subsequent step, x acts on the extra rise from the previous step, hence the x2, x3 terms.
Brilliant mathematicians have managed to find a closed form (finite) solution to that infinite sum, for x less than 1.
sum = 1/(1-x)
As long as x < 1, there is an eventual stable sum. If x = 1, the denominator becomes zero and the sum becomes infinite. If x>1 the sum at each step represents an exponential increase.
- CO2 effect is saturated
Bob Loblaw at 23:28 PM on 6 August, 2022OldHickory @ 646 and 648
Although you have not explicitly stated your definition of "saturation", the reference you provide to Barton Paul Levenson's web page suggests that you are making the argument based on transmission through a finite distance of a medium, as calculated from the Beer-Lambert law.
The Beer-Lambert Law is an exponential decay, and as a result the absorption never reaches 100%. Thus, to use it as an argument for "saturation", you need to make an argument of the form "this is close enough to 100% for all practical purposes". On Levenson's page, he uses 99% to perform the calculations he presents in his table 1.
The catch is, for any given distance you choose where absorption is 99% (and transmission is 1%), I can give you a shorter distance where absorption is less than 99% - even as low as 1%, if I make it short enough. Even if you choose something more that 99%, I can always choose a shorter path with a much lower absorption total.
Let's call your distance L1, and my distance L2. Your "saturation" argument is that increasing CO2 will have a negligible change on tramission through the layer to L1, since it is already almost 100%. But it will have an effect. If the original result is 99%, and increasing the absorption so that it is now 99.6%, is the change important? Well, you will probably argue that 99% and 99.6% are "the same for all practical purposes" - in fact, your "saturation" argument is completely dependent on making such a claim.
But what is the difference if we look at my distance. L2? What was 1% absorption is now 1.2%, and your saturation argument also depends on claiming that 1% and 1.2% are "the same for all practical purposes". The catch is, they are not. We are nowhere close to "saturation", and absorbing 1.2X greater radiation is significant.
One of the major factors in the radiative transfer equations is that absorbed radiation energy will most likely eventually be emitted again, and that emission will be equally likely to be up or down. Small changes in absorption lead to a larger number of absorbed/reemitted cycles before radiation is lost to space from the upper atmosphere, and as that number increases, so does the radiative greenhouse effect.
Your "saturation" argument depends on looking at the process as a single layer, thick enough that you reach "close enough to 100% for all practical purposes", and it fails because you are rolling the effect of many atmospheric layers into one.
I suggest that you read this post on the Beer-Lambert Law (including the comments).
- The Climate Shell Game
Wol at 20:10 PM on 22 March, 2022Congratulations!
At last: a piece in an influential science-based outlet that doesn't skirt around, or ignore, the fundamental problem which is there are too many of us, and more by the second.
I've seen all sorts of arguments from all sorts of people attempting to play down the population issue, none of which make sense.
We are all familiar with arithmetic v exponential growth. It really is as simple as that. All living systems find equilibrium within their niches - except us: our technology has enabled us to outwit the exponential v arithmetic equation. Except that it hasn't. What it HAS done is enable us to extract from a limited - if large - natural capital of energy and raw materials to APPEAR to have done it, and now the end game is in full view. It's not just CO2, or energy generally - it's everything. There are just too many of us even if starting from a full bowl and not from the point where we have already used a large amount from the bowl.
It's not easy being optimistic today: I'm just glad to be eighty this year and with no children to worry about.
- From the eMail Bag: the Beer-Lambert Law and CO2 Concentrations
CD at 02:10 AM on 1 January, 2022An interesting article, but I have to disagree with the main point: The Beer-Lambert law is not applicable here.
The Beer-Lambert law applies to attenuation or absorption. But in the case of the interaction of IR radiation with CO2 we also have re-emission. That, after all, is how we get downwelling radiation and hence the Greenhouse Effect.
The principle of detailed balance dictates that in thermal equilibrium the re-emission must reverse the absorption process, so the combined process looks like scattering. And the maths of scattering is different to that of attenuation.
The big difference is that the transmission coefficient is no longer exponentially dependent on layer thickness, x, as e-kx, but instead has a reciprocal dependence of the form 1/(1+ax). For an explanation see here.
The net result is that the transmission tends to zero much more slowly as x increases than it would with just attenuation. In practical terms it is a small point because the transmission is still less than 2%. But what it does mean is that the temperature rise with increasing CO2 is greater (but still small).
- CO2 measurements are suspect
Anoo at 05:00 AM on 27 December, 2021Came across this post today after looking at some statistics that got stuck in my head.
Today the total landmass area of the world is 149 million sq km.
The total forested area of the world in 2016 was 30.7 million sq km, down from 49.8 in 1996.
Up to at least 2013 science had stated that the Amazon rainforest, at 5.5 million sq km, the Canadian Boreal Forest, at 2.7 million sq km, and the Congolese rainforest, at 1.7 million sq km, along with the rest of the boreal zone, were all CO2 sinks. In total it comes up to over 20 million sq km, out of a total of 30.7 million.
Now I am reading that all of these are net CO2 emitters. So up until 2013 they were sucking in CO2, now they are pumping out CO2.
Here's my question for all of you: Why isn't the CO2 level rising exponentially? If these combined forests were sequestering more than they were producing, but are now not able to sequester as much CO2 as they produce, this means that since 2013, with deforestation, and a loss of carbon sinks, we should have had at least a doubling of CO2, should we not have? Yet, when I look at the numbers, it would seem that the CO2 level increases are actually slowing, while emissions are increasing.
- Do COP26 promises keep global warming below 2C?
Wol at 12:12 PM on 18 November, 2021OPOF >>In spite of it being possible to better understand the issues, the waste-of-time diversionary claim that "Population is the problem" continues to persistently be brought up.<<
Yes, it's a "waste of time" but it is still THE problem whether we like it or not.
I certainly agree that the assumption that capitalism relies on constant growth is doomed to failure. The model has definitely allowed the planet to achieve what it has - standard of living for billions, moon landings, nuclear weapons and the rest - by use of FFs in the main. Obviously exponential growth of GDP as well as population is unsustainable.
It is interesting to look at the widely varying estimates of what population the planet can sustain indefinitely - I've never seen one that is remotely close to the projected 10 - 11Bn even assuming the same percentage are living well below the poverty line.
- An exponential increase in CO2 will result in a linear increase in temperature
MA Rodger at 19:47 PM on 9 October, 2021plincoln24 @18,
I think you appreciate that this SkS OP is attempting to address the perception of "exponential growth" and thus the idea that the log relationship between atmospheric CO2 cncentrations and forcing makes such "exponential growth" linear and thus arguably entirely acceptable. I would suggest it is not the easiest of messages.
There are also some real-world considerations with the Log(Exp)=Linear relationship. ♣ There is the impact of any change in the exponential factor driving the CO2 increase (with the OP pointing to that exponent increasing & NOAA AGGI showing CO2 forcing which post-2000 exhibit a doubling-time of 43 years & a decade longer for all-GHG forcing). ♣ There is the transcient effect of the sudden tripling of the GHG forcing back in the 1960s (which all else being equal should provide an accelerating temperature for some decades following). ♣ There is (thus) the impact of non-CO2 forcings as well as natural forcings. ♣ There are the natural feedbacks and their impact on very-long-term warming resulting from an initial forcing, these timescales which are generally considered the factors that will define whether ECS is high or low.
- An exponential increase in CO2 will result in a linear increase in temperature
plincoln24 at 19:14 PM on 7 October, 2021I just realized that I forgot some words in the sentence that reads "I can understand the public..." The sentence should read "I can understand the public misreading the claim to think it means no need to be alarmed, but the fact is that given a finite interval, you can always find a linear function that grows faster than any exponential function on that interval. So the only way to know whether we have a problem or not is to crunch the numbers from the data with appropriate modelling.
- An exponential increase in CO2 will result in a linear increase in temperature
plincoln24 at 19:12 PM on 7 October, 2021I really don't understand this article. I don't doubt that the climate crisis is serious and that we have to do something about it, however, I am a mathematician and the lograithmic relationship between the equilibrium temperature and the increase in CO2, implies that if the CO2 increases exponentially that the expected equilibrium temperature will increase linearly. So I don't understand why the claim "An exponential increase in CO2 will result in a linear increase in temperature" is posted as a myth in this article. I can understand the public misreading the claim to think it means no need, but the fact is that given a finite interval, you can always find a linear function that grows faster than any exponential function on that interval. So the only way to know whether we have a problem or not is to crunch the numbers from the data with appropriate modelling. The evidence is in, we should be alarmed. But I am puzzled by this post.
- Key takeaways from the new IPCC report
gws at 11:02 AM on 24 August, 2021ilfark2, some of the answers you seek are in sections B4 and B5 of the SPM.
First of all, note that this is a complete hypothetical because we won't stop emitting tomorrow; even a reduction to "net zero" by 2050 (aka within 30 years) is a stretch.
That said, note that the assumption of a linear drop you made @10 is unrealistic. Due to feedbacks in the earth-atmosphere carbon cycle system the drop is exponential as illustrated by the graph under @9, quite slow, and not returning to pre-spike conditions in equilibrium (after some 10s of thousands of years). OTOH, the graph @9 illustrates a spike of 5000 Pg; the actual spike at this point is closer to 1000 Pg. The graph is meant to illustrate a general system behavior, not a real-world scenario.
As atmospheric CO2 concentrations fall slowly after the emissions cease, the climate effect would linger, and as the SPM highlights in section B5, that means several climate parameters (e.g. sea level, ice cover) would remain altered for "centruries to millenia".
- The New Climate War by Michael E. Mann - our reviews
Bob Loblaw at 04:04 AM on 9 June, 2021Nick:
I have been studying climatology for about 45 years - since I started my undergraduate program. I have seen all the attempts to discredit the science, even as I have seen the science develop. For me, the first IPCC reports represented a summary of what I had already learned about climatology over a period of 15 years - not a news story. The attacks on the science grew exponentially as the science grew stronger.
I said above that I always keep in mind "what if I am wrong?", but I have very little doubt that that massive efforts were made by the fossil fuel industry to deflect risks to their business model. They did not develop the skills on their own - they had decades of tobacco industry activity as a guideline to what worked and what did not.
Have you ever read Chris Mooney's The Republican War on Science? It details how similar approaches have been taken by right wing politics and industry for a wide variety of topics. This did not start with climate science.
Not all people want the same things for their children and grandchildren. Maybe try following the link I gave above to The Authoriarians - or go directly to the link on that page that has a more recent discussion of Bob Altemeyer's new book in the context of other books on Donald Trump. Read that, and ask, what does it suggest about the Trump family's desires for its children and grandchildren? I'm willing to bet that it is not the same as yours.
https://theauthoritarians.org/updating-authoritarian-nightmare/
- The New Climate War by Michael E. Mann - our reviews
Micawber at 03:04 AM on 8 June, 2021Michael Mann is correct in thinking that our information is totally controlled by media giants.
Scientists are charged to read their own publications and “peer reviewers” stack the peers so that no new ideas can get through. Rarely if ever do you find references to key earlier work by retired or deceased scientists. I give a few examples.
Microsoft Office still uses years beginning 1 January 1900. They charge for updates but still have a fatally flawed program. Why is he allowed to pose as a scientist and innovator?
Even David Keeling was nearly prevented from continuing verification of CO2 infrared heat blankets by rigged peer review. He gives a vivid account in his autobiographical review:
Keeling, C. D., 1998, Rewards and Penalties of Monitoring the Earth, Ann Rev. Energy Env, 23(1), 25-82, doi:10.1038/nature105981.
Blair Kinsman had earlier shown how the misuse of statistics and inability to take daily validation data could mislead to wrong conclusion. Unlike in lab experiments geophysical data once not taken cannot be repeated at will. This has happened with our gross neglect of near surface ocean data where is located most anthropogenic heat.
Kinsman, B. 1957, Proper and improper use of statistics in geophysics, Tellus 9(3), 408-418, doi:10.1111/j.2153-3490.1957.tb01897.x
Free access sci-hub.do/10.1111/j.2153-3490.1957.tb01897.x
"The dangers facing the earth's ecosystems are well known and the subject of great concern at all levels. Climate change is high on the list. But there is an underlying and associated cause. Overpopulation."
Sir David Attenborough https://www.youtube.com/watch?v=JRPmLWYbUqA
"Can you think of any problem in any area of human endeavor on any scale, from microscopic to global, whose long-term solution is in any demonstrable way aided, assisted, or advanced by further increases in population, locally, nationally, or globally?"
"The Greatest Shortcoming of the Human Race is our Inability to Understand the Exponential Function" Bartlett, Albert A., 1979
www.youtube.com › watch › v=F8ZJCtL6bPs
Wherever humans are involved we HAVE the Weimar greed equation. Better snap up fish stocks, or oil or whatever before someone else grabs it.
Graham Hancock has beeN ridiculed for suggesting there was a great civilisation as early as 400,000 years ago. Yet there are pyramids dated 130,000 years old in the Mississippi basin. Genetics link Oceania to S America. The compact nature of the Antikythera Clock suggest it was used for navigation. Why else would one cram a complete astronomical clock into a case the size of a sextant? The clock could predict lunar eclipses 78 years ahead as well as their colour. Many wheels have prime number of gears to give highly accurate astronomical times. There were even wheels for the Olympic and other games. Silicon valley may think of it as a mechanism or computer. But it was a clock long before Harrison’s. Such sophistication suggests many years development. It clearly could not have sprung up 350BC, any more than modern printed circuits could have been envisioned in 1957.
Sealevels averaged 50m below present in prehistory before 1750AD. There were many rich landmasses where merchant sailors could establish empires. They were wiped out by catastrophic sea level rise both cyclical and from asteroid impacts. We are at the top of earth’s remaining peaks.
https://www.youtube.com/watch?v=bAqqA3fMwI8
Melting ice of Greenland and Antarctica is proceedING exponentially leading to rapidly rising sealevels, floods and storms as well depleted fish stocks.
Waters around Faeroes does not get cold enough for cod and halibut to breed. They need to be at least 10 years old before they start. (netflix seaspiracy)
The north sea herring disappeared before 1950s, the Newfoundland cod in the 1980s. Gunboat diplomacy could not save them.
What do you think we should do? Perhaps include the equatorial undercurrent in climate models?
There has been too much about hot air instead of hot water.
I have not heard Dr Mann mention this. There are none so blind as those who will not see.
There needs to be a real focus on what the great oceans are telling us. - Greens: Divided on ‘clean’ energy? Or closer than they appear?
Greg at 06:20 AM on 23 May, 2021Having been around since FDR was US President, and having been a Republican, an Independent and a Democrat, I have seen and experienced many ups and downs with how things are going in the US, but the existential threat posed by climate change is by far the greatest threat that we will all face. When I talk to people about climate change, whether they are deniers or not, I ask them if they have noticed changes in the climate, regardless of the cause. The answer is usually yes. Then I ask if they think humans are contributing at all to the problem. Most are now saying yes, and for those who say yes and are on the denier side of the coin, their response is usually followed by saying there is not much they can do regarding climate change anyway. Unfortunately, nearly all Americans do not understand the causes of climate change nor do they understand the pros and cons of alternative actions that could be taken to eliminate the production of greenhouse gases. This, I believe, is due primarily to misinformation from Big Oil and politicians, whose interest in wealth, power and profit undermine attempts of obtaining a sustainable and acceptable future for us all. So, for those who feel there is nothing they can do, I tell them there is a very easy and significant first step they can take now and that is to not vote for ANY Republican politician (Representatives, Senators, Delegates, etc., at both the State and Federal level) who are lawmakers for at least the next decade. Even though their body language or verbal response indicates that there may be some truth to that position, their body language or verbal response indicate that that will never happen.
So, is there any hope? Yes, I am seeing a glimmer of hope coming from a strange place – the recent announcement that the Ford F150 Lightening pickup truck coming out at the end of the year (the F-150 product line is a multi-billion dollar business for Ford and is popular with many – over 750,000 sold last year). This is not a Ford commercial. Also, the more electric vehicles sold, the more it will help shift the momentum to electric vehicles. And, whether Ford, Tesla, VW, Volvo, etc., more charging stations will be needed and more people will feel comfortable with electric cars. Hopefully, it will help kick off an exponential growth of green vehicles. And, I think that even climate change deniers will buy the new trucks because they can power their table saws at the jobsite, power what they need at campsites, and power key equipment at home when the grid goes down the next time, without saying they are doing it for the climate.
- Is Nuclear Energy the Answer?
michael sweet at 22:51 PM on 9 May, 2021John ONeill:
Here is a free copy of the Sovacool paper apparently my previous link is broken. It took me 15 seconds to find. If you read the literature you would be able to do this yourself. You are welcome to think anything you want. The peer reviewed literature contradicts you. You are sloganeering.
"If we really try to build out wind and solar there will be a substantial decrease in carbon emissions in a short period of time.' That's something I haven't seen, though I rather obsessively scan www.electricitymap.org/zone/JP-KY?wind=false&solar=false for examples of it." italiced is a quiote of me
I provided Uruguay as an example of reduction of carbon emissions from renewable energy. I found this clear example in less than 5 minutes on your reference. This proves that you do not "obsessively scan" for examples. You are simply trolling us.
At 236 you claimed "The BN600 and BN800 in Russia seem to be operating without any leaks or fires" I showed that the BN600 has had at least 14 fires. You are trolling us again.
At 238 you stated:
"'These reactors cost even more to build than normal reactors. They will never be economic. No more are planned worldwide.' - Apart from the one Gates' company is developing, there's one being built in India, and one in China." Italics is you quoting me.
The reactors you cite in 245 are a completely different design and are new, experimental builds financed entirely by the government. They are liquid sodium reactors, but are a different design. As one design fails, nuclear supporters give it a new hat and claim it will finally work. Your current claim that they are the same is false. Construction of the Indian reactor begun in 2007 for completion in 2012. Now due in 2022. Every year they extend the operational date another year. Typical nuclear build.
More renewable energy was installed last year than all other power systems combined.
"IRENA’s annual Renewable Capacity Statistics 2021 shows that renewable energy’s share of all new generating capacity rose considerably for the second year in a row. More than 80 per cent of all new electricity capacity added last year was renewable, with solar and wind accounting for 91 per cent of new renewables." source
At 245 you say:
"Exponential growth [of renewable energy] is easy enough from a small base"
In 2021 wind and solar power generated will surpass nuclear power worldwide. Nuclear currently has a smaller base to ridicule than renewable energy, after 60 years of operation. Nuclear generated less power in 2020 than in 2004. They are not buiding enough nuclear power worldwide to replace retiring reactors. You are trolling us again.
- Is Nuclear Energy the Answer?
John ONeill at 18:04 PM on 9 May, 2021michael sweet at 242
'Sovacool is a peer reviewed scientific study.'
The paper you linked is behind a pay wall, but examples I have given show emissions from electricity generation, at least, are considerably lower in some nuclear-reliant countries than in comparable countries without it. For example, from 2000 to 2019, Germany's electricity generation from fossil fuels went down by 29%, France's ( to 2020) by only 1% ( from 'Our World in Data'). Nevertheless, in absolute terms, Germany was still getting 248 TWh from fossil fuels to France's 50 TWh. The difference in emissions would be even greater, since so much of Germany's power is from lignite, and even their 'renewable' thermal generation has a fairly hefty carbon footprint. The UK, which, unlike Germany, chose to close its coal plants instead of its nuclear ones, saw power from fossils fall by 49% over the same period. In 2020 the UK generated 5 TWh from coal, France 4 TWh, and Germany 134 TWh. (Denmark also made 4 TWh from coal, but it only has a twelfth the population of France or the UK.)
https://ourworldindata.org/fossil-fuels
My scepticism of Ben Sovacool's work stems from a paper he wrote, also peer reviewed, which claimed that nuclear power was responsible for three times as many bird deaths per watt hour delivered as wind turbines. This was based on a single incident of geese hitting cooling towers at a coal plant, and another isolated case of waterfowl dying in a copper mine waste pond. ( His estimates of lifecycle CO2 emissions from nuclear, in another paper, are rather higher than the IPCC's, but not as outrageous as some of the other authors he considers. )
'Uruguay produced 40% of its electricity from wind in 2020 while Sweden produced only 30% of its electricity from nuclear power. If you claim Sweden as a nuclear success than Uruguay has to be a wind success.' I would say that Uruguay is a wind success, but the circumstances allowing that are limited. The world currently gets 86% of its energy from coal, oil and gas, and has done for the last forty years. Wind backed by hydro will not replace that - the gaps in wind power would simply be far greater than hydro could fill. I can't show you a grid running on SMRs yet, but likewise you can't show me one with significant battery storage.
'I provided proof of at least 14 fires at the BN600 plant. Your claim of no fires was false.' I didn't claim they had not had any fires, I said they weren't having any currently. The last leak at the BN600 was in May 1994. https://www.gen-4.org/gif/upload/docs/application/pdf/2019-01/gifiv_webinar_pakhomov_19_dec_2018_final.pdf
'The World Nuclear Organization does not show any of these reactors under construction. Please provide evidence to support your claim that two are under construction.'
'The CFR-600 is a sodium-cooled pool-type fast-neutron nuclear reactor under construction in Xiapu County, Fujian province, China, on Changbiao Island...Construction of the reactor started in late 2017...A larger commercial-scale reactor, the CFR-1000, is also planned...On the same site, the building of a second 600 MW fast reactor CFR-600 was started in December 2020 and four 1000 MW CAP1000 are proposed.'
https://en.wikipedia.org/wiki/CFR-600
The Indian Prototype Fast Breeder Reactor, also sodium-cooled, is scheduled to go critical in October 2022 - though it's been delayed multiple times before. It's intended to close the fuel cycle from India's heavy water reactors, and allow the use of thorium, which India has very large reserves of.
'Worldwide installation of renewable energy is increasing exponentially. Your cherry picking a handful of countries that are not increasing wind or solar this year is simply an attempt to distract which will not work. Any cursory look at data shows that installation of renewable energy is increasing rapidly while nuclear plants are not being started up.'
Exponential growth is easy enough from a small base, but in the real world, it will eventually hit natural limits. In nearly every case, growth in solar has started falling, i.e. it's no longer exponential, when solar provides between five and ten percent of total generation. Wind has double the capacity factor, doesn't regularly drop to zero, and is usually less seasonal. Where there's plenty of hydro as backup, it does, in a few areas, help lower emissions to levels approaching those of a nuclear + hydro grid. In places like Texas or California, where it's backed by gas, average emissions stay higher. Since replacing current power fossil generators is only a small first step - we also need to provide clean power for much of the third world, and we've hardly started on industry and transport - it would be ill judged to rule out the world's second largest combustion-free energy source ( after hydro.) Nuclear can be installed as a plug-in replacement for coal plants, a role unsuited to power sources which spend much of the time powerless.
- Is Nuclear Energy the Answer?
michael sweet at 22:09 PM on 8 May, 2021John Oneill at 238:
Sovacool is a peer reviewed scientific study. You are attempting to substitute your personal opinion unsupported by any data or analysis at all. This is a scientific site. You must provide peer reviewed data to support your wild claims. You are simply sloganeering.
Uruguay produced 40% of its electricity from wind in 2020 while Sweden produced only 30% of its electricity from nuclear power. If you claim Sweden as a nuclear success than Uruguay has to be a wind success. (Our world in data linked below). Both have high hydro.
Nuclear electricity generation is (2020 TWh, 2000 TWh) World 2,616, 2498, France 355, 414 Canada 95, 69 and Sweden 50, 57 TWh our world in data Generation of electricity from wind is (2020 TWh,2000 TWh) World 1590, 31, France 39,0.04, Canada 34, 0.16, Sweden 27, 0.46, US 336, 6, Uruguay 5.5, 0, Denmark 16, 4. IBID
This data shows that worldwide nuclear is reducing or flat and everywhere is building out wind. Solar is much the same. Sweden and France are slowly shutting nuclear plants as renewable energy comes online. That allows them to progressively reduce carbon emissions while switching to renewable energy.
Talk to me about small modular reactors when they have a working pilot plant. That will be in 2029 at the earliest. Utilities are backing out of the NuScale project because of cost. Safety questions remain.
At 236 you said:
"The BN600 and BN800 in Russia seem to be operating without any leaks or fires - unlike some of the new grid storage battery plants,"
I provided proof of at least 14 fires at the BN600 plant. Your claim of no fires was false. I have to Google everything you say. They have to build expensive, duplicate cooling systems so that they can repair the fire damage without shutting down the entire plant. It is uneconomic to build duplicate cooling systems. The World Nuclear Organization does not show any of these reactors under construction. Please provide evidence to support your claim that two are under construction.
Worldwide installation of renewable energy is increasing exponentially. Your cherry picking a handful of countries that are not increasing wind or solar this year is simply an attempt to distract which will not work. Any cursory look at data shows that installation of renewable energy is increasing rapidly while nuclear plants are not being started up.
- The top 10 weather and climate events of a record-setting year
JWRebel at 18:19 PM on 22 December, 2020Expressing damages in dollar values has always struck me as a somewhat tenuous exercise, though seemingly exact and professional. To begin with, damages go up and down with currency crosses. Damages in China will have increased exponentially with the economic juggernaut of the past 35 years. In the US properties have appreciated tremendously with low interest policies since 2000. As an area is more intensely populated with more infrastructure, the damages increase commensurately, although affected areas are of course randomly targeted, making the damage amount random as well. In third world countries such as Mozambique or India where a lettuce costs 2¢, a hotel swept away is worth only 1% of what the same structure would cost in the USA.
In short, dollar price forms a somewhat inadequate measure to express impacts and damage; and as such a relatively inappropriate yardstick for assessing the increasing impact of weather catastophes with a climate-change backdrop. - What Tucker Carlson gets wrong about causes of wildfires in U.S. West
Daniel Bailey at 03:35 AM on 7 October, 2020JoeZ, increased forest fire activity across the western U.S. in recent decades is due to a number of factors, including a history of fire suppression and human encroachment in forest regions, natural climate variability, and human-caused climate change. Forest management would help in some areas, however the wildfire numbers and burned area are also increasing in non-forest vegetation types. Wildfire activity appears strongly associated with warming temperatures (California spring/summer temperatures have increased by more than 5 degrees Fahrenheit since 1970) and earlier spring snowmelt.
Source: NASA
"For all ecoregions combined, the number of large fires increased at a rate of seven fires per year, while total fire area increased at a rate of 355 km2 per year. Continuing changes in climate, invasive species, and consequences of past fire management, added to the impacts of larger, more frequent fires, will drive further disruptions to fire regimes of the western U.S. and other fire-prone regions of the world."
https://agupubs.onlinelibrary.wiley.com/doi/full/10.1002/2014GL059576
Since the 1980s, the wildfire season has lengthened across a quarter of the world's vegetated surface.
"We show that fire weather seasons have lengthened across 29.6 million km2 (25.3%) of the Earth’s vegetated surface, resulting in an 18.7% increase in global mean fire weather season length. We also show a doubling (108.1% increase) of global burnable area affected by long fire weather seasons (>1.0 σ above the historical mean) and an increased global frequency of long fire weather seasons across 62.4 million km2 (53.4%) during the second half of the study period."
https://www.nature.com/articles/ncomms8537
"The start of the Southwestern fire season—as indicated by the date of first large-fire discovery—has shifted more than 50 days earlier since the 1970s, accounting for about one-third of the increase in the length of the fire season. The substantially earlier SW fire season start is consistent with warmer temperatures and earlier spring seasons leading to earlier flammability of fuels in SW forests."
https://www.ncbi.nlm.nih.gov/pmc/articles/PMC4874415/
"Anthropogenic increases in temperature and vapor pressure deficit significantly enhanced fuel aridity across western US forests over the past several decades and, during 2000–2015, contributed to 75% more forested area experiencing high (>1 σ) fire-season fuel aridity and an average of nine additional days per year of high fire potential.
Anthropogenic climate change accounted for ∼55% of observed increases in fuel aridity from 1979 to 2015 across western US forests, highlighting both anthropogenic climate change and natural climate variability as important contributors to increased wildfire potential in recent decades.
We estimate that human-caused climate change contributed to an additional 4.2 million ha of forest fire area during 1984–2015, nearly doubling the forest fire area expected in its absence.
Natural climate variability will continue to alternate between modulating and compounding anthropogenic increases in fuel aridity, but anthropogenic climate change has emerged as a driver of increased forest fire activity and should continue to do so while fuels are not limiting."
https://www.pnas.org/content/113/42/11770
"By 2100, if greenhouse gas emissions continue to rise, one study found that the frequency of extreme wildfires would increase, and the average area burned statewide would increase by 77 percent. In the areas that have the highest fire risk, wildfire insurance is estimated to see costs rise by 18 percent by 2055. "
https://climateassessment.ca.gov/state/overview/#wildfire
"The clearest link between California wildfire and anthropogenic climate change thus far has been via warming-driven increases in atmospheric aridity, which works to dry fuels and promote summer forest fire, particularly in the North Coast and Sierra Nevada regions.
Importantly, the effects of anthropogenic warming on California wildfire thus far have arisen from what may someday be viewed as a relatively small amount of warming. According to climate models, anthropogenic warming since the late 1800s has increased the atmospheric vapor-pressure deficit by approximately 10% and this increase is projected to double by the 2060s. Given the exponential response of California burned area to aridity, the influence of anthropogenic warming on wildfire activity over the next few decades will likely be larger than the observed influence thus far where fuel abundance is not limiting.
Since the early 1970s, California's annual wildfire extent increased fivefold, punctuated by extremely large and destructive wildfires in 2017 and 2018. This trend was mainly due to an eightfold increase in summertime forest‐fire area and was very likely driven by drying of fuels promoted by human‐induced warming. Warming effects were also apparent in the fall by enhancing the odds that fuels are dry when strong fall wind events occur.
The large increase in California’s annual forest-fire area over the past several decades is very likely linked to anthropogenic warming.
Human‐caused warming has already significantly enhanced wildfire activity in California, particularly in the forests of the Sierra Nevada and North Coast, and will likely continue to do so in the coming decades."
https://agupubs.onlinelibrary.wiley.com/doi/abs/10.1029/2019EF001210
Wildfire mitigation efforts can reduce wildfire intensity and severity while improving forest resilience to fire, insects and drought. The total area burned by wildfires is a trend driven by the warming climate (which is warming because of human activities), so mitigation efforts will not likely be able to affect the total area burned trend.
https://link.springer.com/article/10.1186/s42408-019-0062-8
Droughts in the Southwestern US have been made nearly half-again worse by human activities and are projected to worsen yet.
https://science.sciencemag.org/content/368/6488/314
These droughts couple with rising temperatures, reduced soil moisture and lower humidity to kill vast amounts of trees, providing an ever-increasing amount of fuel loads for wildfires.
https://science.sciencemag.org/content/368/6488/238
California’s frequency of fall days with extreme fire-weather conditions has more than doubled since the 1980s. Continued climate change will further amplify the number of days with extreme fire weather by the end of this century.
https://iopscience.iop.org/article/10.1088/1748-9326/ab83a7

https://twitter.com/CAL_FIRE/status/1311722710284693505
There is strengthened evidence that climate change increases the frequency and/or severity of fire weather around the world. Land management alone cannot explain recent increases in wildfires.
Analysis shows that:
• Well over 100 studies published since 2013 show strong consensus that climate change promotes the weather conditions on which wildfires depend, enhancing their likelihood.
• Natural variability is superimposed on the increasingly warm and dry background conditions resulting from climate change, leading to more extreme fires and more extreme fire seasons.
• Land management can enhance or compound climate-driven changes in wildfire risk, either through fuel reductions or fuel accumulation as unintended by-product of fire suppression. Fire suppression efforts are made more difficult by climate change.
• There is an unequivocal and pervasive role of climate change in increasing the intensity and length in which fire weather occurs; land management is likely to have contributed too, but does not alone account for recent increases in wildfire extent and severity in the western US and in southeast Australia.
Human-induced climate change promotes the conditions on which wildfires depend, enhancing their likelihood and challenging suppression efforts. Although the global area burned by fires each year is declining, the majority of this trend is explained by conversion of natural savannahs and grasslands to agriculture in Africa (Andela et al. 2017). In contrast, the area burned by forest wildfires is increasing in many regions, including in the western US and southeast Australia.
• “Fire weather” refers to periods with a high likelihood of fire due to a combination of high temperatures, low humidity, low rainfall and often high winds.
• Human-induced warming has already led to a global increase in the frequency and severity of fire weather, increasing the risks of wildfire.
• Land management can ameliorate or compound climate-driven changes in wildfire risk.
• Wildfires can have broad impacts for human health and wellbeing and for the natural environment.
US fires:
• Fire weather has become more frequent and intense in western US forests.
• Fire weather is driving more wildfire activity in western US forests.
• Demographic factors alone cannot account for the magnitude of the observed increase in wildfires in the western US, but increased population leads to greater impacts.
• Land management practices are contributing factors, but cannot alone explain the magnitude of the observed increase in wildfires extent in the western US forests in recent decades.
Australia fires:
• The scale of the 2019–2020 bushfires was unprecedented.
• Fuel management through prescribed burns and improved logging practice cannot fully mitigate increased wildfire risk due to climate change.
• Extreme weather and Pyroconvection are projected to increase wildfire risk under future climate change in southeastern Australia.
Scientific evidence that climate change is causing an increase in the frequency and extent of fire weather, contributing to extreme wildfires around the world, continues to mount.
The severe droughts in the USA and Australia are signs that the tropics, and their warm temperatures, are expanding in the wake of climate change, due to the warming of the subtropical ocean.
https://public.wmo.int/en/media/news/climate-change-increases-risk-of-wildfires
https://sciencebrief.org/topics/climate-change-science/wildfires
https://sciencebrief.org/briefs/wildfires
https://news.sciencebrief.org/wildfires-sep2020-update/
PDF here
Climate change will continue to drive temperature rise and more unpredictable rainfall in many parts of the world, meaning that the number of days with “fire weather” – conditions in which fires are likely to burn – is expected to increase in coming decades.
- Breathing contributes to CO2 buildup
CD at 02:26 AM on 11 September, 2020You can’t use the carbon cycle to prove that human respiration isn’t increasing CO2 levels in the atmosphere because the carbon cycle only describes the steady state. As others have already noted, the human population has grown exponentially over the last 100 years. It has almost quadrupled since 1920. That is not a system operating in the steady state or at long-term equilibrium.
To put it simply, the carbon cycle describes five carbon reservoirs (vegetation, animals, soil, the ocean and the atmosphere) all of which also act as carbon pumps. Moreover, these five reservoirs are all interconnected, and the pumping capacity of each depends on their size. Generally, the bigger they are, the more carbon they pump. That means that changing the size of one will change the size of all the others in order to balance pumping rates and conservation of mass. This will happen as the system seeks to find a new equilibrium position. So an increase in the human population affects everything else. It changes the pumping rates and it changes the relative size of the other reservoirs. And the thing is, we can estimate what size this change might be.
As the average 70 kg person generates about 1 kg of CO2 per day, that means they transfer 100 kg of carbon to the atmosphere every year. With nearly 8 billion people on the planet that equates to about 0.8 GtC per annum (GtC = gigatonne of carbon).
But that is not all. The average person probably eats their own bodyweight in meat every year. So the growth in the human population since 1920 must be reflected in the growth in the number of farm livestock. If we assume 2 kg of livestock per 1 kg of human (i.e. a 2 year supply of meat in production), then the overall CO2 production from both is 2.4 GtC per annum. This is about a quarter of our fossil fuel CO2 output. So is this directly increasing atmospheric CO2 levels as some climate deniers might claim? The answer is no, or at least not directly.
Some people have suggested that the increases in human and livestock CO2 emissions are offset by increased crop production. Their argument is that, as all the carbon we breathe out comes from crops, any increase in the CO2 produced by the human population will be offset by a commensurate increase in crop production required to feed the extra humans and their livestock. This is not true either.
Increased crop production comes at the expense of other types of vegetation (e.g. forests). The total area under human cultivation may increase, but the total amount of land and vegetation won’t. Deforestation in the Amazon region to grow crops and farm cattle does not increase the rate of CO2 capture in the region. If anything, it decreases it.
Increasing the number of animals does not increase the amount of vegetation or its growth rate. Instead it decreases the amount of carbon going into the soil. Animals eat plants before those plant can die and before they can decay in the soil. This means that animals replace the CO2 producing capacity of the soil. That is where the substitution occurs. And if the pumping efficiencies of both animals and the soil were the same then nothing much would change as the animal population increases. But they aren’t the same.
The carbon pumping efficiency of the soil is only 4%. The soil contains over 1500 GtC but emits 60 GtC per annum. Humans store only 0.1 GtC but emit 0.8GtC per annum. That is an efficiency of 800%. It also means that the increase in CO2 production from humans and livestock is the same as that produced by about 4% of the Earth’s soil. That means that the total volume of soil must reduce by 4% over time as its pumping capacity is replaced by animals and as the volume of carbon entering the soil decreases. So 60 GtC will be lost from the soil while only 0.1 GtC will be transferred to animals and none to plants. There is only one other place that most of the 59.9 GtC can go: the atmosphere. This 59.9 GtC will increase the atmospheric CO2 concentration by about 30 ppm.
So the human population increase could have increased atmospheric CO2 levels by up to 30 ppm over time, and about 20 ppm since 1920. Is this an upper estimate? Yes, probably. It assumes that the growth in the human population and farming livestock is a net gain and does not merely substitute for loss of other species. But we know this is not true. Humans and their livestock do displace other creatures to some extent. It also omits any additional loss of CO2 to the oceans and changes to vegetation volumes through loss of soil and increases in CO2. But what it does demonstrate is that when the human population changes, everything else changes.
- Book review: Bad science and bad arguments abound in 'Apocalypse Never' by Michael Shellenberger
Postkey at 07:15 AM on 22 July, 2020" . . . economic growth has been on a falling trajectory in America . . . "
Due to a rising ECoE (the Energy Cost of Energy)?
'The first principle is that all forms of economic output – literally all of the goods and services which comprise the ‘real’ economy – are products of energy.
Nothing of any economic value or utility can be supplied without using energy. . . .
If you want a succinct answer to this question, it is that ECoE (the Energy Cost of Energy) is rising, relentlessly and exponentially. The exponential rate of increase in ECoE means that this cannot be cancelled out by linear increases in the aggregate amount of total or gross (pre-ECoE) energy that we can access. The resultant squeeze on surplus energy has been compounded by increasing numbers of people seeking to share the prosperity that this surplus provides.
As a result, prior growth in prosperity per person has gone into reverse. People have been getting poorer in most Western advanced economies (AEs) since the early 2000s. With the same fate now starting to overtake emerging market (EM) countries too, global prosperity has turned down. One way of describing this process is “de-growth”. '
- Models are unreliable
OH YES at 08:08 AM on 4 April, 2020Dr Michael Mann produced his "iconic" hockey stick graph ( model ) while working with the IPCC , which showed an exponential increase in global temperatures predicted .Dr Tim Ball publicly stated " Mann belongs in the state pen , instead of Penn State , because his model is a fraud , and his work was paid for by American taxpayers .Mann sued Ball for libel , in the supreme court of Canada ( Ball is Canadian) .Mann refused to show his raw data to the court , after 8 years of proceedings .Mann was charged with contempt of court for this . Ball was awarded all court costs , because he won the "Truth decision". Why was this climate change "trial of the century not " widely publicized ? It does not fit the government's agenda ! See the entire details at " Principia Scientific" .
- 2020 SkS Weekly Climate Change & Global Warming News Roundup #5
nigelj at 09:56 AM on 2 February, 2020A useful book is "The Tipping Point, by M Gladwell". It describes how trends simmer way for years with little or no momentum then theres a tipping point where change is rapid often exponential. One new factor comes along that can hugely invigorate the trend. That new factor doesn't have to be huge, but it does has to have the right characteristics, be at the right time, and have a popular connection with the public.
They use examples from fashion, epidemiology of disease spread, spread of new educational ideas and some other stuff I think. One amusing example is hush puppy shoes that were never really fashionable until a group of kids started wearing them as an anti fashion statement. Sales increased over a couple of years then exploded with youth, as the idea became popular. it was the idea that connected.
So Greta Thunberg could potentially fit the description of the start of a tipping point but only time will really tell.
Right that's me done for the day.
- Human CO2 is a tiny % of CO2 emissions
Eclectic at 08:51 AM on 11 November, 2019Kiwironnie, for convenience we probably should revert to using GigatonsCarbon (GtC) rather than CO2 mass. Particularly so, when discussing the biomass which is absorbing (very roughly!) 25% of the fossil CO2 emissions.
You will find a vast amount of discussion of the topic of atmospheric residual CO2 emissions and of the oceanic absorption of CO2.
Absorption of CO2 by rock weathering is far too slow to contribute to the short term (a century or two) picture.
As you say, that leaves [excuse pun] the increase of plants as the third factor. Can you think of another factor that would absorb or sequester additional carbon?
Land-based plants are the predominant biomass; bacteria/ fungi/ animals are only a small contributor to biomass, relatively. (Note that modern agriculture tends to reduce soil fungal mass.)
Zaichun Zhu et al., 2016 estimates plant biomass in the region of 450~500 GtC . . . which we must compare with 10 Gtc of fossil carbon emissions as an annual output.
I have not seen a quantification of the (satellite-observed) "greening of Earth". Area of leaf (as leaf area index) has increased distinctly over the past 30+ years. But what about plant biomass ~ which would seem beyond the satellites' capabiity? Example case: rainforest clearing is presumably a carbon "negative" compared with the establishment of pastures or palm oil plantings, which have lower biomass.
From all this, it would seem that we should not expect an exponential "absorption feedback" from plant biomass increase. We will be fortunate if there is a linear biomass increase! ( I haven't found the source, but I recall a recent report that the observed "rate of greening" is slowing down ~ so I don't know if that was a reliable observation, despite its plausability, and neither do I know the more important relation to actual biomass.)
Ceiling capacity for plant biomass is a difficult question. There was a huge plant biomass back in the Carboniferous era. However, conditions are vastly different in the modern era, for plant biomass is greatly reduced by the presence of vertebrate herbivores nowadays (plus other human actions . . . including the food consumption by that "megafauna" called humans).
And judging from the long-term upward trend of the Keeling Curve, we cannot expect that a planetary greening will be of major benefit in reducing the CO2 / Global Warming problem.
- CO2 effect is saturated
Bob Loblaw at 01:35 AM on 26 September, 2019GwbS@542:
Please do not make strawman arguments. I explicitly said that the diagram in comment 529 applies to the absorption ONLY of radiation, and that I have not considered emission. In comment 534 I give a list of other factors that must be considered. #3 is the mission of radiation. You do yourself no favours by arguing against a position that I have explicitly addressed as incomplete. When ONLY considering absorption, the decay is indeed exponential, and when considering the probabilty of a surface-emitted photon reaching space in one step, absorption is the only relevant factor. Photons emitted in the atmopshere above the surface are - by definition - not emitted from the surface..
You also refer to "reflected" IR radiation. IR radiation is not reflected. Reflection results in photons travelling in a different direction, but remaining at the same wavelength/frequency as they were before reflection. IR radiation is first absorbed, then re-emitted. The emission, as others have stated, is not dependent on the wavelength of the radiation that was absorbed - it depends on the temperature and characteristics of the molecule that is doing the emitting.This may be another CO2 molecule, but it may also be another greenhouse gas. It almost certainly won't be the exact same molecule that did the absorbing. This distinction between "reflection" and "absorption/re-emission" is critical in understanding atmospheric radiation transfer, and you do yourself no favours by conflating the two.
In 547, you state "They may be absorbed, but are emitted again within a fraction of a second". This is basically true, but the amount of time it takes a CO2 molecule to lose the energy by collision is a lot shorter than a "fraction of a second". Eli Rabett has done the math for us:
http://rabett.blogspot.com/2013/04/this-is-where-eli-came-in.html
The time estimate between collisions is 10 us. A CO2 molecule that absorbs IR radiation almost always loses it to other molecules via collision. CO2 molecules that emit IR radiation are almost alwys getting that energy from other collisions.
You also state "the fraction exiting at the top is inversely proportional to the length of the column (or the density)." Physical measurements in units of distance are irrelevant. What matters is the number of particles/molecules/etc. along a path. This varies with altitude depending on the local absolute concentration (not ppm, but molecules/unit volume).
Proper radiation calculations take this into effect.
I repeat what I said in post 534: "The only "saturation" that occurs is for useless and innacurate descriptions of the process." That specific wavelengths show zero direct tranmission of radiation from the surface to space is not an argument against the effects of increasing atmospheric CO2.
- CO2 effect is saturated
GwsB at 20:29 PM on 23 September, 2019The two figures in post 542 were not copied. They seem to be in the wrong format. I refer the reader to Figure 6(c) in Zhong & Haigh (2013) "The greenhouse effect and carbon dioxide" for the first figure, see https://rmets.onlinelibrary.wiley.com/doi/10.1002/wea.2072
The second figure is less important. It shows an approximation to the first figure in terms of exponential curves. The reader can make these approximations himself if she is interested. I am unfortunately not able to insert the pdf file into this window.
- CO2 effect is saturated
GwsB at 19:49 PM on 23 September, 2019Bob Loblaw's curves in 529 exhibit exponential decrease. The decrease actually is a power law, more precisely the fraction exiting at the top is inversely proportional to the length of the column (or the density). If photons only travel upwards there would be exponential decrease. However photons are emitted by the CO2 molecules in all directions.
Here is the argument for (the discrete version of) 20 layers, which I number by 0 ... 19 from bottom to top. Bottom is the surface of the earth, top is outer space. Each layer contains the same amount of CO2. The argument is schematic. At the end of the post I come back to the topic of saturation.
Assume at level k there are 20-k photons for k=0, ..., 19. Half the photons jump downwards (to k-1) half upwards (to k+1). So level k loses all 20-k photons, but receives (21-k)/2 photons from its neighbour below and (19-k)/2 from its neighbour above. Thus it ends up with 20-k photons. This is the steady state. The bottom level, k=0, and the top level, k=19, need special consideration. These two levels form the boundary of the system.
1) At level k=0 half the photons go down into the earth and leave the atmosphere, and half go up to level 1. On the other hand level 0 receives 19/2 photons from level 1. In order to have a steady state we must assume an influx of 21/2 photons from the earth (due to heat radiation of the earth).
2) At level 19 there is one photon. Half this photon goes up into outer space, half down to level 18. Level 19 receives 2/2 photons from level 18 and none from outer space. So it ends up with one photon. Steady state.
The full picture is: At each step there is an influx of 21/2 photons from earth (due to the heat of the earth) to level zero and an outflow of 10=20/2 photons from level zero to the earth and an outflow of 1/2 photon from level 19 to outer space. That results in a steady state.
This description agrees with observations. Doubling the length of the cylinder (or the density of CO2) will reduce the amount of radiation into outer space by 50%.
The actual situation is more complicated. At each level there are millions of photons. Each photon flips a coin to decide whether it takes a step upwards (if the coin shows heads) or a step downwards (if the coin shows tails).
The actual situation is more complicated. The photon will travel a random distance in a random direction (uniformly distributed over the unit sphere) before being absorbed. The distance is in the order of ten meters, the time between being absorbed and re-emitted is of the order of 100 femtoseconds. Since the photon moves at the speed of light the whole random walk from leaving the heat bath of the surface of the earth until returning to the earth or flying off into outer space occurs in a twinkle of the eye. On my imac I can simulate a hundred thousand such random walks in a matter of minutes using a program of twenty lines of code in R.
Actually it might be better to speak of reflection. CO2 reflects some of the photons back to earth and others manage to pass to outer space. We speak of saturation if 99% or more of the photons are reflected back to earth, equivalently if 1% or less of the photons manage to escape to outer space.
The figure below gives a good picture of the effect of an increase of the amount of CO2 for different wave numbers. The proportion which manages to escape depends on the density of CO2 and on the wavelength of the photon. At wavelength 15 μm (650-680 cm-1) there is saturation. In the shoulders we are close to saturation. Doubling the density of CO2 will halve the number of photons which manage to escape. In the far wings the majority of the photons manage to escape and only a small proportion is reflected back to earth. Doubling the intensity will double the number of photons reflected back to earth. This also holds for the 10 μm wavelength (the red curve for wave number 850-1100).
If one makes plots for these different wavelengths with the amount of CO2 on the horizontal axis and the number of photons reflected back to earth on the vertical axis, and if one uses a logarithmic scale on the horizontal axis and a linear scale on the vertical axis, one obtains the plot below:
The curves are exponential curves because of the logarithmic scale on the horizontal axis. The black, sky blue and green curves have the form y=a-exp(-c(x-b)) where $x$ varies from 1 to 6. The constant a, b and c depends on the colour: a=0 (black), a=8.5 (sky blue) and a=9 (green). The red blue and pink curve have the form y=a+exp(c(x-b)). In the plot below the coefficients a, b and c have been chosen so as to get a reasonable fit.
The plot at the top is Figure 6(c) in Zhong & Haigh (2013) "The greenhouse effect and carbon dioxide". The plot at the bottom is a free hand fit by exponential curves. At present the contribution for the six wave number intervals is approximately the same. Saturation holds at the central interval, but not yet at the shoulders. The contribution of the wings will become predominant if the amount of CO2 passes the level 40 000 ppmv, when CO2 makes up more than 4% of the atmosphere. At that moment saturation holds at the shoulders. The instantaneous radiative forcing is approximately 9 for all five curves which adds up to 45 (see Figure 5(b) in Zhong & Haigh) which corresponds to an increase in temperature of 11K. That increase is without feed back effects.
- 'Trollbots' Swarm Twitter with Attacks on Climate Science Ahead of UN Summit
Jim Hunt at 06:09 AM on 18 September, 2019In a strange coincidence over recent days I have been following the exponential growth across a variety of media of a meme alleging that:
A ship carrying passengers who included a group of ‘Climate Change Warriors’ who are concerned about melting Arctic ice got stuck in the ice halfway between Norway and the North Pole.
You can read all about it here:
http://GreatWhiteCon.info/2019/09/ship-of-fools-iii-escapes-arctic-sea-ice/
Needless to say the "story" is a most egregious example of the current outbreak of "fake news" described above.
One of the alleged trollbots even had the audacity to claim to be the 45th President of the United States of America!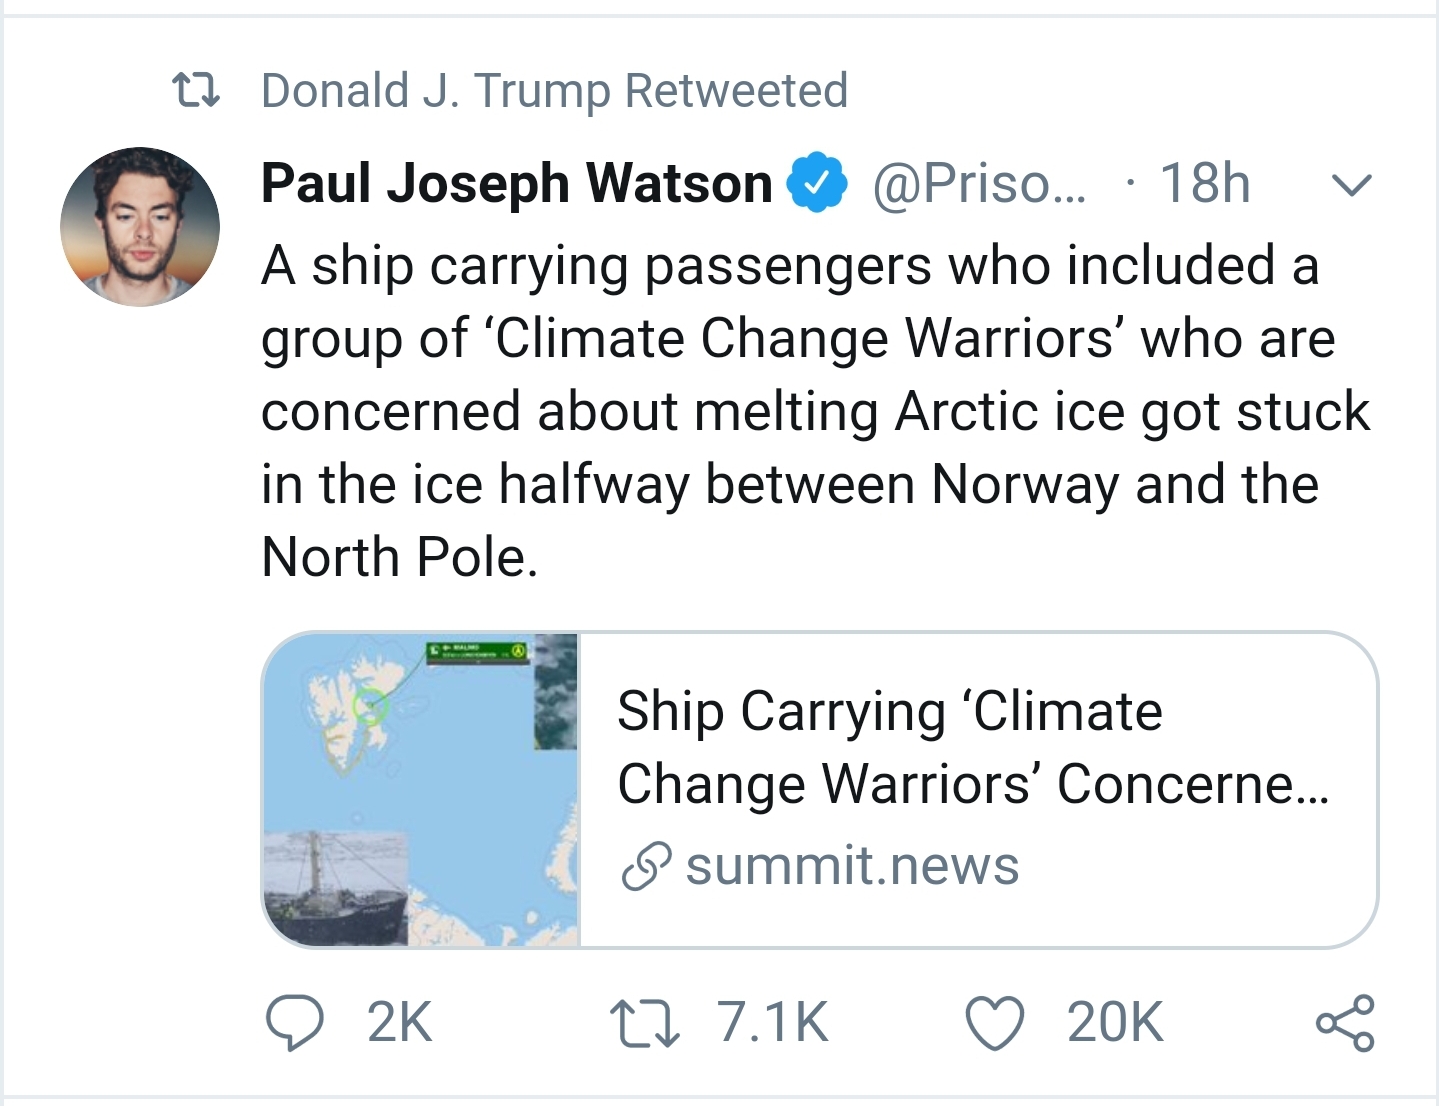
- Residence Time and Prof Essenhigh
daveburton at 00:54 AM on 24 August, 2019Eclectic wrote, " ...the 500ppm figure that the model indicates cannot be exceeded under Dr Spencer's stated conditions of artificiality."
Dr. Spencer's simple model does not say that 500 ppmv can never be exceeded under any circumstances. But if emissions are held steady at 10 Gt/year, atmospheric CO2 level will level-off at just shy of 500 ppmv.
That should not surprise you. It is a natural result of the historically-verified fact that when CO2 levels go up, so do CO2 removal rates. That simple fact, alone, even without reference to a particular quantified model, ensures that a constant CO2 emission rate must result in a plateau in CO2 level.
Do you have an electric stove or toaster? Even though you keep pumping electricity into the nichrome wires, the temperature levels off, and ceases to rise. That's simply because the rate of energy loss rises with the temperature. So the temperature plateaus as it approaches equilibrium: the level where incoming and outgoing energy flows are balanced.
Since the rate of CO2 loss from the atmosphere rises with the CO2 level, the CO2 level must plateau, as it approaches the level at which the flows of CO2 into and out of the atmosphere are the same.MA Rodger wrote, "This is plainly nonsense. Where does all this extra carbon accumulate?"
It's not nonsense, it's fact.
The extra carbon migrates to other reservoirs, like the oceans (the biggest), soil, marine sediments, etc. Those reservoirs dwarf the amount of CO2 in the atmosphere, and, importantly, dwarf the amount of carbon available in recoverable fossil fuels.
MA Rodger wrote, "if humanity restricts itself to pumping 10Gt(C)/year ... continuing year-after-year for ever-&-ever-&-ever..."
Fossil fuels are a finite resource. So we obviously will not (cannot!) continue to emit 10 GtC/yr from fossil fuels "for ever and ever."
Have you never wondered why most people assume CO2 levels won't ever exceed 600-800 ppmv? It's because for CO2 levels to continue to rise at their current rate, CO2 emissions must continue to accelerate — and resource constraints ensure that that can't continue forever. So the rise in CO2 levels must taper off.
What's more, even if CO2 emissions accelerate fast enough to maintain the current growth rate in atmospheric CO2 level, that would mean CO2's climate forcing trend will fall below linear. Since the warming effect of CO2 is logarithmically diminishing, in order to maintain a linearly increasing temperature forcing from CO2, the growth rate of CO2 levels in the atmosphere must increase approximately exponentially.
That is, in fact, what has happened, for the last forty years or so. CO2 emissions have increased so dramatically that CO2 levels have increased on an approximately exponential curve, so the temperature forcing from rising CO2 levels has increased at an approximately linear rate (actually slightly more than linear). You can see that in a graph of log(CO2). Notice how straight the graph is for the last forty years:
https://www.sealevel.info/co2.html?co2scale=2
- Models are unreliable
MA Rodger at 00:39 AM on 14 August, 2019I had a second, more focused look at Sarkomaa & Ruottu (2019) and find it a worthless piece of work.
Clouded by ♥ a confusing use of English & ♥ not-scientific presentation, these elderly Finnish professors provide an account riven with ♥ unsupported but controversial assertions, ♥ silly mathematical constructs and ♥ mathematical models that entirely fail to capture the workings of climate (let alone AGW).
Such a conclusion does need some further demonstrating.
......
♥I don't think their poor use of English needs demonstrating.
♥The lack of scientific presentation is shown many times. As an instance, they insist (p6) that:-
"If all linear radiation coefficients of clouds are set zero, the SRclimate model of Appendix 4 [and of their design] calculates about 100 W/m2 increase of solar energy flux to the ground and about 13 °C increase of the mean temperature of the ground. This agrees with the generally known fact that when cloud comes in front of the sun temperature decreases. Thus, IPCC’s climate change claim should be based on calculations with negative, instead of the positive cloud feedbacks."
Their "generally known fact" is of course simplistic nonsense and the absence of "general agreement" is all too evident in Zelinka et al (2017), a reference cited by Sarkomaa & Ruottu. Yet this diparity is not addressed by Sarkomaa & Ruottu who instead treat us to mention of a peurile interchange with Finish climatologists (p6).
♥The lack of science extends to a large number of obviously unsupported controversial assertions. An example:-
"Figure 1[*] Figure shows that the mean temperature of the ground has been always varied and it is sure, that the variation is going to continue. During the latest 50 thousand years the mean temperature of the ground has increased about 6 ºC and that the increase is going on. On long term decreasing trend can be noticed which is due to inevitable decrease of nuclear reactions in the sun. The hundreds year trends are due to variation of surface temperature of the sun. These variations have nothing to do with CO2 concentration in the atmosphere."
[* on Page 20. Figure plotting global temperatures of last 2Myr based on Snyder (2016), Zachos et al (2008), Lisiecki & Raymo (2005) and 800kyr of Vostok ice core data scaled at 1:2. These first two references contradict the "nothing to do with CO2" assertion.]
♥The nonsense is aided by the use of silly mathematical calculations presented seemingly for no reason. Their equation 4.16a p52 presents an easily understandable example, it being a formula for an average global temperature for time t=0 to t=a obtained by integration over the surface of a sphere. Quite how anyone would obtain formula to use in such an integration of average temperature of a planet (Sarkomaa & Ruottu describe it as being "entirely impossible") or for what purpose they present the formula is not explained.
♥Perhaps their main conclusion is expressed within their blog commentary of their analysis which translated @1145:-
"It follows from Planck's Law and the equation for spectral radiance that the effect of increasing atmospheric carbon dioxide on global temperatures is asymptotic, not progressive."
Here Planck's Law is what within AGW is usually expressed in climatology as the Stefan-Boltzmann relationship although here its exact application is not entirely clear.
"Spectral radiance" is described as "The basic physical concept of radiative heat transfer" (p66) and the "asymptotic" level (which is found to be 288K, the average global temperature which the modelling is set to) appears to be the equilibrium temperature which, of course, will be arrived-at in a manner "asymptotic, not progressive" (as in their eq 5.1) as the equilibrium temperature is approached. The modelling is then used to demonstrate that there will be no significant increase in surface temperature if there is more CO2 in surface air. The result should actually be zero because the air has not been allowed to increase in temperature (the AGW effect is not driven by surface phenomenon) and so cannot have any extra radiative effect to warm the surface. All that happens is the IR path-length decreases within the CO2 absorption bands at the same rate at which the amount of CO2 emiting this IR increases - thus zero effect.
Sarkomaa & Ruottu actually report that in the absence of other GHGs, the "increase of carbon dioxide concentration has strong influence on the mean temperature of the ground." Their Fig 5 p73 is missing the 0.0005 'multiplier' plot but the other plots would suggest a 'climate sensitivity' of 1.0ºC at 0.0005 but this value for 'sensitivity' looks to be increasing exponentially as the 'multiplier' decreases. So if the 'multiplier' were reduced to zero, climate sensitivity (for a CO2 doubling) would be infinite.
But with the 'multiplier' at 1 and GHGs properly represented in their model, the "increase of carbon dioxide concentration has practically no influence on the mean temperature of the ground." Yet, as stated above, given what they are apparently modelling (which is not climate sensitivity), the answer should be zero. - How could global warming accelerate if CO2 is 'logarithmic'?
Roma at 15:37 PM on 17 June, 2019My intuition on the source of “greater then exponential curve” would be to investigate the role that the loss of the soil/carbon sponge Is playing.
- Water vapor is the most powerful greenhouse gas
3-d construct at 20:00 PM on 13 June, 2019I am working on a paper that includes depictions of water vapor's role in our current dire situation, I am experiencing research fatigue and would appreciate constructive comments. In the following excerpt I am attempting to provide clear support to well established facts, but I am encountering source variability. Here goes:
Water vapor is not considered to be a primary forcer in that it does not initiate global thermal loading, even though its presence in the atmosphere has the largest impact.
This may not seem to fully hold when some details are considered. When any hydrocarbon is burnt, water vapor is always a component of the exhaust. This is particularly significant in regard to commercial air travel. High altitude jet exhaust includes both water vapor and aerosols which are perfect in the formation of cirrus clouds in the cold upper troposphere along contrails. This can be augmented by additional water vapor present in a supersaturated state, which seems to be now more and more the case. Such clouds impart a major greenhouse effect. Also, methane emitted there has an easy way into the stratosphere wherein it is oxidized into twice as many water molecules as that of CO2 by the abundant hydroxyl radicals there present. Water vapor in stratosphere has a greatly amplified greenhouse effect. Otherwise, not much water vapor makes it there.
From the above one could argue that it is a prime forcer. However, apart from the effects of air travel, tropospheric effects are mostly short lived. Since its mean residency period is not much more than a week being largely controlled by condensation at tropospheric dew point encounters, it cannot become well-mixed or be independently sustainable. If forcers suddenly decline, it cannot persist or continue to promote other feedbacks. Furthermore, if other forcers dip below baseline values subsequent declines in water vapor will produce a proportional negative feedback. It is powerful, but passive, sort of like when control levers on earth moving equipment are moved by the operator and the hydraulic system performs monumental tasks.
Absolute and relative humidity is highly variable from about 0.01 to 3.0 % typically and to about 4.0 % more exceptionally. However, most of the Earth’s surface is wet and able to produce a pronounced feedback. Also, with elevating condensation threshold zones that are now being seen to develop, the residency time will increase as well the total volume. This could increase its temperature response sensitivity. Certainly, in its reliable and large feedback response to all other longer term forcing factors one could consider it to be a co-forcer.At current climate sensitivity estimates, a doubling of CO2 will add one degree Celcius to the global mean temperature in itself and water vapors total feedback effect, accounting for all iterations of self-looping, will add another 1.7 degrees. Fortunately, it is apparent that the initial feedback is well below unity and self-limiting at about 0.6. If this sensitivity value reaches 0.7, which is at the threshold of becoming exponential, conceivably, by itself, it could go runaway. We don’t need this as CO2 is already sprinting. Apart from possible PTE or early Venusian extremities, it seems that this has not previously happened. Furthermore, Earth’s persistent resiliency while maintaining abundant free water, logically, precludes it.
- 2019 SkS Weekly Climate Change & Global Warming Digest #18
SirCharles at 22:40 PM on 6 May, 2019Climate change and mass extinction are going hand in hand, Nigel. Both are caused by unsustainable growth.
One out of the estimated eight million species are already in jeopardy. Including worms we need for a healthy soil, 75% of insects which are also food for birds, and 25% of all kinds of mamals. Not to forget that species are dying out BECAUSE of climate change. But we also need to stop poisonning our planet with chemicals like the total herbicide Glyphosate.
- Should a Green New Deal include nuclear power?
william at 05:56 AM on 17 April, 2019Nuclear power is relatively safe as long as we have our present economy and infrastructure but we seem to be in the final phase of an exponential growth curve. In the real world of biology, these end in a vertical graph — straight down. Under these conditions, the finance and infrastructure no longer remains to manage these devices and they are likely to all go critical and melt down. This will result in areas around the plants which are no go areas of high level radioactivity. Anyway, on a practical level, even now, wind and solar are financially feasible to replace fossil fuel and energy storage systems are improving by leaps and bounds. We probably do not need nuclear. https://mtkass.blogspot.com/2018/12/energy-storage.html
- 2019 SkS Weekly Climate Change & Global Warming News Roundup #14
william at 05:55 AM on 11 April, 2019As Attenborough says in his latest program, since we first went into space 50 years ago, the population of the world has more than doubled. We are in the last phase of an exponential growt curve. Exponential curves are not bell curves with a smooth rise and then smooth decline. In the real world they rise and then go vertical......straight down. It may already be too late with our friend Trump giving the final nudge over the edge of the cliff. Even with Bernie we my not have been able to save ourselves from our sorry selves. At least we would have had a chance.
- Hopes for our climate future
Nick Palmer at 23:45 PM on 15 March, 2019nigelj@6
"At the very least we need a semi market based mechanism like carbon taxes or cap and trade"
As a minimum. The main problem with the version of the free market we have, and which got exponentially worse since the international deregulation in the 80s, is that it does not really fit the the parameters for what basic economics says is necessary for a free market to run efficiently and safely - full and open knowledge of all aspects of it for all participants and, importantly, costs of doing business should end up on the accountants' bottom lines.Externalities - the cost of avoiding acid rain, polluted rivers, sickened people, altered climate, degraded land and habitat etc. should be accounted for as a cost of doing business. Carbon taxes would be a big start. With this 'environmental economics', the awesome power of the free market to achieve things and supply goods and services would be unleashed. Those goods and services which were cleaner and greener and/or less damaging would become the same price or less than the 'dirty versions' and the great mass of the public would vote with their wallets. 'Bad' products, and the corporations that made them would be less profitable, investment in them would wither away.
Doing it this way means virtually no environmental legislation, which so many kickback against, would be required
https://en.wikipedia.org/wiki/Environmental_economics - 2019 SkS Weekly Climate Change & Global Warming News Roundup #8
alonerock at 01:21 AM on 25 February, 2019Hi All-
Please comment on Moore's text below so that I can refute his opinions with facts in an argument I am having with a friend about its content:
Patrick Moore Comments to refute/clarify:
CO2 lags temperature by an average of 800 years during the most recent 400,000-year period, indicating that temperature is the cause, as the cause never comes after the effect.
Looking at the past 50,000 years of temperature and CO2 we can see that changes in CO2 follow changes in temperature. This is as one could expect, as the Milankovitch cycles are far more likely to cause a change in temperature than a change in CO2. And a change in the temperature is far more likely to cause a change in CO2 due to outgassing of CO2 from the oceans during warmer times and an ingassing (absorption) of CO2 during colder periods. Yet climate alarmists persist in insisting that CO2 is causing the change in temperature, despite the illogical nature of that assertion.
. Will our CO2 emissions stave off another glaciation as James Lovelock has suggested? There doesn’t seem to be much hope of that so far, as despite 1/3 of all our CO2 emissions being released during the past 18 years the UK Met Office contends there has been no statistically significant warming during this century.
By 7,000 years ago all the low-altitude, mid-latitude glaciers had melted. There is no consensus about the variation in sea level since then although many scientists have concluded that the sea level was higher than today during the Holocene Thermal optimum from 9,000 to 5,000 years ago when the Sahara was green. The sea level may also have been higher than today during the Medieval Warm Period.
Coming back to the relationship between temperature and CO2 in the modern era we can see that temperature has risen at a steady slow rate in Central England since 1700 while human CO2 emissions were not relevant until 1850 and then began an exponential rise after 1950. This is not indicative of a direct causal relationship between the two. After freezing over regularly during the Little Ice Age the River Thames froze for the last time in 1814, as the Earth moved into what might be called the Modern Warm Period.
The IPCC states it is “extremely likely” that human emissions have been the dominant cause of global warming “since the mid-20th century”, that is since 1950. They claim that “extremely” means 95% certain, even though the number 95 was simply plucked from the air like an act of magic. And “likely” is not a scientific word but rather indicative of a judgment, another word for an opinion.
There was a 30-year period of warming from 1910-1940, then a cooling from 1940 to 1970, just as CO2 emissions began to rise exponentially, and then a 30-year warming from 1970-2000 that was very similar in duration and temperature rise to the rise from 1910-1940. One may then ask “what caused the increase in temperature from 1910-1940 if it was not human emissions? And if it was natural factors how do we know that the same natural factors were not responsible for the rise between 1970-2000.” You don’t need to go back millions of years to find the logical fallacy in the IPCC’s certainty that we are the villains in the piece.
Water is by far the most important greenhouse gas, and is the only molecule that is present in the atmosphere in all three states, gas, liquid, and solid. As a gas, water vapour is a greenhouse gas, but as a liquid and solid it is not. As a liquid water forms clouds, which send solar radiation back into space during the day and hold heat in at night. There is no possibility that computer models can predict the net effect of atmospheric water in a higher CO2 atmosphere. Yet warmists postulate that higher CO2 will result in positive feedback from water, thus magnifying the effect of CO2 alone by 2-3 times. Other scientists believe that water may have a neutral or negative feedback on CO2. The observational evidence from the early years of this century tends to reinforce the latter hypothesis.
Even at the today’s concentration of 400 ppm plants are relatively starved for nutrition. The optimum level of CO2 for plant growth is about 5 times higher, 2000 ppm, yet the alarmists warn it is already too high.
All the CO2 in the atmosphere has been created by outgassing from the Earth’s core during massive volcanic eruptions. This was much more prevalent in the early history of the Earth when the core was hotter than it is today. During the past 150 million years there has not been enough addition of CO2 to the atmosphere to offset the gradual losses due to burial in sediments.
Today, at just over 400 ppm, there are 850 billion tons of carbon as CO2 in the atmosphere. By comparison, when modern life-forms evolved over 500 million years ago there was nearly 15,000 billion tons of carbon in the atmosphere, 17 times today’s level. Plants and soils combined contain more than 2,000 billion tons of carbon, more that twice as much as the entire global atmosphere. The oceans contain 38,000 billion tons of carbon, as dissolved CO2, 45 times as much as in the atmosphere. Fossil fuels, which are made from plants that pulled CO2 from the atmosphere account for 5,000 – 10,000 billion tons of carbon, 6 – 12 times as much carbon as is in the atmosphere.
But the truly stunning number is the amount of carbon that has been sequestered from the atmosphere and turned into carbonaceous rocks. 100,000,000 billion tons, that’s one quadrillion tons of carbon, have been turned into stone by marine species that learned to make armour-plating for themselves by combining calcium and carbon into calcium carbonate. Limestone, chalk, and marble are all of life origin and amount to 99.9% of all the carbon ever present in the global atmosphere. The white cliffs of Dover are made of the calcium carbonate skeletons of coccolithophores, tiny marine phytoplankton.
The vast majority of the carbon dioxide that originated in the atmosphere has been sequestered and stored quite permanently in carbonaceous rocks where it cannot be used as food by plants.
Beginning 540 million years ago at the beginning of the Cambrian Period many marine species of invertebrates evolved the ability to control calcification and to build armour plating to protect their soft bodies. Shellfish such as clams and snails, corals, coccolithofores (phytoplankton) and foraminifera (zooplankton) began to combine carbon dioxide with calcium and thus to remove carbon from the life cycle as the shells sank into sediments; 100,000,000 billion tons of carbonaceous sediment. It is ironic that life itself, by devising a protective suit of armour, determined its own eventual demise by continuously removing CO2 from the atmosphere. This is carbon sequestration and storage writ large. These are the carbonaceous sediments that form the shale deposits from which we are fracking gas and oil today. And I add my support to those who say, “OK UK, get fracking”.
The past 150 million years has seen a steady drawing down of CO2 from the atmosphere. There are many components to this but what matters is the net effect, a removal on average of 37,000 tons of carbon from the atmosphere every year for 150 million years. The amount of CO2 in the atmosphere was reduced by about 90% during this period. This means that volcanic emissions of CO2 have been outweighed by the loss of carbon to calcium carbonate sediments on a multi-million year basis.
If this trend continues CO2 will inevitably fall to levels that threaten the survival of plants, which require a minimum of 150 ppm to survive. If plants die all the animals, insects, and other invertebrates that depend on plants for their survival will also die.
How long will it be at the present level of CO2 depletion until most or all of life on Earth is threatened with extinction by lack of CO2 in the atmosphere?
During this Pleistocene Ice Age, CO2 tends to reach a minimum level when the successive glaciations reach their peak. During the last glaciation, which peaked 18,000 years ago, CO2 bottomed out at 180 ppm, extremely likely the lowest level CO2 has been in the history of the Earth. This is only 30 ppm above the level that plants begin to die. Paleontological research has demonstrated that even at 180 ppm there was a severe restriction of growth as plants began to starve. With the onset of the warmer interglacial period CO2 rebounded to 280 ppm. But even today, with human emissions causing CO2 to reach 400 ppm plants are still restricted in their growth rate, which would be much higher if CO2 were at 1000-2000 ppm.
Here is the shocking news. If humans had not begun to unlock some of the carbon stored as fossil fuels, all of which had been in the atmosphere as CO2 before sequestration by plants and animals, life on Earth would have soon been starved of this essential nutrient and would begin to die. Given the present trends of glaciations and interglacial periods this would likely have occurred less than 2 million years from today, a blink in nature’s eye, 0.05% of the 3.5 billion-year history of life.
No other species could have accomplished the task of putting some of the carbon back into the atmosphere that was taken out and locked in the Earth’s crust by plants and animals over the millennia.
It does boggle the mind in the face of our knowledge that the level of CO2 has
been steadily falling that human CO2 emissions are not universally acclaimed as a miracle of salvation. From direct observation we already know that the extreme predictions of CO2’s impact on global temperature are highly unlikely given that about one-third of all our CO2 emissions have been discharged during the past 18 years and there has been no statistically significant warming. And even if there were some additional warming that would surely be preferable to the
analysis of the historical record and the prediction of CO2 starvation based on the 150 million year trend. Ad hominem arguments about “deniers” need not apply. I submit that much of society has been collectively misled into believing that global CO2 and temperature are too high when the opposite is true for both. Does anyone deny that below 150 ppm CO2 that plants will die? Does anyone deny that the Earth has been in a 50 million-year cooling period and that this Pleistocene Ice Age is one of the coldest periods in the history of the planet?
If we assume human emissions have to date added some 200 billion tons of CO2 to the atmosphere, even if we ceased using fossil fuels today we have already bought another 5 million years for life on earth. But we will not stop using fossil fuels to power our civilization so it is likely that we can forestall plant starvation for lack of CO2 by at least 65 million years. Even when the fossil fuels have become scarce we have the quadrillion tons of carbon in carbonaceous rocks, which we can transform into lime and CO2 for the manufacture of cement. And we already know how to do that with solar energy or nuclear energy. This alone, regardless of fossil fuel consumption, will more than offset the loss of CO2 due to calcium carbonate burial in marine sediments. Without a doubt the human species has made it possible to prolong the survival of life on Earth for more than 100 million years. We are not the enemy of nature but its salvation.Some of the world’s oil comes from my native country in the Canadian oil sands of northern Alberta. I had never worked with fossil fuel interests until I became incensed with the lies being spread about my country’s oil production in the capitals of our allies around the world. I visited the oil sands operations to find out for myself what was happening there.
It is true it’s not a pretty sight when the land is stripped bare to get at the sand so the oil can be removed from it. Canada is actually cleaning up the biggest natural oil spill in history, and making a profit from it. The oil was brought to the surface when the Rocky Mountains were thrust up by the colliding Pacific Plate. When the sand is returned back to the land 99% of the so-called “toxic oil” has been removed from it.
Anti-oil activists say the oil-sands operations are destroying the boreal forest of Canada. Canada’s boreal forest accounts for 10% of all the world’s forests and the oil-sands area is like a pimple on an elephant by comparison. By law, every square inch of land disturbed by oil-sands extraction must be returned to native boreal forest. When will cities like London, Brussels, and New York that have laid waste to the natural environment be returned to their native ecosystems?
The art and science of ecological restoration, or reclamation as it is called in the mining industry, is a well-established practice. The land is re-contoured, the original soil is put back, and native species of plants and trees are established. It is possible, by creating depressions where the land was flat, to increase biodiversity by making ponds and lakes where wetland plants, insects, and waterfowl can become established in the reclaimed landscape.
The tailings ponds where the cleaned sand is returned look ugly for a few years but are eventually reclaimed into grasslands. The Fort McKay First Nation is under contract to manage a herd of bison on a reclaimed tailings pond. Every tailings pond will be reclaimed in a similar manner when operations have been completed. - Studies shed new light on Antarctica’s future contribution to sea level rise
Johnb at 10:59 AM on 21 February, 2019The answer is in the MICI illustration. In the real world you have a number of random tipping points for when a particular ice flow/glacier retreats beyond its grounding line. Once that has happened the whole dynamics of melt and retreat change exponentially. As an aside in my humble opinion any modelling based on the Paris Accords, in particular the lower band is purely wishful thinking, the lower band was a political decision not a scientific one.
- Climate Damages: Uncertain but Ominous, or $51 per Ton?
Daniel Mocsny at 19:08 PM on 15 February, 2019His “Dismal Theorem” article argues that the marginal value of reducing emissions – the SCC – is literally infinite, since catastrophes that would cause human extinction remain too plausible to ignore (although they are not the most likely outcomes).
The word "likely" seems to refer to the prior probability in the Bayesian sense: the likelihood of an extinction outcome based on a purely terrestrial perspective: what we know so far of planet Earth and humanity's interaction with it. However, a cosmological perspective suggests things might be much worse. One plausible resolution of the Fermi paradox raises the extinction probability of nascent technological civilizations to nearly 1.0. Namely, we can account for our failure to observe any extraterrestrial intelligence by hypothesizing that whenever technological intelligence evolves in the universe, it destroys itself before escaping its home planet on a large scale and reaching Kardashev Type II or Type III civilizations that would be visible across interstellar and intergalactic distances, respectively. If true, this would mean the so-called Great Filter lies just ahead of us, rather than behind us.
A mechanism for intelligent self-destruction seems obvious enough, just from observing our own behavior. Intelligence initially evolves to increase individual reproductive fitness, by enabling the individual (and later groups of individuals) to extract more energy and resources from their environment. This frees the newly intelligent species from the constraints of natural selection which limit all other species from wrecking their home planet. (Before humans, no other species on Earth had by itself caused a mass extinction of other species.) Since no species ever had to worry about over-consuming its entire planet, there was no selective pressure for self-restraint. Thus the newly intelligent species must develop an ethic of self-restraint quickly enough to take up the slack for having thrown off natural selection. But the entire evolutionary history of the newly intelligent species was driven by self-interest, and evolution has no foresight. Evolution cannot foresee that getting smarter and smarter and better and better at consuming more resources will ever cause a problem. Our evolutionary psychology therefore becomes a serious obstacle to our sustainability. We've been selected for our ability to grab as many resources as possible from a world in which resources were essentially infinite, but our ability for obtaining them was scarce.
Given the rapid compounding effects of exponential growth, the newly intelligent species must evolve a culture of restraint at a pace thousands of times faster than its instincts of greed and selfishness were shaped by natural selection. Humans show virtually no sign of evolving this culture of restraint. Nearly everyone wants more money, and individual wealth is the main predictor of individual carbon footprint. Were humans psychologically equipped to become a spacefaring species (as far as we can tell, we'd be the very first in our light cone), we would see an inverse correlation between individual wealth and environmental destructiveness, instead of the current positive one.
Even worse, an unfolding climate disaster would only tend to increase selfishness, since having more money enables a person to avoid being the first to die. We've seen this on a small scale with weather disasters such as Hurricane Katrina, in which the wealthy were better able to escape by burning fossil fuels.
- EV’s: Crucial to Reducing CO2 Emissions
nigelj at 06:05 AM on 7 February, 2019Yes the slow uptake of electric vehicles has been due to price, range, recharging and possible fears about technological redundancy, but I think there are a couple of other equally important factors:
1). The cheaper electric cars have had terrible body styling, (and the Prius was not great either). Appearance and style is really important to consumers which was probably a key reason the Iphone was so successful. It might not say much about the priorities humans place on things, but its a powerful factor.
2) The car companies haven't really marketed and advertised electric cars, possibly because they are reluctant to retool their production lines for electic cars and retrain staff. Governments should force them, or alternatively do the promotional job for them.
3) There has been media spin that that electric cars are unreliable. They aren't.
4) Lack of a good enough network of recharging stations. People will not tolerate being stranded, or having to hunt around. However most recharging is actually done at home.
If you look at smartphones, growth became exponential quite quickly but certain things had to come together for this to happen, and it looks like this included affordable prices with the android phones in particular, good looks, reliability, and functionality. The interesting thing is they took off despite needing to be recharged basically every day, so functionality is clearly more important, and electric cars have multiple advantages in this area, and it will probably just be a matter of a little more time for people to fully digest the advantages.
- CO2 effect is saturated
Geologist for a change at 20:43 PM on 3 January, 2019Goodbye man-made global warming? As an independent (i.e. impartial) consulting geologist (doctorate in sedimentary geology) with 35 years of experience, having conducted an unpaid (impartial) full-time 3-year (since Nov 2015; continuing) review of the literature from ALL scientific disciplines relevant to climate- and sea-level change (geology, archaeology, physics, astrophysics, oceanography, meterorology, etc, etc), here are my main conclusions:
(1) There's obviously no doubt that Earth has warmed since thermometer measurements began in the 1800s (HadCRUT data; and online NASA/GISS online charts [yearly, monthly, and others], updated every few weeks). However, Earth began COOLING in February 2016 (NASA/GISS monthly chart). This cooling already exceeds all other measured coolings since 1995, in both duration (nearly 3 years so far) and magnitude (0.5 degrees C, fully one-third of IPCCs dreaded '1.5 degrees C by 2100', but in the wrong direction) ...
(2) Warming was driven by increasing solar-MAGNETIC output (controlling cosmic rays, therefore cloudiness; Svensmark's breathtakingly elegant theory), nothing to do with mankind's CO2 emissions which just happened, by pure (bad) luck, to grow during a solar upswing (rather than downswing), a ghastly coincidence; the reverse was about equally likely, 50:50.
(3) Changes in temperature are lagging about 25 years behind changes in solar-magnetic output, due to ocean thermal inertia (google it), dismissed by IPCC.
(4) Sea level is about to rise about 3 metres (sic), before 2100, driven by the increase in solar-magnetic output (up until its 1996 peak), its effect on sea level delayed a further 20 years (approx.; i.e. total sea-level lag is about 45 years) due to ocean 'conveyor-belt' circulation (also ignored by IPCC) delaying the arrival at Antarctica of 'solar-overwarmed' Atlantic surface water, via downwelling and southward mid-depth flow (AMOC). The floating ice shelves buttressing Antarctic on-land glaciers are NOW disintegrating at an accelerating rate (led by Pine Island, Thwaites and Totten), so catastrophic glacier failure by MISI and/or MICI is likely to begin within a decade, raising sea level by at least 3m within about 50 years. It's unstoppable.
Am I right? We'll know very soon. Regarding solar control of global temperature, the next two years will tell: I predict continued cooling, so keep a close eye on that NASA temperature chart. Regarding sea level, we'll know within 10 years, possibly much sooner: I predict the rate of sea-level rise, currently a trivial 3mm/year, but already increasing exponentially, will be at least ten times higher (3cm/year) by 2030, if not 2025. Watch NASA's online sea-level chart, updated every few months.
See my 20 ResearchGate contributions, mostly one-page items or single figures, fully self explanatory ... https://www.researchgate.net/project/Imminent-metre-scale-non-anthropogenic-sea-level-rise
- Global warming ‘hiatus’ is the climate change myth that refuses to die
Sunspot at 18:35 PM on 1 January, 2019Ok one more:
I don't have a complaint with this site or the way comments are moderated. The problem is a combination of the nature of the internet and how humans are interacting with it. This is a new form of communication we are trying to cope with. On sites with few rules - Yahoo Comments, for example - it's frequently just ridiculous, with people putting up all sorts of garbage. So some form of moderation is needed. I heartily agree.
Of course the problem becomes where to "draw the line". The problem with a subject like Global Warming, and any other big existential subject. is that it is intimately connected with all forms of human thought and activity. I find it impossible to have an honest discussion about human reactions to anything scientific without discussing the role of religion in society. And I can't have an honest discussion about Global Warming without discussing the science presented at the Arctic Blogspot. But this site has been dismissed here I assume because of a few "predictions" that haven't panned out.
But carry on. I'll be reading. I won't stir up any more "controversy". When the Arctic belches up a huge gasball of methane from a massive glacial rebound earthquake and the resulting tsunami washes over half of the cities in the Northern Hemisphere, it will be a big surprise to most. Or maybe that won't happen and it will just get hotter - EXPONENTIALLY - until it is too hot to grow food anymore. But I do know the heat can't be linear. Not with over 70 feedbacks adding to it. But this site doesn't yet acknowledge that reality. And if you don't understand the role of Global Warming feedbacks on our atmosphere, then you simply don't understand Global Warming.
- Explainer: Why some US Democrats want a ‘Green New Deal’ to tackle climate change
Wol at 10:08 AM on 19 December, 2018>>Alonerock @2, good list. Thank's for mentioning population. If we don't meet Paris goals, and we are stupid enough to still be burning fossil fuels, it will help if population stops growing and falls. Ideally I think we should aim as an immediate priority to get the fertility rate down to something like 1.5 - 2 so a bit below replacement rate. It won't make much difference by 2050, but the difference by 2100 is profound with population trending down in absolute terms.<<
Exactly.
Population control is up there with religion as being almost taboo to bring up.
Millions of words are printed about climate change but almost never is overpopulation mentioned, yet it is arguably the most important part of the equation. We are way past the sustainability of the planet even leaving overpopulation out of the argument. Malthus may have been off by a hundred years but incremental v exponential is always going to end up in one way. And we are not starting with a virgin earth but one with a substantial proportion of its capital already gone or un-reclaimable.
It's not only the popular press that refuses to tackle the fundamental issue: New Scientist is currently running a series on climate change with barely a word about population.
Some say, as Jeremy Clarkson would have it, that it would take too long for population control to have any effect, but without it in some form the problem will never be solved.
- Australia - Moving to Renewable Energy
nigelj at 11:08 AM on 13 December, 2018I think electric cars are great and the way of the future. I would draw a comparison between electric cars and smartphones in terms of the product growth cycle. The early smartphones such as Nokia communicator were actually quite good, but big, ugly looking and not that user friendly, and expensive. Electric cars have mostly been in the same space, a bit dull looking in the main, and unknown quantities with limited range etc so product market penetration has been slow.
Smartphones took off with the apple models because they were easy to use and looked stylish, don’t underestimate the importance of looks. Then the android models came along, and the price dropped and now everyone owns the things, just about. Growth has been exponential.
The latest electric car models are much better looking and have good range and great performance and comfort. What is needed is quick charging – don’t underestimate the importance of convenience to the public. It also takes a little time for the public to accept new technology. Then I predict growth will be exponential.
- Is Methane Worse than CO2?? | Climate Chemistry
william at 05:16 AM on 6 December, 2018ps. Actually an exponential effect but the exponent is less than one.
- Is Methane Worse than CO2?? | Climate Chemistry
william at 05:13 AM on 6 December, 2018I think we should be more worried about the instantaeous effect of Methane when compared with Carbon dioxide. In other words, what would be the short term effect of a greatly increased output of Methane such as may well happen from the Continental Shelf of Russia in the Arctic. If you look at the chart a short way down in this site https://en.wikipedia.org/wiki/Greenhouse_gas You will see that there is 222 times as much Carbon dioxide in the atmospere as Methane and yet the methane has a third as much green house effect as the Carbon dioxide. The calculation of their relative instantaneous effects is a little difficult since it involves sensitivity or the fact that doubling the gas in question will cause a linear increase in the warming effect (sort of a reversed exponential curve) and that there is a saturation effect above which no more warming will occur but just on a first glance you can see that Methane is far and away a more serious greenhouse gas than Carbon dioxide if the amount vented into the atmosphere spikes. Even more worrying is that an initial spike will likely lead to further spikes as more reservoirs of Methane go critical.
- Climate impacts
Xulonn at 02:05 AM on 4 November, 2018Predicting a "sea change" in complex, chaotic systems like climate and economics is extremely difficult, and disastrous change can occur much more quickly than most people realize. I do, however, agree with others in this conversation that the science of climate research is on much more solid footing than that of modern economics.
I remember reading many years ago about someone who challenged an American meteorologist (weatherman?) on next-day forecasting. By simply predicting every next day to have the same weather as the current day, he won - because the meteorological predictions of change in the day were so inaccurate. That matches my feelinga about our current global capitalist system - as long as governments cater to the ultra wealthy and corporate sectors, they believe that the good times and exponential growth can go on forever.
Another factor in overly rosy economic predictions is that people don't want to hear bad news about the future. Often, any predicted change in a negative direction that does not come to fruition leads to people no longer believing the source -unless you are Donald Trump. The U.S. president is a master at telling his fans just what they want to hear - and it is almost always based on falsehoods and inaccuracies. Even when his words are immediately debunked, his fans refuse to accept the truth. Following this surrealistic phenomenon leads me to believe that a similar psychology leads to the stubborn denialism that refuses to accept the reality of the looming disasters that will be precipitated by AGW/CC.
Economists do the same thing as Trump without overtly lying, but simply refuse to consider and include all of the obvious possibilities and their liklihoods in their calculations. Their theories, hyphtheses, and calculations may be mathematical marvels, but the "garbage in garbage out" maxim applies here.
Reading this post and its replies prompted me to go to Google to look for "economic prediction failures" - and I was a bit surprised at how the first page of results was filled with exactly what I was looking for. It looks like I've found some very interesting information to peruse over the next few days.
I see two possibilities for the next few decades - either modern civilization and its global economy will hit a wall - or drive over a cliff. And either one will likely be at full speed with "the pedal to the metal."
At age 76, I probably will not be around to see it. Many of my contemporaries are already gone, and unlike me, did not live long enough to see even the real beginning of the global "tragedy of the commons" surfacing so obviously. The current path of modern technological civilization will likely lead to its end. The focus on "saving the earth" was completely wrong. The earth will survive and life will continue to evolve - just not in the way we humans with out collective monumental hubris expected.
- 1.5 Degree Climate Limit: Small Number; Huge Consequences
Evan at 09:59 AM on 20 October, 2018nigelj@9 I think you make a great point with your statement
"And playing devils advocate, people might actually be more receptive to negative emissions projects because it means they dont have to make as many painful adjustments to their own lives." This still requires them to perceive the problem, but simply accept a more palatable solution.
But we will likely need cuts plus negative emissions. 30 years of climate awareness and exponential growth in the renewable-energy sector and CO2 concentrations are still accelerating upwards with no indication of any slowdown. So far we are not yet slowing the increase of CO2.
- SkS Analogy 15 - Ice Tea and Temperature Rise
Sunspot at 04:00 AM on 18 October, 2018At the Arctic Blogspot they have been talking about this for a long time. Over there it's fearmongering. Here it's science. As for "One Planet's" comment - there is no cold mug to put the Arctic Ocean into. There are no cold rods to insert into it. And we are not going to refreeze it using frozen plastic balls or rocks from the freezer. So I fail to see any relevance to your points...
But back to the article - doesn't this seem in contradiction to the IPCC notion that the Arctic Ocean can go ice-free, but then re-freeze magically and not be ice-free again for another 9 or 99 years. That is what the IPCC claims! In a warming world, with surges of warm water into the Arctic becoming more frequent, they think this is possible, even likely. Amazing.
Science is all about looking at all possibilities. Even the watered-down IPCC report says that the human race is going to be in big trouble in less than 20 years. The Arctic Blogspot says we are in worse trouble sooner than that. Yet the IPCC, which tries to strike an acceptable balance between science and political reality, is considered pure science, while the latter is dismissed as hysterical. And that dismissal is not science. It just isn't.
Oh, and for those who believe the future temp rise will be linear - do you really think that it will happen that way when this, and other, feedbacks start to seriously bite? Because that conclusion would also fly in the face of long-established science. Nature isn't big on linear change. She loves those exponentials! Ask Albert Bartlett...
- Comprehensive study: carbon taxes won't hamper the economy
MA Rodger at 02:57 AM on 31 August, 2018scaddenp @91,
The data pointed-to @92 attached to Garrett (2014) 'The Long Run Evoluton of the Global Economy: Part 1 The Physical Basis' is non-controversial except the two-millenium record of World Energy Use (the quantity a) presented in the third of the Supporting Information links. This link does give a smooth exponential-type record for Cumulative gGDP which is the sort of thing you see in other presentations, like the graph below from HERE

Where things start looking very controversial is the data for World Energy Use in that third link. It stitches on a smooth exponential-type record for AD1 to AD1969 onto the as-expected 1970-to-date data. World Energy Use is not a smooth exponential for AD1 to AD1969. It remains essentially linear from the present day back to 1950. The graph below (gleaned from the internet, another referenced version Fig1.3 HERE) shows this linearity. Using CO2 emissions to calculate World Energy Use gives the same linearity (as well as reproducing the 1970-to-date record accurately).

I think indy222 is having problems addressing this evident mismatch between the exponential Cumulative gGDP data and the linear (back to 1950) World Energy Use data.
- Comprehensive study: carbon taxes won't hamper the economy
MA Rodger at 20:57 PM on 29 August, 2018indy222 @89.
Yes, the message about the quantity being used as the denominator to calculate the Garrett Relation constant λ being cumulative global GDP has been recieved. I even discovered what your GWP acronym means - 'Gross World Product' (= global GDP) which was useful as the Wikkithing page on 'Gross World Product' gives a table of gGDP (1990 prices) from 2014 back to one million BC allowing a calculation of Cumulative gGDP. It has a slower accumlation than that shown by the graphic in Frame 241 of your presentation but the general scheme of things is apparent.
And while the cumulative trace sits higher up the graph because it is a "more sharply upwardly moving curve", the acceleration of an exponential function remains proportionately in tact. So Cumulatiive gGDP (C) will be accelerating at 3% per annum and as Global Energy Use (a) is showing no signs of acceleration but is instead rising in a linear fashion, the Garrett Relation constant λ cannot be constant for a = λC to hold. And that has far more significance that a "lost in the weeds" argument.
Of course, the Garrett hypothesis, in attempting to narrow projected Global Energy Use, it does not entirely rely on λ being constant (rather the slowness of that acceleration would suffice). But his analysis does need to set out the acceleration if it is to be considered useful.
And beyond that, while the Garrett hypothesis appears an interesting idea, I would question the theoretical basis of it on a number of grounds (which is of course off-topic for this thread). - Comprehensive study: carbon taxes won't hamper the economy
scaddenp at 08:06 AM on 29 August, 2018I will explain a bit why I think this point is important. Your argumentation has been based on GR holding, and regard this is an immutable "law of universe" (well a reflection of the law of thermodynamics). I am holding that if it is purely byproduct of underlying mathematical structure (and it formulation), then the only information expressed is the exponential nature of GDP and dependence on power. To use this information as a guide to the future, then need to consider whether GDP as an exponential is immutable and whether its relation to power is immutable.
- Comprehensive study: carbon taxes won't hamper the economy
scaddenp at 07:07 AM on 29 August, 2018My criticism on the mathematical structure applies if the whole GDP can be a approximated by a single exponential function and if the relation between GDP and energy production is approximately linear. A quick fit of data that I have shows those conditions are met although linearity of GDP to Energy starting to change.
If you are willing to share the raw GDP and Power data on which are working (with whatever corrections you feel appropriate), I am happy to check the mathematical structure.
- Comprehensive study: carbon taxes won't hamper the economy
indy222 at 22:42 PM on 28 August, 2018to MA Rodger: In my slide 241 showing the Garrett Relation with the refinments to the biases in the data.... you must pause and realize something Mr Rodger. Pause and realize.... One more time - I use the word "wealth" in the same way that Garrett does. Wealth = time integrated GDP. So when I label a curve "Wealth (GDP+shadow)" that means I'm plotting time integrated GDP, not GDP, and together with the spending that is not included in GDP, which Oztunali and many others refer to as the "shadow economy". Yes time-integrated GDP indeed goes up roughtly exponentially. The integral of an upwardly moving function is an even more sharply upwardly moving curve. GDP has, since the discovery of oil, been, on average, an increasing function. Recessions clearly slow that, but only for a year or so before it resumes typically with renewed vigor. And yet once again, neither Garrett nor I are arguing for a fundamental physics unchangable relation between atmospheric CO2 and global GDP. That graph is only possible when FF's are your ~sole source of energy and given the way CO2 source+sinks behave in the environment. I have already said in my ppt's that I expect that curve will shallow when (if!) renewables begin to make a dent in our FF use. How much renewables begin to make a dent is going to depend on a race - a race between when climate chaos begins to seriously degrade civilization in a rapid way (thus perhaps derailing our attention away from renewables conversion in favor of just hanging on to what we have), and when the "S" curve of adoption of renewables somehow kicks in and FF power plants already built become uneconomical to maintain.
As for "GWP" as Global Warming Potential, that's a communication point I hadn't considered. I'll tell you why I go back and forth with using it - I'm writing a chapter for a book on the economics of climate change right now, and being confronted with staying inside a word count (!) and "global GDP" is 2 words, and "GWP" is one word! Yeah. Sorry, I'll try to use "global GDP" here.
You can get lost in the weeds of arguing whether Power/Wealth is truly constant. The data that goes into it has biases, and there are no 1-sigma, 2-sigma or other statistical error estimates given by those nefarious economists to Power or GDP(!). Garrett spends a great deal of time making a case for a constancy based on seeing Civilization as a thermodynamics system. I think it has great insight. I've reframed it slightly differently by using "entropy" whereas Garrett frames more in terms of potential energy flows from higher to lower. Each way hopefully will trigger light bulbs in at least some people. Is the relation PROVEN, in some sort of uncontestable mathematical way, like the Pythagorean Theorem? No - civilization is ruled by human laws as much as by physics, and this is not a closed and perfectly defined and delimited and known logical system like mathematics (at least, not until we reduce biology and the resulting psychology to their quantum mechanical base layer!). Garrett has made a case, and checked to see whether the prediction Power/Wealth=constant holds in the data, and it does. I've looked for flaws in the reasoning and the data, as I started out as a skeptic myself. Instead of finding that the relationship is only a product of flawed data, I find that it is flawed data that makes the small deviations from flatness, and that if we remove those biases the relationship looks even stronger than Garrett thought. Very strong in the historical data. I've not yet seen a case to be made from good reasoning that the GR relationship will be broken. We must not be guilty of "magical thinking", to quote Garrett and to quote a good friend and NAS astrophysicist Sandra Faber. Again, constantly improving energy efficiency is not in either mathematical or logical conflict with Power/Wealth=constant. The complaints here in SkSci seem to be based on misunderstandings in what Garrett is saying. The rest of the reason why Garrett's work has not gotten a wider look may be because - his biggest proponent seems to be the Apostle of Apocalypse: Guy McPherson. As an aside, I've gone out of my way to emphasize criticism of McPherson's clear misunderstanding of Garrett's work and of climate (esp methane) in general and that his belief that all humanity will be extinct in 8 years is ludicrous.... and cruel to those naive enough to buy into his past life as a professor of ecology as sufficient justification to believe him. The last thing that I want, is for McPherson to praise my thoughts or work! I don't need friends like that. The future is grim enough without having the true situation dismissed baby/bathwater along with bogus NearTermHumanExtinction. My sympathies to Garrett.
- Comprehensive study: carbon taxes won't hamper the economy
indy222 at 16:59 PM on 28 August, 2018scaddenp: Your criticism only works if the exponential has the same constants in the exponent throughout the time of interest. But that is not the case here. The exponential power has varied greatly not only during the times before fossil fuels, but even during just the past century, and even just the past decades. The growth rate of Wealth (hence Power) was moribund until the late 1900's, took another slight hiatus during WWII, and then had a huge sharp change beginning in 1950, then shallowed again as the 21st century got going and continuing till now.
- Comprehensive study: carbon taxes won't hamper the economy
scaddenp at 09:58 AM on 28 August, 2018" Are you trying to say that we could choose ANY time integral and any non-integral which are both functions of time, and get a constant ratio to the extent seen in the GR?"
Not quite. I am saying time integral of any exponential time series divided by time series that is positively proportional to that same series will converge to a constant.y1 = a.Exp(b.t)
Int(y1) = a.Exp(b.t)/b
y2 = c.y1 + d
Int(y1)/y2 = a.Exp(b.t)/(b.c.y1 + b.d) = a.Exp(b.t)/(b.c.Exp(b.t) + bd)
as Exp(bt) get large, then approximates to a.Exp(b.t)/b.cExp(b.t) = a/bc
- Comprehensive study: carbon taxes won't hamper the economy
indy222 at 08:49 AM on 28 August, 2018The other important point, is that if you look at World Bank data on the efficiency of energy to generate GDP, you'll see Joules/$GWP steadily dropping. But not completely steadily (see my slide 253), it flattens during recessions. I don't have China data or articles going back to those past recessions, but just the near-recession of '15 in China shows the point - that GDP is significantly overstated, and so energy efficiency progress in fact reverses during recessions, as the GR says it must. In human terms - we abandon the luxury of further improving energy efficiency in favor of just trying to support what we already have with what energy we have. That paints a sobering prospect of what would happen in an engineered long term recession as Prof Kevin Anderson has called for. W/o a massive change in who we are as a responsible species, we won't get out of this as cavalierly as so many would like you to believe. Of course, it doesn't have to be an engineered (graceful?) long term recession - climate decay could force it on us unwillingly, as I think it probably will. Climate decay, and our exponentially rising debt finally becoming impossible to support.
- Comprehensive study: carbon taxes won't hamper the economy
scaddenp at 07:42 AM on 28 August, 2018Indy222, "However, this is not the case with global GDP. It is HEAVILY weighted towards the present."
Rate of convergence to a constant more about the size proportionality of y2 to y1.
If you have series that is exponential, and divide integral of series by a series that is positively proportional, then it will converge to a constant. As far as I can see the GR is nothing more than a statement of the mathematical structure. It adds no new information. It doesnt matter what errors there are in GDP or power, so long as exponentation and proportionality are maintained then ratio will be constant.
There's no appreciation in the SRES scenarios of how Draconian must be the constraints on global freedoms and desires in order to actually make happen the curves they simply cobble together as "representative".
Huh? Carbon tax or ETS is a draconian contraint on global freedoms and desires? If renewables are cheaper (and take away FF subsidies and they are in many parts of the world), then that will wreck economies to decarbonize? Does China care about "global freedoms" -what exactly do you mean?In one breath, you are saying that climate change will damage economy, and next, they we will squander everything to maintain global economic growth and that is inevitable. I really dont get it. I dont think you get what SRES are for either. All the meeting minutes are online. I dont see any nefarious UN polical outcomes at play there. They are done to provide policy makers information on the climate that various forcing pathways will lead them to. Do you that there is a forcing pathway that is not within the range considered by SRES?
- Comprehensive study: carbon taxes won't hamper the economy
indy222 at 01:02 AM on 28 August, 2018I'm continually puzzled why people insist on mis-representing what Garrett's work shows, despite his patient rebuttal to Cullenward, Koomey, and despite my doing the same here. The graph that MA Roger links to above is GDP vs CO2. The Garrett Relation does NOT make a statement about GDP, but instead the total integrated global GDP over all history. And it does NOT make a statement about CO2, it instead says the current POWER (from any source, renewable or not) is proportional to time-integrated GDP. Stop constructing a phony straw man in order to justify dismissing the work, it only shows a lack of objectivity. It is the GR as stated above which is included in the forward projections curves, and those curves have a wide range of possible civilization resiliance to climate change crippling, and decarbonization rates. The point is that all of them show rising CO2 because we cannot accomplish anything, and for a given assumed growth rate of "Wealth"(=time integrated global GDP), more reslient civilization means HIGHER atmospheric CO2. Those curves are including decarbonization. Note that FF's have remained 87% of our global energy mix since 1973 right up through 2015. You have failed to justify why economists (not thermodynamics experts and not climate experts) Koomey and Cullenward's wrong-headed and dismissive commentary should not itself be dismissed. I've not found any substantive criticism of Garrett's work - only straw-man snipe'ing such as I am now seeing here.
As to Garrett's comment "It looks unlikely that there will be any substantial near-term departure from the recently observed aceleration in CO2 emission rates", there was a flattening in REPORTED emission rates in the '14/'15 area, but (1) China has been caught under-reporting their emissions (look it up!), (2) China goes through 5-year cycles of overbuilding (think "Ghost Cities") and then fallow periods, and you must average over those. (3) Look at the Keeling Curve, updated almost daily, at their website. It is as smooth an exponential as anyone could hope. (4) Even if CO2 emission rates take a meaningful turn downward and stay down as we more dramatically go towards renewables, that does not violate the work. The Garrett Relation is between ENERGY and TIME INTEGRATED GDP, it is not with FOSSIL FUEL ENERGY. So yes, a log/log plot shows how closely atmospheric CO2 has followed GDP, but Garrett himself puts no importance on this, it's really just a statement that since virtually all of our energy has been FF energy, then there's not much surprise at the close correlation. If we make FF's a strongly diminishing part of the energy mix, neither he nor I nor anyone else would be surpised to see that curve start to bend.
- Comprehensive study: carbon taxes won't hamper the economy
scaddenp at 11:06 AM on 27 August, 2018Indy222, If I have understood your statement of the Garrett relationship, then I am still not certain it is saying very much.
Take an exponential series. eg y1=a*EXP(b*t) (ie GDP)
Take y2 as a linear relation of y1 eg y2 = c*y2 + d (Power)
Divide the Integral of y1 wrt t by y2 and the result converges towards constant. Rate of convergence dependent on relative values of b and c.
And no, I havent looked at this rigorously from mathematical viewpoint but it looks suspicious to me.
- Comprehensive study: carbon taxes won't hamper the economy
indy222 at 15:09 PM on 23 August, 2018Here's my last comment for now. Even people who sort of accept that improving efficiency may help us grow, don't quite appreciate exactly how close the relationship is. Realize that it is the actual putting into practice the new energy efficiency that CAUSES the spurt in growth and hence the spurt in total energy consumption. We're like the not-too-bright donkey who's owner on his back is dangling a carrot on a stick and string a foot in front of his nose. Every gallop forward only carries the carrot farther in front to make a mockery of his efforts. Every instance of growth encumbers ongoing new power to support that negative entropy growth in the ordered system called Civilization, AND, it also makes us bigger, badder, better at accessing NEW energy reserves and we take full advantage of that. CO2 emissions grew 2% last year, and are expected to grow another 2% this year, and again in '19. Hence accelerates our energy consumption in total. That's what history shows, right up to the present. And for decades now, the fraction of that energy consumed which must be carbon emitting, has not improved. A constant fraction of an exponentially rising total primary energy consumption, is an exponentially rising CO2 emission rate, and an upward arcing atmospheric CO2 - which is exactly what we see right up through the present moment. We're not decarbonizing anywhere near fast enough to change this. And, if we tried, we'd have to work HARDER, and that means spending MORE energy to accomplish that mission, and that means MORE CO2 emissions to get to a day of smaller fraction of CO2 energy sometime in the future. We're between a rock and a very hard place.
I'm not arguing against trying to improve energy efficiency. But it's not our salvation. We've done it forever, and it's only gotten us to this very frightening place. We need improving energy efficiency AND Tibetan-monk level belt-tightening in our consumption at the same time. BOTH. Channeling every dollar not essential for survival, into decarbonizing.
- Comprehensive study: carbon taxes won't hamper the economy
indy222 at 14:32 PM on 23 August, 2018Let me clear up the misunderstanding. Cullenward's bogus criticism only betrays that he didn't pay attention while reading Garrett's paper(s). The "Garrett Relation" that "Power/Wealth= Constant" means the following: "The global Current Power Consumption rate is directly proportional to the sum total of all GWP spending over all time (==Wealth)". Cullenward assumed he was saying that GWP is proportional to power. But that's false, it's the SUM TOTAL of ALL GWP over ALL TIME, that is proportional to current power. I am writing a paper with Tim Garrett as co-author which shows that this relation is even better obeyed than Garrett's original paper showed, as there are sublties to how inflation is corrected, how different currencies are calibrated, about the "shadow economy", and a bias in GDP reporting from big countries like China which skew official figures as well. Don't confuse the fundamental "Garrett Relation" with the much less significant CO2 vs GDP graph. That graph Garrett himself down-plays, but it's interesting as a visual proof at how badly we're doing in de-carbonizing. Back to the Garrett Relation; Jevons' Revenge (my term, I hope it catches on, to distinguish from the original "Jevons' Paradox" by Jevons himself, which is more restricted and so not relevant here) says that all improvements in energy efficiency result in MORE total energy being consumed. Because human civilization is driven (genetically?) by the goal to achieve the most rapid, efficient growth possible, and improving energy efficiency aids the expansion of civilization. The point of Jevons' Revenge is that any savings resulting from energy efficiency WILL BE SPENT, and it doesn't matter where, because the Garrett Relation shows that ALL spending sum totalled over all time, remains proportional to current energy consumption rates. It is explicitly in the mathematics of the CThERM model which includes the Garrett Relation and which is very well verified in historical data right up to the present. Now, the carbonization of energy is a parameter in the model which you can tune any way you feel is realistic, but Garrett has made a few projections under the assumption of (A) no decarbonization (that has been the history of the 21st century so far) and (B) decarbonize exponentially with a halving time of 50 years; meaning the CO2 emissions per joule of energy expended, is cut in half every 50 years. Both result, with a wide range of assumptions of the resiliencey of civilizataion to the decays caused by climate change, to increasing CO2 at different rates. If we REALLY got serious, we could do better than t(1/2)=50yrs, but so far, we're doing nothing remotely like this. FF's are still growing at an absolute rate that is about equal to that of renewables, so that the % of global energy from FF's has remained about 83% the entire 21st century so far.
- Welcome to the Pliocene
DrivingBy at 10:17 AM on 12 August, 2018Welll, here's another thought, albeit speculative.
No other species has been able to remove barriers to exponential population growth. The human population grew at a glacial pace until the 19th century, when the Industrial Revolution detonated the plodding circle of history. For a hundred thousand years, there were fewer than 100 million of us, then about a thousand, fewer than a billion of us. For the last one hundred years, our numbers have exploded.
Like other animals, we're territorial. We want territory because we need some, and we want more because we want it, and if you give up half of yours others will take it, surround you and then take the rest. That is how humans have always been and always will be.
So probably we're headed towards a tipping point, not soon (well over 50 years forward) but inevitable, where people go to war over land and water, then continue wars because fire has its own force.
If Climate Change causes a collapse in feritily, then a decrease in population, we'll avert that scenario. World population falling by, say, 2/3rds would free up massive amounts of land for reforestation, it would decrease the massive amonut of fuels used for farming and it would allow societies to move to accomode rising seas. It would also allow for sharp cuts in C02 output, since when one is not in a war for survival the option to act about other things exists.
Climate change will bring immense costs and eventually destroy coastal cities - that's most great cities - which have been settled for thousands of years. It might also save us from something much worse.
- There are genuine climate alarmists, but they're not in the same league as deniers
nigelj at 06:44 AM on 16 July, 2018Michael Sweet @38, I agree about Hansen. I can't bring myself to call him an alarmist, or to totally dismiss his claims, because there is some evidential basis for Hansens theories. Also although its unlikely that he is right about sea level rise, the small possibility he is right must be considered and not rubbished, because the consequences are so grave.
I understand your point about how Hansens theories have evolved and the IPCC is a little bit in catch up mode. I never labelled him an alarmist even in the early days because I hate the term, because its obviously meant to be demeaning. But like I said its probably not worth taking it personally.
But because the IPCC underestimates things doesnt mean all alarmists are right either.
I tend to agree with MA Rodgers conculsions on Wadham, but again you wont find me accusing him of alarmism as such. I would just say he hasn't sufficiently backed his case.
Definitions are important. Alarmism is normally defined as exaggeration or making claims without good reason. Like you said Hansen was on shaky ground in the early days, and probably did deserve to be dismissed as making implausible claims, but he has gained at least some support in the science community.
But if we are to use terms like alarmism, how much support in the scientific community is required to say someone is not an alarmist? Is one paper enough to demonstrate its not alarmism? I think it is, but only because nobody has firmly debunked Hansens claims, and instead they have simply stated that an awful lot of conditions would have to occur. But such conditions appear at least possible.
But genuine alarmist scientists are pretty uncommon. I put Guy McPherson in that category because his claims are too far fetched. There might be some almost infinitely small possibility he is right, but is that enough to give them credibility? I dont think its quite enough to mean anything. We could argue almost anything in life is possible with some almost infinitesimally small possibility, but don't we need something more than that for them to rise above alarmism?
I remember the ebola outbreak in Africa a year or so ago, and they were talking about possible exponential spread. To me this was possible and not alarmism, so in no way to I dismiss dangerous and / or extreme scenarios, provided theres a possible mechanism that makes sense.
- There are genuine climate alarmists, but they're not in the same league as deniers
Sunspot at 04:37 AM on 10 July, 2018I wish Mr. Betts would stop using the term "alarmist" over and over and over. It's a common dog-whistle term used by deniers. The article he cites supposedly debunking McPherson is over 4 years old. The basic argument seems to be that the bad things predicted by McPherson, Wadhams, and many others btw, haven't happened yet. We know that. So it's an argument over how fast methane can be released, how soon all the ice melts, etc. No mention of "global dimming". To say that the "alarmists" are wrong is a little premature. There is an impressive roster at the Arctic Blogspot site, not just two people as implied in this article. And I am convinced that a great many Climate Scientists are, privately, just as concerned as McPherson and Wadhams. This is why Arctic Blogspot uses the pseudonym "Sam Carana". Anyone being publicly "alarmist" may lose their jobs! Many Climate Scientists have left the US because they and their families receive death threats! But buy them a beer, and I'd bet they don't dismiss even the most dire predictions. We simply don't know what will happen, but the temperature increase is likely to be exponential, not linear. It's getting hot out there. All over.
- Should we be worried about surging Antarctic ice melt and sea level rise?
nigelj at 08:10 AM on 19 June, 2018Great video. So meltwater pulse 1a caused approximately 20 metres total sea level rise over approx. 500 years, that is approx. 4 metres per century! J Hansen is rightly screaming at us to pay attention to this. People would have to be asleep not to see the urgent significance.
It's associated with a period of abrupt warming of approximately 5 degrees celsius, that happened somewhere over a period of a few decades to a couple of centuries.
There are two competing theories of the origins of the meltwater. Firstly its could have been caused by ice sheet collapse over North America, and theres good evidence for this, but this only accounts for about half of sea level rise. Secondly theres very good evidence collapse of ice sheets in the Antarctic accounts for at least the other half, which would be approx. 2 metres per century. So imho maybe its a combination of both events.
So the bottom line is theres virtually no doubt that sea level rise has been rapid in the past, so ice sheets can destabilise quickly.
Modern warming is rapid, and could hit 5 degrees celsius by 2100 so is not dissimilar to rates during mwp 1a. We already have recent evidence that melting is accelerating in the antarctic. It just all suggests 2 metres sea level rise by 2100 is very plausible, and probably likely, and you could not rule out more. I don't think it would be exponential acceleration but it would be getting close. This would be devastating, and would totally reshape the planet's coast lines, and would clearly go on for centuries.
- New research, June 4-10, 2018
nigelj at 13:12 PM on 17 June, 2018It's hard for me to see exponential rise in melting of the antarctic, like a doubling or tripling per decade, given most climate trends are following more of a quadratic trend. But I agree its going to be far more than 3.5mm per year, and I think multi metre sea level rise by 2100 is a real possibility.
- New research, June 4-10, 2018
william at 10:13 AM on 17 June, 2018Apologies. I must have been having a mathematical melt down. The story is more like this. If we are indeed trebbling the melt rate every decade and if this is truly an exponential curve then it means that the melt rate is increasing by about 11.6% each year (1.116 raised to the tenth power equals 2.997). You then have to raise 1.116 to the eighty second power (number of years remaining in the century) to see what the melt rate will be at the end of this century. Clearly a ridiculous answer (I hope). I think we will find that after a couple of more decades, we won't see a trippling each decade from the previous decade. It does suggest, though, that we are in for far more than 3.5mm per year for the rest of the century.
- New research, June 4-10, 2018
william at 06:16 AM on 17 June, 20181 Nigel
Depends if this is part of an exponential curve or just a blip in a linear curve. (can we call a linear graph a curve. Probably). A few more years should clarify this. If each decade we tripple the melting then we raise 1.03 to the eighth power to get the melting by the end of the century and integrate under the curve to see how much total water has entered the oceans. Not a pretty picture.
- American conservatives are still clueless about the 97% expert climate consensus
NorrisM at 14:01 PM on 17 April, 2018michael sweet @ 27
After looking at this carefully, there is no question that Figure 3 (d) is simply a blown up portion of Figure 3(c). Just look at where the heavy black dot is on both c and d (the Pfeffer "most likely projection"), in both cases it is .8m. The heavy black line on both c and d represents Rohling's "probability maximum (peak of probability distribution) which comes out at .4m for 2100.
I acknowledge that this is simply one "peer-reviewed" paper. Your criticism before was that I never made reference to "peer-reviewed" literature and should therefore be banned from this website.
As for the Hansen paper, I have not read it but I will do so. My understanding of the Hansen paper is that Hansen's 17 foot figure is not a "projection" as you say but merely a "possibility" based upon assumptions for which Hansen himself acknowledges in the paper that he has no evidence. This last comment was pulled from my recollection of a direct quote from Hansen's paper from some other blogger. I will see if I can find the quote and if I cannot I will also acknowledge same.
Interesting that the US Climate Report, although clearly relying on the De Conto and Pollard 2016 paper on WAIS does not seem to put much reliance on this Hansen paper. My understanding is that Hansen has had a number of projections which have not come to pass along with a few that have. I understand that his figure of 17 feet relies on an exponential (not quadratic) curve. What I do agree with Hansen is his promotion of nuclear power (I have even contributed to his charity because of this).
I have not suggested that sea level will slow down but if you want an answer to your question as to what physical mechanism could there be for a decrease in the sea level rise rate (not actual decrease), the simple answer is a flattening of the temperature rise. We saw this happen with sea level rise during the "hiatus" and we could see it if temperatures were to level off for the next 10 years.
I certainly see that the impact of the WAIS is critical to all of this discussion of sea level. If anyone could suggest some further reading on what is actually happening to the grounding lines on the WAIS and whether this is creating the seaward flux suggested I would be very keen to read it. My understanding is that the theory of MISI and his added MICI are still in the "theory" category, not supported by observational evidence. And it is for that reason that the chances of material change in sea levels by 2100 are rated below 1% for anything more than 2m in the US Climate Report.
- How could global warming accelerate if CO2 is 'logarithmic'?
gws at 03:27 AM on 3 April, 2018Alchemyst @6 and nigelj @5: The Lambert-Beer Law shows an exponential rise of Absorption with increasing concentration. So Alchemyst's statement is incorrect.
In the atmosphere, though, the law applies only to infinitesimally small slabs because neither temperature nor pressure are constant with height, thus the results have to be integrated over the whole atmospheric column. Individual absorption lines of GHGs that are "saturated" (e.g. all "strong" GHGs such as CO2), thus absorb less per concentration change, than lines of "weak" GHGs (e.g. CFCs) that are not "saturated". This is discussed in detail in most atmospheric chemistry textbooks.
The scientific community worked through the math decades ago and found that weak absorbers produce approximate linear increases in radiative forcing in response to their concentration increases, while those for strong absorbers increase logarithmically. These relationships are empirical, aka they apply to our Earth's atmosphere. The numbers for radiative forcing enter the calculation of Global Warming Potentials.
- Sea level rise predictions are exaggerated
NorrisM at 09:47 AM on 1 April, 2018Bob Loblaw, Eclectic and michael sweet,
This has been an interesting journey, exploring what I will describe as the “conflicting views” on the future sea level rise “predicted” for the remainder of the 21st century. Let me say that I appreciate that my use of the term “predict” is used in a general sense and that many of what I refer to as “predictions” are in fact “projections” because they are predictions based upon certain assumptions relating to a number of things but most importantly, the level of CO2 emissions based upon the various pathways assumed by the IPCC.
The relevance of the views of a lawyer are on such a technical subject as “sea level rise” is certainly questionable but I suspect the interest of Bob Loblaw is simply because there are a number of legal cases that will be coming before the courts of the United States over the next few years and these cases will be adjudicated by lawyers and not physicists or other scientists. Having said that, there are many lawyers who have an engineering or scientific background before entering law so there may be some hope of having a scientist hear the case. In my case, my undergraduate degree was in the “dismal science”.
In researching this topic, I have largely focused on Chapter 13 of the IPCC Fifth Assessment (Fifth Assessment) and those portions of Chapter 3 dealing with sea level rise as well as blog information contained on this website on the subject as well as blog information on one other website (which does not carry much weight from most of the commentators on this website). I have also read the US Climate Science Special Report published in late 2017 (US Climate Report) as well as the very good RealClimate article on the Fifth Assessment (suggested by Bob Loblaw).
But before I delve into my impressions from these sources, I would also like to reference the discussion of “uncertainty” both in the Fifth Assessment and the US Climate Report. In both reports, the extent of understanding (and certainty or uncertainty about that understanding) is based upon levels of confidence (dealing with the consistency of the evidence and degree of agreement within the literature) and likelihood expressed probabilistically (based upon the degree of understanding or knowledge).
What I want to focus on are the levels of “Confidence”:
“Medium Confidence” means suggestive evidence (a few sources, limited consistency), competing schools of thought.
“High Confidence” means moderate evidence (some sources, some consistency) medium consensus
“Very High Confidence” means strong evidence (established theory, multiple sources) high consensus.
All of the definitions for uncertainty are found in the US Climate Report in the “Guide to this Report” which is easily located.
I think it is very important to keep these measurements in mind when analyzing the findings of the Fifth Assessment. When they use “Medium Confidence” they do not mean “medium consensus” because that term is reserved for “High Confidence”. Unless the term “Very High Confidence” is used then there is considerable uncertainty remaining.
So to commence this research the most logical place to begin is the Fifth Assessment projections found at Section 3.7.6:
"It is very likely that the global mean rate was 1.7 [1.5 to 1.9] mm yr–1 between 1901 and 2010 for a total sea level rise of 0.19 [0.17 to 0.21] m. Between 1993 and 2010, the rate was very likely higher at 3.2 [2.8 to 3.6] mm yr–1; similarly high rates likely occurred between 1920 and 1950."
Figure 3.14 of the Fifth Assessment shows the “bump” in sea level rates in the period 1920 to 1950. Given that the accepted view is that the rapid increase in the use of GWG’s only started after 1950, it seems incumbent on scientists to explain the “bump”. The only explanation I could find in the Fifth Assessment was that this “bump” was ”likely related to multi-decadal variability”. See Section 3.7.4. However, the natural question is if “multi-decadal variability” caused the increase in rates in the 1920-1950 period then why cannot the increase in rates found since 1993 of approximately 3.2 mm/yr also be attributed to multi-decadal variability? Or should not at least a portion be attributed to this internal variability, if only a portion, then how much?
So the Fifth Assessment found that it was “very likely” (read 90-100%) that the average rate of sea level rise since 1901 was 1.7 mm/yr. But before we get into the 3.2 mm/yr rate, we now have a number of papers since the Fifth Assessment that have suggested that the Fifth Assessment’s 90-100% assured estimate is all wrong and the real rate for 1901 to 1990 is 1.1 to 1.2 mm/yr. (Hay 2015 Dangendorf 2017). When asked by others how the IPCC could have got this so wrong, the answer seems to be that everyone is entitled to be wrong, that is science. I fully agree but it does not necessarily engender confidence in other “Very Likely” predictions or projections of the IPCC in the Fifth Assessment.
Perhaps the IPCC will, in the Sixth Assessment actually maintain its 1.7 mm/yr rate which I understand was similar to the AR4. Why do I say this? Because my understanding is that these “new” lower estimates are largely based upon a reanalysis of VLM. But here is what the Fifth Assessment has to say about VLM adjustments:
"High agreement between studies with and without corrections for vertical land motion suggests that it is very unlikely that estimates of the global average rate of sea level change are significantly biased owing to vertical land motion that has been unaccounted for. {3.7.2, 3.7.3, Table 3.1, Figures 3.12, 3.13, 3.14}"
So now on to the $64,000 question as to whether the observed acceleration in sea level rise since 1993 is an increase in the long term rate or is reflective of decadal variability or only reflects “apples and oranges” measurement issues with satellite altimetry compared to tide gauges.
We have disagreements both on the rate of acceleration and the causes of the acceleration.
Firstly, we have a disagreement between the Fifth Assessment estimates of what the acceleration rate is and the recent Nerem 2018 paper. From the Fifth Assessment, the acceleration is quite small with Ray & Douglas (2011) at -.002 to .002 mm/y, Jeverejeva (2008) at .012 mm/yr and Church & White (2011) at .012 mm/yr. Then we have Nerem (2018) re-evaluating things and coming up with .084 mm/yr. I do not propose to get into the technical disagreements that I have read on the Nerem (2018) paper but even extrapolating his acceleration, his projected 2100 sea level rise is somewhere around 65 cm close to the low range of the IPCC RCP8.5 estimate. Although I am not qualified to make any judgments, I suggest that anyone who is qualified should at least read the comments made by FrankClimate on the other website under the Part IV discussion on sea level acceleration. Without question, FrankClimate is technical. His comments have now been incorporated into the Part IV discussion. Would be interested to hear from Eclectic as to whether he disagrees with FrankClimate.
Secondly, we have questions of what is the cause of this recent acceleration since 1993. I had to ask myself why 1993 and not 1990? The obvious answer is that it is in 1993 that satellite altimetry came into the equation with the launch of the TOPEX satellite. Although I think there is general agreement that there are serious questions about whether the data from TOPEX for the first six years should be used at all (or for that matter even the remaining period for that satellite), my sense from looking at the NASA website is that the satellite altimetry is pretty well matching the tide gauges. I think there are a number of people who disagree with me on this but the average rates seem to match. But it is curious that where we see this very large increase in SLR is not at the land-based tide gauges but out in the middle of the oceans. It at least led me to ask myself whether this significant difference between the tide gauge measurements and satellite altimetry measurements in the middle of the oceans would have always been there if we could have measure it with satellites much earlier. I fully appreciate that the tide gauge measurements have shown an upward trend since 1980 (Section 3.7.4) but my understanding is that the large average increase during the satellite era can be attributed to the large increases found in the middle of some of the oceans, especially the Indian Ocean.
But back to attribution. A number of authors have suggested that the way to reconcile the “bump” in 1920-1950 and the increases since 1990 is to link these climate changes to multi-decadal variability, and specifically the AMO or the PDO. Here is what the Fifth Assessment has to say about this at 3.7.4:
"Several studies have suggested these variations may be linked to climate fluctuations like the Atlantic Multi-decadal Oscillation (AMO) and/or Pacific Decadal Oscillation (PDO, Box 2.5) (Holgate, 2007; Jevrejeva et al., 2008; Chambers et al., 2012), but these results are not conclusive."
Others have said that the increase in SLR since 1990 is not “statistically relevant” when looking at the long term sea level rise. In that respect, the Fifth Assessment does make the following statement immediately following the above quotation:
"While technically correct that these multi-decadal changes represent acceleration/deceleration of sea level, they should not be interpreted as change in the longer-term rate of sea level rise, as a time series longer than the variability is required to detect those trends."
For those who say that the acceleration should be attributed to AGW, they largely point to the increased rates of melting in the glaciers and the Greenland ice sheet and potentially catastrophic impacts relating to the West Antarctic Ice Sheet (WAIS). I cannot obviously get into discussing these topics without clearly being “snipped” for too long a post. In my view, having read the Fifth Assessment, the risk of “dynamic changes” in WAIS (there is virtually no risk with the topography of Greenland bedrock) are minimal. Here is what the Fifth Assessment has to say about the MISI hypothesis relating to WAIS at 13.4.4.3:
"In summary, ice-dynamics theory, numerical simulations, and paleo records indicate that the existence of a marine-ice sheet instability associated with abrupt and irreversible ice loss from the Antarctic ice sheet is possible in response to climate forcing. However, theoretical considerations, current observations, numerical models, and paleo records currently do not allow a quantification of the timing of the onset of such an instability or of the magnitude of its multi-century contribution."
As to the evidence of a retreat of WAIS, see Chapter 13 at 13.5.4.1:
"Although the model used by Huybrechts et al. (2011) is in principle capable of capturing grounding line motion of marine ice sheets (see Box 13.2), low confidence is assigned to the model’s ability to capture the associated time scale and the perturbation required to initiate a retreat (Pattyn et al., 2013)."
What this tells me is that there is a “theoretical” danger but so far we do not have any evidence of an actual retreat or the time frame over which this could occur. We cannot base our rational responses to AGW based upon theories which have not been supported with observational evidence.
As for the Greenland ice sheet, we know that the major warming was caused by warm waters appearing around Greenland and the impact that this has had on the melting of the ice sheet in the peripheries around the ocean at least from 1990 to 2012. My understanding is that this has been attributed to a decrease in cloudiness associated with the NAO which would mean that it was the increased insolation which caused the increase in the melting. Here is the discussion in FAQ 13.2 regarding the Greenland ice sheet:
"Although the observed response of outlet glaciers is both complex and highly variable, iceberg calving from many of Greenland’s major outlet glaciers has increased substantially over the last decade and constitutes an appreciable additional mass loss. This seems to be related to the intrusion of warm water into the coastal seas around Greenland, but it is not clear whether this phenomenon is related to inter-decadal variability, such as the North Atlantic Oscillation, or a longer term trend associated with greenhouse gas–induced warming. Projecting its effect on 21st century outflow is therefore difficult, but it does highlight the apparent sensitivity of outflow to ocean warming. The effects of more surface melt water on the lubrication of the ice sheet’s bed, and the ability of warmer ice to deform more easily, may lead to greater rates of flow, but the link to recent increases in outflow is unclear."
With the above information, the question that has been posed to me is where would I place the estimate of GMSL at 2100 compared to the Fifth Assessment (RCP 8.5) projection of .59cm to .98cm?
Firstly, it seems to me that during the 20th Century we had an almost linear rise in sea level as is acknowledged by the Fifth Assessment at 13.3.6 at p. 1159:
"GMSL rise during the 20th century can be accounted for within uncertainties, including the observation that the linear trend of GMSL rise during the last 50 years is little larger than for the 20th century, despite the increasing anthropogenic forcing (Gregory et al., 2013b)."
Here is a larger quote from the same Gregory paper:
“The largest contribution to GMSLR during the twentieth century was from glaciers, and its rate was no greater in the second half than in the first half of the century, despite the climatic warming during the century. Of the contributions to our budget of GMSLR, only thermal expansion shows a tendency for increasing rate as the magnitude of anthropogenic global climate change increases, and this tendency has been weakened by natural volcanic forcing. Greenland ice sheet contribution relates more to regional climate variability than to global climate change; and the residual, attributed to the Antarctic ice sheet, has no significant time dependence. The implication of our closure of the budget is that a relationship between global climate change and the rate of GMSLR is weak or absent in the twentieth century. The lack of a strong relationship is consistent with the evidence from the tide gauge datasets, whose authors find acceleration of GMSLR during the twentieth century to be either insignificant or small.”
This is consistent with the “Munk enigma” that he saw a near linear increase in GMSL during the 20th Century notwithstanding the impact of AGW only in the second half.
The Fifth Assessment RCP 8.5 assumes that in the second half of the 21st Century we will have what at least are “quadratic increases” if not “exponential increases” in the GMSL rate. I have no understanding of how a “quadratic curve” differs from an “exponential curve” and I do not have to notwithstanding all of the debate that I read on this issue on the “other website”. What I do know is that it is much steeper than a linear increase.
From Table 13.5 the Fifth Assessment has acknowledged that in the case of RCP 8.5 that in the period 2018 to 2100 they project an average sea level rate of 11.2 mm/yr for the mid-case and for the high case of .98 m the projected average rate is 15.7 mm/yr. See Section 13.5.1 at page 1180:
"The rate of rise becomes roughly constant in RCP4.5 and RCP6.0 by the end of the century, whereas acceleration continues throughout the century in RCP8.5, reaching 11 [8 to 16] mm yr–1 in 2081–2100."
Notwithstanding this projection, the Fifth Assessment acknowledges that this would exceed the average rate of 10 mm/yr during the deglaciation after the Last Glacial Maximum when there were massive ice caps over North America and Europe and Asia to supply the melt water (Chp13 pg. 1205):
"For the RCP8.5 scenario, the projected rate of GMSL rise by the end of the 21st century will approach average rates experienced during the deglaciation of the Earth after the Last Glacial Maximum."
The IPCC clearly understood this but did not explain how this could be achieved given the lack of such volumes of ice now (Chp 13 pg. 1185):
"The third approach uses paleo records of sea level change that show that rapid GMSL rise has occurred during glacial terminations, at rates that averaged about 10 mm yr–1 over centuries, with at least one instance (Meltwater Pulse 1A) that exceeded 40 mm yr–1 (Section 5.6.3), but this rise was primarily from much larger ice-sheet sources that no longer exist."
Grammatically, the phrase “but this rise ….” modifies the reference to 10 mm/yr and not 40 mm/yr.
The IPCC projection of sea level rise attributes the largest rise to thermal expansion, secondly to glaciers, and thirdly to the Greenland ice sheet mass balance loss and with a negative contribution by the Antarctic ice sheet.
As to the IPCC’s ability to adequately model dynamic changes to the Greenland and Antarctic ice sheets here is what the Fifth Assessment says at 13.5.4.1 pg 1187:
"As discussed in Sections 13.4.3.2 and 13.4.4.2, there is medium confidence in the ability of coupled ice sheet–climate models to project sea level contributions from dynamic ice-sheet changes in Greenland and Antarctica for the 21st century. In Greenland, dynamic mass loss is limited by topographically defined outlets regions."
Note the use of the term "Medium Confidence".
With all of the above research, given that I could not accept some of the projections of the IPCC for RCP8.5 (leaving alone the fact that RCP 8.5 is probably unrealistic given the changes we see in a move to renewable energy sources at least in the developed world) the question came down to what would I guesstimate the GMSL for 2100 if for some reason I was asked my opinion (which I was by Bob Loblaw).
For me, I would go back to the observations and look at where the sea level has moved since 1900 and assume that it will follow along the same largely linear path that it has pretty well followed since we have kept records in tide gauges. Taking Figure 13.27 of the Fifth Assessment and applying a ruler to the line, it projects out to about .4m by 2100. In other words, whatever impact CO2 emissions have had they are “baked in the cake”. What we see is what we will get.
Using the most recent date online at NASA, as of December 2017, we have had an 87.5 mm rise since 1993 representing an average rate of 3.2 mm/yr according to the NASA website. If we multiply this figure of 3.2 mm times 82 years, we arrive at around 26.24 cm of further rise if the rise continues to be linear. If you add this 26.24 to the .19 cm for the period 1900 to 1990 it totals 45.24 cm.
So my guess is that we probably will have a further 21 to 26 cm from now until 2100 representing somewhere around 8 to 10 inches of sea level rise. Unfortunately, I will not be around to see if I am right!
- 2018 SkS Weekly Climate Change & Global Warming Digest #5
nigelj at 13:00 PM on 21 February, 2018Scaddenp @120
Yes I did allude to the fact incrementalism doesn't apply to everything.
Growth in fossil fuels use, population and economic growth all looks exponential. Just out of curiosity would you consider that "incremental"? It doesn't seem so to me.
I think you have explained the the purity issue very well and its not meant to be taken offensively or as a bad thing in principle. I think it depends how its applied, and whether application has some sensible basis. I do also understand Norris point of view on it.
But I would suggest politics is being polarised by activists on both left and right and feedbacks set in. The leftists are seen as disloyal etc, and the right wing activists (tea party, heartland people) are seen as not caring about fairness, and evidence based science. Its all very unfortunate.
However I read an interesting article in the Economist that researched political attitudes with Americas population. The partisan division is much stronger between politicians and elite groups than the general population overall. Of course there are big red / blue partisan state divisions, and divisions within states, but the biggest divisions are in the leadership. Apparently many people in small town america voted on gut instincts on the leaders style and personality, rather than policy or democratic / republican divisions. This is all contrary to my impression. Complicated. But the polarisation is apparently more at the top than the bottom. Don't know what it all means, but its not good.
All the moral foundations in the theory seem to have value. It just seems to me all become toxic when taken to extremes, for example excessive authoritarianism. Children need authoritarian parenting to a point, but treating adults this way can go too far. However fairness seems unique and something that is more clear cut. It seems hard to say that unfairness is ever a good thing.
I have read some moral philosophy like aristotle, kant, mill, rand (please forgive me about rand, I must have been crazy).
I also have a book you may find interesting, but I have not read much of it yet: "Behave" by Robert Sapolsky. "The biology of humans at their best and worst". This was the main point in my replying to your post. You are a busy guy so I dont expect a reply. We are possibly talked out on the issues for now anyway.
- 2018 SkS Weekly Climate Change & Global Warming Digest #5
nigelj at 08:51 AM on 21 February, 2018Incrementalism seems like a good philosophy as a general rule. The problem Karl Popper has is there are far more exceptions than he is willing to acknowledge. That's just the reality.
However incrementalism is pretty applicable obviously to things like carbon taxes, provided we start right now. The longer its left, the shorter the window of opportunity becomes, and then there could be a need for a far more drastic solution to climate change, as panic sets in, and fossil fuel companies will really be feeling pain. New research has shown strong evidence of an acceleration in sea level rise over the last 20 years, and projecting that takes us to about half a metre by end of century. Now even just a small additional acceleration this decade or so will get to a metre or more and this is what models predict, conservatively.
And there was nothing too incremental about growing fossil fuel use. Looks more like an exponential growth curve to me.
- Humans need to become smarter thinkers to beat climate denial
citizenschallenge at 13:24 PM on 7 February, 2018Nice write up!
nigelj, seems to me we haven't done very well with the math these past decades either. Case in point: "Sustainability 101: Exponential Growth - Arithmetic, Population and Energy (Dr. Albert Bartlett discusses the implications of unending growth on economies, population, and resources.) https://www.youtube.com/watch?v=o0ghHia-M54
“The answer does not care if you like it. It just is.” Should be carved in stone. ;- )
(SkS, have reposted this at https://confrontingsciencecontrarians.blogspot.com/2018/02/beating-climatedenial-with-better.html )
- The Key To Slowing Global Warming
nigelj at 06:26 AM on 12 January, 2018Sunspot @14
"20 years ago the world got over 80% of its energy by burning fossil fuels. Then we built lots of windmills and solar panels. The result is today, we still get over 80% of our energy by burning fossil suels. What happened?? Well, the world uses a lot more energy than we did 20 years ago."
The reason for slow uptake of renewable energy is not really increasing demand for energy. The reasons have been political resistance to renewable energy, campaigns to spread doubt about renewable energy and climate science, and the high costs of early versions of renewable energy. Costs are much lower now, and growth in renewable energy has been much higher in the last 5 years or so, with both wind and solar power as in the link below. Solar growth has been near exponential since about 2008.
cleantechnica.com/2011/06/10/solar-power-graphs-to-make-you-smile/
"And, btw - I agree with Jef. I don't know how that is so confusing to some of you. If people get paid a living wage then they don't have to drive to work and consume fossil fuels."
With respect this is not correct. A living wage is normally defined as a slightly higher version of a minimum wage (and its a good idea) that is paid by companies or subsidised by governments. People will still need to work to get this living wage, and to get to work driving something or by bus. So all the issues around renewable energy and electric cars remain.
If you mean a "universal basic income" that people get as of right, this is really for the unemployed and invalids, and is set at about the level of minimum wage or even less, so is very minimal. The vast majority of people will still work if they want to do more than merely survive. And money doesn't grow on trees, so a ubi has to be minimal, although I think its a useful idea.
"If they are paid to grow vegetables then we have to get less lettuce from Chile."
Nobody is going to pay people to stay home to grow vegetables. Money doesn't grow on trees. However I think you are right if you are promoting more self sufficiency in food, and less reliance on food imports, and associated transport costs.
" And, the best part - we won't be able to afford to waste over a half trillion dollars a year, and all that wasted energy, bombing brown people on the other side of the planet who pose very little threat to us"
Agreed.
- 2017 SkS Weekly Climate Change & Global Warming News Roundup #50
nigelj at 05:23 AM on 20 December, 2017We are polluting the planet, and using up mineral resources incredibly fast. Many materials can be recycled many times, - but not all. We come up against hard resource limits eventually.
The causes are near exponential population growth, and gdp growth
The solution is phase down to zero gdp growth economy, and stop population growth. We may even need a smaller population than todays numbers, if you want decent consumption levels sustainable long term.
It's slow reducing population growth rates, so the other factors are very important like slower gdp growth, renewable energy etc.
UN development goals are definitely the right way.
More than 100 comments found. Only the most recent 100 have been displayed.
More than 100 comments found. Only the most recent 100 have been displayed.


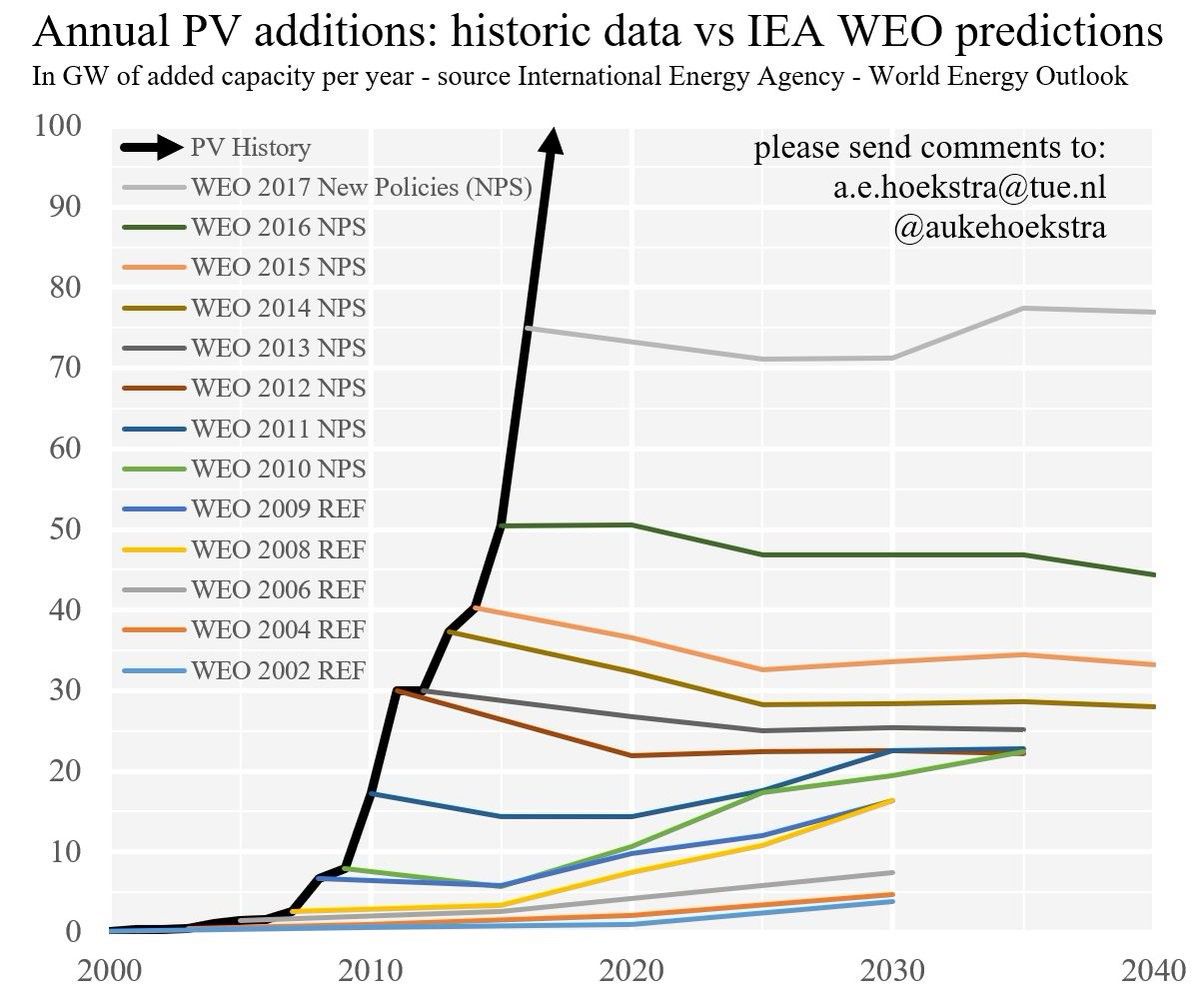
THE ESCALATOR

(free to republish)