


 Arguments
Software
Resources
Comments
The Consensus Project
Translations
About
Support
Arguments
Software
Resources
Comments
The Consensus Project
Translations
About
Support
![]()
![]()
![]()
![]()
![]()
![]()
![]()
![]()
![]()
![]()


![]()


Latest Posts
- Skeptical Science New Research for Week #17 2024
- Water is at the heart of farmers’ struggle to survive in Benin
- At a glance - The difference between weather and climate
- India makes a big bet on electric buses
- 2024 SkS Weekly Climate Change & Global Warming News Roundup #16
- EGU2024 - An intense week of joining sessions virtually
- Skeptical Science New Research for Week #16 2024
- How extreme was the Earth's temperature in 2023
- At a glance - Is the science settled?
- What is Mexico doing about climate change?
- 2024 SkS Weekly Climate Change & Global Warming News Roundup #15
- Fact Brief - Did global warming stop in 1998?
- Skeptical Science New Research for Week #15 2024
- EGU2024 - Picking and chosing sessions to attend virtually
- At a glance - The Pacific Decadal Oscillation (PDO) is not causing global warming
- Climate Adam: Is Global Warming Speeding Up?
- 2024 SkS Weekly Climate Change & Global Warming News Roundup #14
- Gigafact and Skeptical Science collaborate to create fact briefs
- Skeptical Science New Research for Week #14 2024
- How can I make my retirement plan climate-friendly?
- At a glance - Global warming and the El Niño Southern Oscillation
- A data scientist’s case for ‘cautious optimism’ about climate change
- 2024 SkS Weekly Climate Change & Global Warming News Roundup #13
- Skeptical Science New Research for Week #13 2024
- You can start applying for the American Climate Corps next month
- At a glance - Human fingerprints on climate change rule out natural cycles
- Want clean electricity? These are the overlooked elected officials who get to decide.
- 2024 SkS Weekly Climate Change & Global Warming News Roundup #12
- Climate - the Movie: a hot mess of (c)old myths!
- Skeptical Science New Research for Week #12 2024
Comment Search Results
Search for ice free by 2013
Comments matching the search ice free by 2013:
- What on Earth is a polar vortex? And what’s global warming got to do with it?
Eric (skeptic) at 01:39 AM on 28 December, 2022Thanks for that nicely balanced article. For the recent event the AO index went negative. Negative AO is not necessary for an Arctic outbreak but it's indication of a north-south tendency in the jet stream. Also if negative AO leads to an outbreak, that outbreak could be anywhere in the NH and may not make the U.S. centric news in the U.S.
So a logical question to ask is what is the trend of AO? No trend: www.cpc.ncep.noaa.gov/products/precip/CWlink/daily_ao_index/month_ao_index.shtml. The papers by Francis a few years ago referenced the AO starting late fall and winter. That makes sense because the anomalous heat release from refreezing open water is highest in the fall continuing into winter. Arctic tempeature deviations from normal are highest in winter: ocean.dmi.dk/arctic/meant80n.uk.php. But consistently higher in the fall.
The CPC website provides a rendering of JFM AO: www.cpc.ncep.noaa.gov/products/precip/CWlink/daily_ao_index/JFM_season_ao_index.shtml. Perhaps a positive trend. One paper claiming a jet waviness trend used data ending in 2013. iopscience.iop.org/article/10.1088/1748-9326/10/1/014005 That's not convincing anymore given the newer data with opposite trend.
To show a connection, someone will need to take an index like AO and the temperature data e.g. DMI and look for changes in the index corresponding to increases in fall warmth shown in the temperature data starting around day 250.
It seems likely that we would see some correlation in the winter data from negative AO to the many of the spikes of warming shown in DMI. That would be correlation but would not mean the temperature spikes caused negative AO. More likely the opposite and a careful analysis of timing might tease that out.
- On climate misinformation and accountability
ajki at 20:17 PM on 11 February, 2020#1: "... section ... looks very out of date ..."
#1 has a point in that regard. It is true that a voluntary (free-time) approach can't keep the data up to date - but it appears to be an abandoned section.
I've noticed this myself recently in a kind of "discussion" where a "pro nuclear" guy defended Mr. Pielke, Jr., against any sort of dis-/misinformation regarding "Climate Change". When I cited some items of the Pielke, Jr., section I noticed that everything there was dated far back. That itself isn't problematic - what has been said should be noted. But the question is if (e.g.) Mr. Pielke, Jr., did something in the mean time, what Nuccitelli/Cook said above could be done by someone who made erroneous claims in the past: s/he could have corrected her-/himself in the time since then. This may be unlikely or even absurd, but it can happen.
So, when all db entries stopped after about 2013, how could I know if (e.g.) Mr. Pielke, Jr., distanced himself from public claims he made in the past? (In a way I can answer that myself: on SkS I would use the "search" for all contents regarding R. Pielke, Jr., and that way I could see more recent blog posts where the name is found - but blog posts on SkS don't have the scope of watching "denialists" correcting their false claims und so there may be no such posts)
- Climate Scientist reacts to Donald Trump's climate comments
nigelj at 12:02 PM on 17 November, 2019OPOF @10, I disagree in part. Adam Smith believed in the invisible hand in an ideological sense, in that people following their own economic interests in order to make money would benefit everyone as a side effect and better than government's telling people what the best economic choices are. But he was no laissez faire economist that thought governments should limit their activities to very narrow motives of a justice system and defence force. He accepted the need for public education and some regulation of business.
And Smith was very cynical about the motives of business and recognised business could cause problems. He was mainly concerned about the problem of tariffs and also control over economic behaviour in a fundamental sense. Of course he did not promote big government either. And bear in mind this was 400 years ago and modern economists have more evolved views. Here is what Adam Smith really said and meant:
msc.gutenberg.edu/2013/03/adam-smith-was-no-laissez-faire-ideologue/
economistsview.typepad.com/economistsview/2010/03/adam-smith-and-the-role-of-government.html
Milton Freidman is towards the extreme edge of economics, and founded the monetarist school that did indeed promote something close to laissez faire capitalism with very small governmnet, and I agree with you he had delusional expectations of how such s system would self regulate, an dhave full information, and how people would behave etcetera. But the majority of modern economists do not subscribe completely to his views and see a larger role for governments, but stopping short of 1970's style socialism.
Most modern economists see a role for legislation related to basic workers rights, health and safety and the environment.
My point is the power brokers in business and also politicians pick and choose whatever economic idea suits their agenda at the time. They are unprincipled. They interpret theory as they see fit and leave out bits they dont like, and have no consistency in the application. They interpret free markets to mean free of all management and regulation when even Adam Smith did not promote that. He promoted markets free of tariff barriers and excessive government control.
Just a bit of history really. You are right in broad principle the invisible hand is certainly "not enough" to provide optimal results. Generally advanced countries have a good deal of law around workers rights and the environment and properly so. We have to ensure 1) its the right sort of law and 2) its not eroded by free market fanatics and people with short term agendas and no care for working conditions. There is a difference between freedom to do mostly ones own economic thing, and oppression of workers and environmental vandalism.
- CO2 effect is saturated
GwsB at 19:49 PM on 3 September, 2019In the discussion about the effect of CO2 on the climate there are certain images which may be said to incorporate the essential part of the arguments. Such iconic graphs are the driving force in changing one's view of the world. A good example is the sun with the planets rotating around it. This stopped all phantasies about what happens at the edge of the (flat) earth. This iconic image made it possible to sail Westward in 1492 in order to reach India.
For CO2 the iconic image is the rippled increasing graph of the CO2 concentration as measured at Mauna Loa from 1960 onwards, sometimes extended over the past thousand years by observations from tree rings and ice cores to obtain the "hockey stick". For the influence of CO2 on climate the iconic graph is given in Wikipedia https://en.wikipedia.org/wiki/Greenhouse_effect (last updated 23 August 2019)
Caption: "Atmospheric gases only absorb some wavelengths of energy but are transparent to others. The absorption patterns of water vapor (blue peaks) and carbon dioxide (pink peaks) overlap in some wavelengths. Carbon dioxide is not as strong a greenhouse gas as water vapor, but it absorbs energy in longer wavelengths (12–15 micrometers) that water vapor does not, partially closing the "window" through which heat radiated by the surface would normally escape to space."
The graph shows that the effect of water vapour, H2O, is much greater than the effect of CO2. It also shows the saturation of the absorption due to CO2. The first argument (about water vapour) is valid. We can't do anything about the concentration of H2O though, except perhaps by increasing the temperature. So we will just have to accept this effect. The second argument (about saturation) is also valid. The absorption at wavelength 4 - 4.4 μm is 100% over most of the region, and so too at 12-15 μm. In comparison with H2O the peaks of CO2 are very steep and the wings have little effect. It is only the thin peaks at 2 μm and at 4.9 μm which will grow significantly if the concentration of CO2 is increased.
The basic physics is simple: A photon of light at a wavelength of 14 μm is passed from one CO2 molecule to the next performing a kind of random walk until it exits the atmosphere. There are two exits, outer space and the earth. Saturation means that a photon starting from the earth has very little chance of exiting to outer space. It is almost certain to exit the atmosphere to the earth, where like shortwave radiation it will be re-emitted at a different wavelength. Even if the new wavelength with probability a half lies in an absorption band of CO2 or H2O, this only means a stay of execution. In the end the photon will escape to outer space through one of the long wave gaps in our atmosphere.
The graph in Figure 2 in Zhong & Haigh (2013) is perhaps more precise, but the vertical scale runs over twelve orders of magnitude, (twelve orders of magnitude is from one mm to a million km, or from one gram to a Megaton). The result of this scale is that I am not able to comprehend the significance of the graph. Figure 5b, bottom, gives the difference between the radiative flux for the present level of CO2 (389 ppmv) and a level increased by a factor 32 (12500 ppmv). The total negative impact is almost cancelled by the positive impact around 15 μm. This impression is reinforced by Figure 6a where the graph is practically horizontal beyond 400 ppmv. In Figure 6b we see an increase in the slope beyond ten thousand ppmv. In that graph the horizontal axis is logarithmic and runs up to a million ppmv, which is a pure CO2 atmosphere. These results are based on models and therefore should be taken with a pinch of salt.
The conclusion is: The direct impact on the temperature of the earth of the increase in CO2 from the present level of around 400 ppmv is relatively small. This is due to saturation at the bands where CO2 absorbs long wave radiation.
Is the graph above misleading? It is described as "(Illustration adapted from Robert Rohde.)". Clicking on Robert Rohde results in the message: www.globalwarmingart.com refused to connect.
If anyone knows a better graph I would be very happy to obtain a link.There is a nice course on climate denial presented by the University of Queensland https://courses.edx.org/courses/course-v1:UQx+Denial101x+1T2019/course/ The course is free of charge and contains a huge amount of good information on climate change. Unfortunately the course does not address the topic of the absorption of CO2 at specific wavelengths. Neither does the basic rebuttal by dana 1981.
The near saturation of CO2 at present levels makes it difficult to convince people to vote for a cut in CO2 emissions or for a tax on such emissions.
- Climate's changed before
Daniel Bailey at 00:37 AM on 13 June, 2019Agreed with MA Rodger.
No Venus-syndrome for the Earth:
"With the more realistic physics in the Russell model the runaway water vapor feedback that exists with idealized concepts does not occur. However, the high climate sensitivity has implications for the habitability of the planet, should all fossil fuels actually be burned.
Furthermore, we show that the calculated climate sensitivity is consistent with global temperature and CO2 amounts that are estimated to have existed at earlier times in Earth's history when the planet was ice-free.
One implication is that if we should "succeed" in digging up and burning all fossil fuels, some parts of the planet would become literally uninhabitable, with some time in the year having wet bulb temperature exceeding 35°C.
At such temperatures, for reasons of physiology and physics, humans cannot survive, because even under ideal conditions of rest and ventilation, it is physically impossible for the environment to carry away the 100 W of metabolic heat that a human body generates when it is at rest. Thus even a person lying quietly naked in hurricane force winds would be unable to survive.
Temperatures even several degrees below this extreme limit would be sufficient to make a region practically uninhabitable for living and working.
The picture that emerges for Earth sometime in the distant future, if we should dig up and burn every fossil fuel, is thus consistent with that depicted in "Storms" — an ice-free Antarctica and a desolate planet without human inhabitants"
So no runaway. But Hansen notes that it won't take a runaway to basically completely eradicate civilization as we know it. Supported by this:
"While dominated by anthropogenic forcing in these recent times, solar variability in prior eras caused much larger relative influences.
The early Sun was approximately 70% as bright as at the present when it joined the main sequence about 4.6 billion years ago with a current rate of increase in luminosity of 0.009% per million year (Hecht 1994). At this rate, it will take 10 million years for the background solar brightness to increase by the 0.1% typical of a solar-cycle variation, and another 3.5 billion years for heating from the Sun to create Earth-surface conditions similar to those of the present-day Venus; although additional effects, such as feedback from enhanced ocean evaporation, may accelerate this warming and make the Earth uninhabitable (at least to present-day complex lifeforms) in about one-billion years."
- Should a Green New Deal include nuclear power?
sauerj at 00:29 AM on 24 April, 2019All, I am hardly a NP biased proponent. I have only just began to learn about NP (only starting in the last 9 months). I was technologically agnostic before that (instead only focusing on revenue-neutral carbon tax policy). I would call myself a proponent of skeptical science and due-diligence. I have made my primary motivations (zero GHG emissions) quite clear in the above comments. The above characterizations and snide remarks toward me (#16: "black is white and up is down") are unprofessional. I have been fair, professional and forthcoming; referencing all of my points and pointing out (w/o meanness) where the refs that I provided were not correctly understood (ex. 1.2mm panels per day and for US only). ... Nigelj points out that this latter point doesn't matter b/c NP is cheaper (#14); but, this cost detail is very complicated and not so clear, as I explained above & further explain below. Regardless, I still think a continuous replenishment of 1.2mm panels per day, for the US, forever, (assuming a conservatively high 40-yr life span), even if recycling, is something not to dismiss lightly.
I am still worried that a 100% RE plan (per Jacobson's plan, who was a big part of this greenman video) would be imprudently bias against NP and close-minded to how NP can help us (in the mix) get to zero GHG emissions as quickly, smartly & justly as possible. I believe that Jacobson's 100% RE 35-year roadmap plan needs more careful cross-examination; and I base this on what appears to be a thorough review video (cited above & again HERE for convenience), as well as per what other reputable people are saying, also pointed out above, such as highly respected people like James Hansen & others), and I feel that this sort of on-going diligent cross-examination of Jacobson's plan should be pointed out (as I have done).
In the end, I feel that cost should decide, but only provided we are truly & earnestly looking at all costs, and also including all external, long-term costs in the cash flow analysis (which is what the EICDA bill ultimately gets us at (concerning GHG pollution). I am not convinced that that kind of total & comprehensive cost analysis is done w/ Lazard's cost #'s, mostly b/c of the two missing big factors (mentioned in my comments above) which are: non-equal service-life & non-equal reliability (which are not included in Lazard's cash flow analysis).
1) Abbott (MSweet's 16.1): I didn't address the Abbott 2011 paper (material resource issue, #13 in his paper) b/c it is way over my head technically. By myself, I could never get to the bottom on what is the definitive truth on this. To fairly review this paper, it would take a team of senior NP & geological experts, to be able to give Abbott's conclusions due analytical diligence. I am nowhere near qualified for that.
But, in order to meagerly attempt to do that (in the last 2-3 days), I have submitted this Abbott 2011 paper to NP experts (who frequent this "RE vs NP" FB public group) to give them a chance to review & comment on this. A 'Colby Kirk' has given me the following information that throws the Abbott 2011 paper into doubt.
1.1) On Abbott's Material Resource Issue (his point #13):
Per Colby Kirk: "I reviewed his [Abbott] claims on the limited materials. He didn't give a number of materials per reactor, he just claimed all of these materials are required for nuclear reactors and then did a basic algebra formula based on the reserves limited to only the U.S. This is far from being scientific, quantitative or honest."For instance zirconium ... "15 Metric tons per reactor unit of ACR1000" at 15,000 reactors will still not be an issue [see page 73 of this site HERE for this 15MT/rx #]. 225,000 tons for the world nuclear fleet against a world supply of 73,000,000 tons [sauerj insert: Abbott has this at 56,000,000 tons]. That's also assuming we only use that reactor design, which advanced reactors will eliminate the need for zirconium cladding.
"None of this brings up the possibility of recycling which would become a large part of the supply line as these materials go up in price. Fuel assemblies go in and come out with the technical possibility of reprocessing and recycling. Different reactor designs have different needs and any bottle neck on certain materials will just motivate a substitution or design pivot."
1.2) On Abbott's paper being "peer reviewed":
Per Colby Kirk: "I've learned to not rely on the approval of peer review since lots of easily refuted antinuclear hit pieces get published in the literature under "peer review". Editors and reviewers can play favorites, have bias and also not know what they are looking at, which is unfortunate. I've seen lots of terrible work pass under "peer review". I can say for sure he [Abbott] is citing some widely refuted anti-nuclear hit pieces that were not peer reviewed like SLS. [sauerj inert: See my note below about this SLS paper below (*).]"There are also some egregious errors and mistakes in the rest of the paper that any honest reviewer would catch, like cherry picking U235 as the only viable nuclear fuel.
"The document is labeled under "point of view" [sauerj insert: see top of the Abbott paper & on every corner] which looks to be a debate platform in the IEEE content stream. They talk about "personal positions" and "predictions" without mention of peer review like they do for the rest of the journal. Therefore I doubt it is peer reviewed. HERE is the description of that page. "(*) About the non-peer reviewed SLS paper (that Abbott cites 3 places in his 2011 paper): Colby Kirk also sent me the following two rebuttal articles about this SLS paper, see HERE & HERE.
Finally, on this 16.1 point, I personally could not find where Abbott says that the shortage limit of Be, Nb, Zr, Y, Hf will limit NP to 5% max of total power (NP currently provides 11% of global power today). MSweet, could you cite where Abbott claims this?
2) Lazard pg 13 Methodology (MSweet's 16.4, 2nd para of 16.4): This page 13 is just an example free cash flow analysis for just one technology (wind). That is why it doesn't show a comparative table for NP. But regardless, no, they probably don't include disposal costs for NP; so that is a fair point. But, they probably don't also include replacement & recycle costs with the RE options either; though this is probably much less $ than that for NP.
3) Costs (MSweet's 16.4, 1st para of 16.4): My statement above (comment #13) about NP being less than solar & equal to wind (based on slide #2 on THIS site) was not apples-to-apples in comparison; I did not read the slide carefully enough (my error). This slide is a comparison of old fully depreciated NP and new un-depreciated solar & wind, which shows old NP being less cost than new solar & equal to new wind (but this not a fair comparison on new vs new). As MSweet pointed out above (pt 16.4) (in the PDF that I sited), new NP is much more than solar & wind. ... My next thought (per the bottom citations I gave above in #13, & for convenience citing again HERE & HERE) does NP have to be this expensive (based on installations in China, India & South Korea being 25-30% less and per the 3.1 & 3.2 paragraphs below that give credible evidence & references that Jacobson's 100% RE plan would cost 3x more than a Gen III NP plan in reguards to capital costs). But, I fully admit & agree, per Lazard's #'s, without any correction for service-life & equal reliability differences (or without consideration of the capital cost differences per 3.1 & 3.2 below), that new NP does cost more than new RE.
Lazard's #'s do not account for differences in service-life (per its pg 13 methodology), nor offsetting to achieve equal on-demand reliability (ditto). I think these two are big cost factors that are missing from Lazard's cash flow analysis, which is otherwise quite rigorously & technically well done. This lack of 100% apples-to-apples comparison (due to these two missing points) is the same lack of apples-to-apples consternation as cited in the Grist article above (conveniently cited again HERE, see below the "Are renewables cheaper?" header)
On comparing capital cost differences b/w a 100% RE plan vs a mostly NP plan to supply the US with enough non-carbon energy to de-carbonize the US, the following information is noteworthy:
3.1) Capital cost to put the US on 100% RE: Per Jacobson, to supply the 1591GW US demand using his 100% RE plan will cost $15.2tr (not counting necessary pumped hydro back-up which adds $1.3tr for every 4 hours of total US grid back-up). Ref: See this video (3:15-4:15) for these Jacobson 100% RE costs #'s.
3.2) Capital cost to put the US mostly on NP: The Gen III reactors (in SKorea) were built for a cost of $4.4bn/GW. Therefore, to satisfy the US power demand, this would cost $6.7tr (almost 1/3 the cost of the 100% RE costs if the RE plan includes a moderate amount of pumped hydro back-up). And, this NP capital cost could fall to $3tr with Gen IV MSR reactors. These NP costs are per this video (4:50-6:30).4) Shellenberger (MSweet's 16.2 [the first 16.2]): MSweet, Could you post which video (& time) is pertinent to where you said he (Shellberger) contradicted himself? If that is so, then you are most right; and I would agree. Yes, there is absolutely nothing wrong with RE driving power prices down.
5) Shellenberger (MSweet's 16.2 [the 2nd 16.2]): About Fukushima deaths: Shellberger's claims of no deaths due to NP (this video at 14:37) are backed up by the May-2013 UN report (see wiki article, below the "UNSCEAR Report" header), which cites "No radiation-related deaths or acute diseases have been observed among the workers and general public exposed to radiation from the accident". In addition, Shellenberger ref'd the actual UN report, (in the above linked video slide at 14:37), which appears to be extremely thorough (200 pgs). Therefore, I see nothing to make me believe that Shellenberger misrepresented the facts in his video stating that there were no radiation deaths due to NP. Therefore, b/c the nuclear industry didn't technically kill anybody (that all associated deaths were only due to the fault of inappropriate emergency response) per this reputable UN report (that Shellenberger cites), my conclusion is contrary to MSweet's above statement: "Shellenberger denied that the nuclear industry is responsible for the people they killed at Fukushima. The industry demonstrates their complete lack of concern for safety when they do not accept responsibility for the people they kill."
Regardless to no one dying due to radiation, the Fukushima accident was still not good. But do we throw out any good that NP can provide, in getting to zero emissions, if done safely and prudently, due to a possible bad & risky design at Fukushima?
6) Material Mass/Power Comparison (MSweet's 16.3): MSweet, On this "tons/Mwh" point, you mentioned above having trouble finding ref docs that Shellberger referenced. To be clear, I used this Shellenberger video at 18:39 for the mass/power ratio #'s that I posted in #9 above. When I check Shellenberger's references here, I was able to quickly find his referenced doc HERE, which then points to HERE to access it. But, you have to have a sign-on clearance to access it, which I don't have. My expectation is that this doc will, in fact, have a Table 10 (that matches the same figures on Shellenberger's slide). So, I believe you might have been too quick to say that Shellenberger's graph was "falsified"; and to call him a "liar". Now possibly you were looking at a different video and slide, b/c the reference Shellenberger cites here (18:39) is not a "pro-nuclear book" but instead a DOE paper (which led me to the above two sites). If you are able to access this report (again HERE), and find no Table 10 to back-up Shell's slide here, then this does discredit him.
To try to find additional docs on this tons/Mwh ratio subject, I could also ask the above mentioned NP experts for more refs on differences between NP & solar & wind on this point. On the surface, it does jibes w/ my eng sensibilities that solar & wind would far outweigh NP on this ratio due to much lower energy density of the RE's vs NP, especially for the required large scale (per Jacobson's #'s) as outlined in this video (2:40-3:30, and 6:35-8:30).
At this point, on this mass/power ratio matter, I see nothing that gives me reason to doubt Shellenberger's numbers; and certainly no definitive evidence to classify him as a "falsifier" and a "liar".
Also, his presentation cites people who were once very anti-nuclear (Brand, Monbiot), but now in their zeal to really get to zero emissions (as smartly & quickly as possible), and in their honest examination of all the facts, these people have changed their minds. This is profoundly moving to me. Hansen's word is also profoundly moving to me, as I mentioned above (#13).7) NP Maturity (Nigelj 14): In my learning's about NP (in the last 9 months), I have learned that the NP industry is certainly not fully mature. It may be more mature than the solar industry, but there are many things that could be strategically done to bring the capital cost of safe NP down via alternations/upgrades to different paradigms (from Gen II to Gen III, IV) and construction streamlining techniques. Other countries are moving forward into these more cost competitive & safer paradigms (per all of my points above in #3 of this reply) and lower cost construction techniques.
In Conclusion: I am not a NP hack; please do not characterize me of that. I am a CC mitigation hawk and active CCL member, who is simply asking questions & trying to learn to find the truth, and I feel that reputable sites & people (as ref'd) legitimize my questions & concerns about a 100% RE plan. With this reply, I feel I have addressed your points comprehensively and professionally, and on subject concerning this greenman video and its Jacobson referenced content.
- 3 clean energy myths that can lead to a productive climate conversation
ThinkingMan at 08:40 AM on 10 April, 2019Michael Sweet challenged my 3 April post’s main point: The full cost of RELIABLE electricity service structured around wind turbines SIGNIFICANTLY EXCEEDS the full cost of reliable service based on a combined cycle natural gas turbine (CCGT). This post begins the process of supporting the statement. At least one more post will be needed to complete the process.
RELIABLE is a key word in the initial post. Reliable service has for decades been characteristic of Australia, New Zealand, Japan, Korea, Taiwan, North America, Europe and elsewhere. Thus, globally, electricity users are now accustomed to getting all the electricity they want when they want. Lights glow when switched on, and stay on until switched off. Personal devices, laptop computers, Teslas and other battery operated items get charged when needed. Stop lights function full time, and electric trains run on schedule. Refrigerators and freezer s work round the clock. Meals are cooked when needed. Stores are open, fully illuminated and operational when shoppers visit (ditto schools, hospitals and bureaucracies). Work schedules are regular, and one puts in a full day every day.
Whereas society is accustomed to reliable electricity, wind turbines generate unreliable electricity. Their output is intermittent, variable and unpredictable. And, other traits can differ from electricity produced by conventional generators.
How unreliable is wind electricity? In Texas, the wind turbine capacity factor routinely fluctuates FIVEFOLD during 24 hour periods. Fivefold means the highest capacity factor is 5x the lowest. For example, the capacity factor was 63.7% at 4 a.m. (an off peak time) on 31 Dec 2018 and 12.1% at 5 p.m. (a peak demand time) 30 Dec. . More than one quarter of the time, the capacity factor is less than 20%. One quarter is equivalent to 6 hours per day. The 6 hours tend to occur during business hours—when electricity demand is strong. Each year, seasonal forces reduce the capacity factor 35% while concurrently raising demand 45%. For the source data, go to the “Hourly Aggregated Wind Output” entry on www.ercot.com/gridinfo/generation.
Wind electricity is also unreliable in New England. For the source data go to: https://www.iso-ne.com/isoexpress/web/reports/operations/-/tree/daily-gen-fuel-type
For the benefit of readers not familiar with industry jargon, capacity factor is a measure of utilization. When generation equals rated capacity, the capacity factor equals 100%. A 50% capacity factor indicates rated capacity is half utilized. 10% indicates one tenth.
Because wind turbine output is erratic and frequently mismatched with electricity demand, wind turbines must be supplemented with additional equipment so society gets reliable electricity service. The additional equipment adds capital and operating costs to the system, thereby raising the full cost of service.
Actual experience and data suggest the cost of reliable electricity correlates with wind & solar’s combined share of electricity supplies. In Europe, electricity rates are highest in the two countries most dependent on renewables. The two countries are Denmark and Germany. Furthermore, rates rose more in Denmark and Germany than elsewhere in Europe while these two countries installed the bulk of their wind capacity. In Australia, rates are highest and rose fastest in the state most dependent on wind & solar (South Australia). Germany, Denmark and South Australia have the highest electricity rates in the WORLD (source: https://www.afr.com/news/australian-households-pay-highest-power-prices-in-world-20170804-gxp58a ). In the United States, electricity rates in the top 10 wind producing states as a group ROSE 7x faster than the U.S. average. The comparison period is 2008-2013 (source: https://www.forbes.com/sites/jamestaylor/2014/10/17/electricity-prices-soaring-in-top-10-wind-power-states/#70c08fbe6112 ). The conflict between experience and claims about the cost of wind electricity prompted me to look into estimates of wind turbine costs. Insights will follow in a future post.
- CO2 lags temperature
JohnStockwell at 14:17 PM on 28 November, 2018The time lag is likely an illusion caused by an age date discrepancy between the ice and the gas trapped in the ice. The ice is snow before it is ice. The atmosphere is free to circulate to the bottom of the snow layer, so the gas is considerably younger than the ice it is imbedded in. Parrenin et al 2013 found that there is no lag between CO2 and the temperature changes when both are put on the same chronology.
Synchronous Change of Atmospheric CO2 and Antarctic Temperature During the Last Deglacial Warming
F. Parrenin et al.
Science 339, 1060 (2013);
DOI: 10.1126/science.1226368 - There are genuine climate alarmists, but they're not in the same league as deniers
michael sweet at 04:16 AM on 15 July, 2018I think Dr. Waldhams has a good point. He has been deliberately insulted with the derogatory term "alarmist".
If we compare his original projection of 2013-2019 with the Met Office of the second half of the century (after 2050) which one appears more likely today? Why is it acceptable for a projection to be inacurate by being 50 years too late but alarmist to be 10 years too early?
We do not yet know when the Arctic will become ice-free. Until we know the result we do not know who will be closer to what actually happens. Dr. Walshams is sticking to his projection from 2012. The Met office has changed their projection from 2012 and made it decades earlier.
When Hansen first suggested that 5 meters sea level rise was possible most scientists rejected that idea. The IPCC projection was less than 0.5 meters. Hansen's recent paper, with 5 meters still one of the projections, had 19 co-authors. Many of those authors are sea level or glacier specialists. I saw a paper recently that projected a high maximum of 3 meters (sorry no cite). The US Climate report had a maximum of 8 feet (2.4 meters).
Every report increases the maximum. Hansen's old projection is clearly much closer to current projections of the top end than the IPCC was when he made his projection. Deniers continue to call Hansen "alarmist".
The graph from the OP sums it up:

Scientists who are well inside the top of scientific thought fall into the catastrophic range in the graph and are muzzled. It is unscientific to muzzle scientists who are in the range of scientific thought. Dr. Waldhams is at the top of scientific thought, but since he made his projection the mainstream thought has dramatically shifted in his direction. If we have melt conditions like 2007 next year who knows how low the ice could go.
Hansen's paper from 2007 on scientific reticence and projections being low-balled for political reasons is worth reading again. Time and again changes in the climate happen decades before scientists expected (arctic sea ice as a prime example). We frequently hear of reporters saying scientists will say in private converstions that they think things will go much worse than the IPCC reports. Calling those who say what they think "alarmists" is silencing everyone on the middle to right side of the graph, even though they are the majority of scientific opinion.
I generally agree with Dana but he missed the mark with this post.
- Glacier loss is accelerating because of global warming
SteveH at 12:22 PM on 20 April, 2018From the next to last paragraph in the above article - "And this is why a new study attracted my attention. A paper was just published by the American Geophysical Union that shared research carried out by Dominic Winski and his colleagues."
The mt hunter study is interesting for a number of reasons in that it confirms several things most everyone knows.
agupubs.onlinelibrary.wiley.com/doi/full/10.1002/2017JD027539
The first point is that two ice cores were drilled down to 208 meters at which point they hit rock. The 400 year point (from 2013 to 1613) was reached at 164.8 meters which left approximately 44 meters which extrapolates to approx 100-300 years for the remaining ice. in other words mt hunter was ice free sometime between 1300-1400 which coincides with the end of the MWP.
Second, this is another of several data points that indicate that the MWP was more wide spread than the convential/current climate science conclusions. This is also consitent with the exposed tree stumps from the mendenhal retreating glacier which was carbon dated circa 1000-1100ad.
Third the study points out the the melting is 60x more than circa 1850 which is to be expected since that is considered the end of the LIA.
In summary, the Mt hunter study adds additional confirmation and insight to what is already known.
- 2018 SkS Weekly Climate Change & Global Warming Digest #5
MA Rodger at 05:24 AM on 20 February, 2018It's a 10-day-old multiple-choice question and the troll still cannot aswer it.
Question @23 - Do you want to belong to group A, group B or group C?
Answer @89 - Yes!!
While the industrialised society we belong to has pulled many from poverty creating a post-Malthusian world, to suggest that the poverty figure set by the World Bank (actually 'extreme poverty' figures with income levels $1:00-a-day in 1990, $1:90-a-day today, which shows the 1990 level of 35% in extreme poverty shrinking to 10% by 2013) is properly showing the achieving of the World Bank Group’s mission “Our Dream is a World Free of Poverty” is naive in the extreme. And then the follow-on suggestion that this give the industrialised world licence to pump CO2 into the atmosphere for ever-and-a-day is a rather distasteful one.

Also the choice @91 of 'litmus test' countries France, Germany & Sweden appears designed to be annoying.
- How blogs convey and distort scientific information about polar bears and Arctic sea ice
nigelj at 07:16 AM on 29 December, 2017TPohlman @22 and 23, I have not referred to you as a "denier". Just wanted to clarify this. To me its just interesting discussion on polar bears, and thank's for the links you posted.
You say "More ice does not always imply ‘good for bears‘ any more than less ice always implies ‘bad for bears’, no matter how many times the mantra is repeated."
So are you seriously saying that no sea ice, or very small extent of sea ice, would have no effect on polar bear numbers? Come on it has to have an effect.
Look at the picture very long term. According to research by Noaa linked below, summer ice will decline drastically and spring ice during the feeding season you mentioned will also decline. Even winter ice will eventually be down to 10 - 15 %. I simply suggest this has to effect seals and polar bears.
www.theverge.com/2013/4/12/4217786/arctic-ice-free-summer-2050-noaa-study
According to NSIDC website:
"Combined with record low summertime extent, Arctic sea ice exhibited a new pattern of poor winter recovery. In the past, a low-ice year would be followed by a rebound to near-normal conditions, but 2002 was followed by two more low-ice years, both of which almost matched the 2002 record (see Arctic Sea Ice Decline Continues). Although wintertime recovery of Arctic sea ice improved somewhat after 2006, wintertime extents remained below the long-term average. In 2015, the wintertime extent set a new record low: 14.54 million square kilometers (5.612 million square miles). The next year reached a statistical tie: 14.52 million square kilometers (5.607 million square miles)."
nsidc.org/cryosphere/sotc/sea_ice.html
Sea ice is all going one way, down, down, down...
- There once was a polar bear – science vs the blogosphere
Eclectic at 13:31 PM on 2 December, 2017FMeditor @25 , you cherry-pick a couple of "failed" comments [2007 Prof X said: Arctic summers ice-free by 2013 . . . Also 2002 Prof Y said: Regular summer trade ships within a decade] to imply that all of mainstream climate science is worthless. And then you cherry-pick summer polar sea-ice extents in 2008 and 2017 . . . while turning a blind eye [= not informing your readers] to the multi-year trend while at the same time ignoring the spectacularly-large decline in summer polar sea-ice volume ; and all the associated causations of these effects [i.e. ongoing AGW]. And then another non-sequitur : you imply that Dr Crockford's PhD in zoology would/could qualify her as a new C.R.Darwin or S.J.Gould or someone of similar weighty opinion.
FMeditor, your article was worthy of the British Daily Mail. What next : Al Gore said New York would be 20 feet under water by now?!?
You have a strange way of being "a strong — even dogmatic — supporter of the IPCC and major climate agencies". Hmm, with friends like you, why would science need enemies? ;-)
On the FabiusMaximus politics, I am eclectic. Some I agree with, and some I think are "unsupported". And I also perceive that the Shakespearean Lady protests too much, about the FM lack of bias. # But all this is irrelevant to the outlier position of Dr Crockford and her lack of objectivity.
"Full information" given on the FM website? Far from it, on Crockford/AGW. Half-truths may be presented as disinformation, or OTOH may be presented in a way that is truthful & useful to the reader. It's largely the editor's choice, don't you think?
As Popper would say if alive today : the mainstream scientists have done a fine job in gathering the climate science evidence of rapid Anthropogenic Global Warming, and their predictions so far have been good . . . while the predictions (and science) by Lindzen & other "contrarians" have been appallingly bad.
- Heartland: What's your story?
Mal Adapted at 10:23 AM on 13 April, 2017fishfear,
Whether you're a professional research scientist or an interested layperson, it's important to know what sources of scientific information are reliable. Texas State Climatologist John Nielsen-Gammon has spoken and blogged about Scientific Meta-Literacy:
But there’s an important lesson here about how we decide which scientific statements to believe and which ones not to believe. Those of us who are trained scientists but who do not have enough personal literacy to independently evaluate a particular statement do not throw up our hands in despair. Instead, we evaluate the source and the context.
We scientists rely upon a hierarchy of reliability. We know that a talking head is less reliable than a press release. We know that a press release is less reliable than a paper. We know that an ordinary peer-reviewed paper is less reliable than a review article. And so on, all the way up to a National Academy report. If we’re equipped with knowledge of this hierarchy of reliability, we can generally do a good job navigating through an unfamiliar field, even if we have very little prior technical knowledge in that field.
Shortest version: if you get your climate science information from the peer-reviewed reports of working climate scientists, you'll get the closest picture of the truth. For a highly credible review of all the evidence for AGW, however, no source can be considered more trustworthy than the US National Academy of Sciences, founded by Congress in 1862 "to advise the nation on important scientific matters." Since then the NAS has scrupulously resisted all efforts to politicize its advice. New members are elected by the existing membership, and only the most widely- and well-respected candidates are so honored.
Two years ago the NAS and the Royal Society of the UK (chartered by Charles II in 1662) jointly published a 34-page booklet titled Climate Change: Evidence and Causes. It's written for educated non-scientists like yourself, and is free to download at the link. It offers a brief tutorial on climate basics, and addresses 20 questions laypeople often have about anthropogenic climate change. Links to primary sources are provided throughout.
In the Foreword to the booklet, signed by the then-presidents of both societies, the first two sentences are [all-caps in the original]:
CLIMATE CHANGE IS ONE OF THE DEFINING ISSUES OF OUR TIME. It is now more certain than ever, based on many lines of evidence, that humans are changing Earth’s climate.
I have not made an argument from authority, but from scientific meta-literacy. If you don't trust the NAS and the RS, why would you trust anyone else?
- CO2 lags temperature
Tom Curtis at 08:21 AM on 16 February, 2017Adri Norse Fire @532, first, let me say you are coping quite well with the language difference given that you are using a machine translator.
"''What is worse, you ask, "How do they know that CO2 does not come from other sources that also have low levels of radicarbon But or course, Daniel Bailey has already answered that question with 10 lines of evidence.'' He didn't and this answer was not addressed to him"
On the contrary, five of the ten lines of evidence falsify the theory that the increase in CO2 in modern times is a consequence of increased vulcansim; and a sixth renders it unlikely:
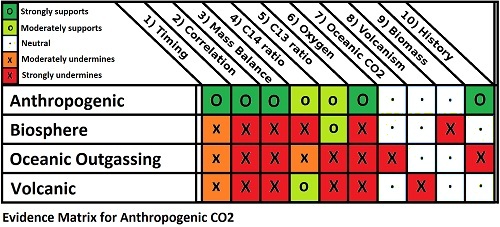
As fossil fuel and volcanic CO2 are the only C14 - free sources of carbon on the Earth, that precludes the origin being a C14 free source other than fossil fuels.
I am not sure what you meant by "this answer was not addressed to him" given that the sentence I quoted clearly came from the section of your comment headed "Daniel Bailey". I assume it is an inaccurate translation.
"I did not say that CO2 or CH3 does not produce a greenhouse effect, but the feedback effect of CO2 and other minor gases is irrelevant to climate compared to other greenhouse gases."
It is true that water vapour is a significant feedback on any warming. However, it contributes approximately 1C of warming for each 1 C contributed from another source. That means that for the glacial/interglacial cycle, including water vapour, albedo effects will have most likely contributed <30% directly, CO2 and CH4 <25%, with H2O most likely contributing <45%. Less than, because there are other short term feedbacks that are most likely to contribute about 0.5 C for each 1 C of direct warming, but may contribute 4 times that amount, but may have been a negative feedback.
Firstly, I will note that 6 - 25% contribution from CO2 and CH4 (once we account for the effect of water vapour) is not a negligible contribution.
Secondly, I will further note that H2O has a very short time to return to equilibrium in the atmosphere (weeks), so that its total atmospheric contribution is almost entirely governed by temperature. That means when we wish to determine the effect of an increase in CO2 concentration on the Earth's temperature, we can treat H2O as a feedback - and need not track it independently. That is particularly important for graphs such as this one:
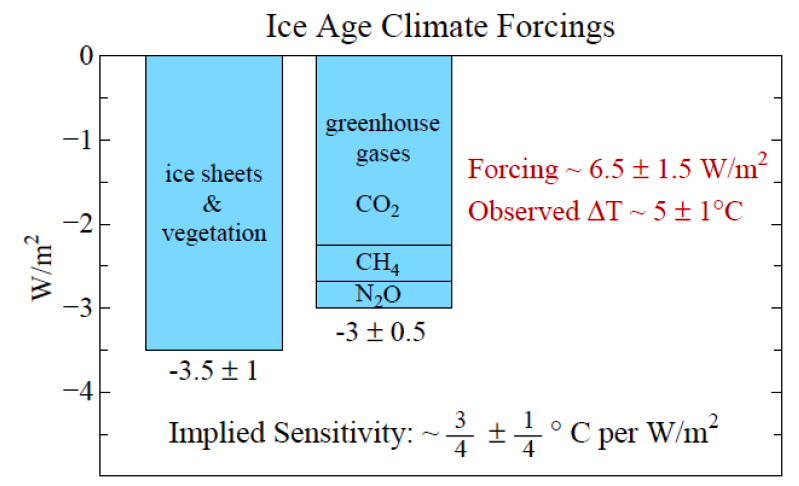
It is well known that the direct temperature effect of a change in forcing is about 1 C to 1.2 C per 3.7 W/m^2 change, and hence about 0.8 to 0.9 C for the change in forcing from last glacial maximum to the holocene. The calculation of the implied sensitivity, therefore, is not an attempt to determine that direct effect, but to determine the result of the direct temperature effect plus all short term feedbacks, including H2O. That turns out to be about 2.8 C per 3.7 W/m^2.
Because I (and others) understand the purpose examining the causes of the difference in temperature between the last glacial maximum and the holocene, we do not bother mentioning the details about components of the short term feedbacks. I will grant that when talking with a popular audience, who are not aware of the reasons for focussing on CO2 and change in glacial ice extent, that is a mistake. We should clarrify the role of short term feedbacks, and why we are focussing on CO2 (as I have now done).
"If you like correlations so much why do not you look for some of the temperature and CO2 for the last 10,000 years? Does this correlation count as evidence?"
First, if you want to be taken seriously in a scientific discussion, don't source evidence from astrology sites, as you have done with that first chart. Granted the author of that site attributes the chart to a climate scientist (Schoenwiese) without specification as to year, or publication. Fortunately the chart has been examined as an example of the misuse of scientific charts by climate "skeptics" (Schneider et al 2014). The chart is from Schoenwiese 1995, and based on Daansgard (1984) (published online in 2013). Schneider et al (2014) comment:
"many authors of skeptical media (for example Avery, 2009, and Vahrenholt und Lüning, 2012) fail to mention that this temperature estimate is based on an ice-core record from Greenland and may thus not be representative of global temperatures."
Of course, in your version it is labelled Northern Hemisphere temperatures, not global temperatures. The point still stands, however. A Greenland ice core no more shows Northern Hemisphere temperatures by itself than does a thermometer in Moscow show temperatures in Tucson, Arizona. It can be used (as Daansgard used it) as an indication of North Atlantic temperatures, but beyond the North Atlantic, its accuracy as a temperature index will rapidly fall.
Schneider et al go on:
"Most importantly, in Schönwiese's 1995 version the current and near future temperature changes are included. The recent warming goes far beyond the historic warm periods of the last 12000 years and should therefore have been included in the graph."
(My emphasis)
You should recognize that yourself. Taken at face value, the chart indicates that the Little Ice Age terminated 400 years ago. If we allow a more recent (circa 1850) termination then we must, according to that chart, acknowledge that for most of the LIA it was as warm as the peak of the Medieval Warm Period; and of course, that temperatures have since risen significantly above that peak.
Finally, here is a chart which has a fair claim to represent global holocene temperatures (but note caveats):

Note that 2004 is significantly warmer than any period prior to 1900, and that it has warmed appreciably since then.
All of this may be a side issue, but I am unsure as to what point you are trying to make with two charts of CO2 concentration over the last 800,000 years, or the chart of CO2 concentration over the Holocene.
"why the current temperature is 1.5 ° lower than the medieval warm period?"
It isn't. See chart above.
- Increasing CO2 has little to no effect
Tom Curtis at 00:46 AM on 18 January, 2017The misnamed RenaissanceMan (hereafter RM) @210 quotes Ottmar Edenhofer as saying:
"One has to free oneself from the illusion that international climate policy is environmental policy. We redistribute de facto the world’s wealth by climate policy."
The quote is a translation of a comment Edenhoffer made in an interview, where in response to the interviewer saying:
"De facto ist das eine Enteignung der Länder mit den Bodenschätzen. Das führt zu einer ganz anderen Entwicklung als der, die bisher mit Entwicklungspolitik angestossen wurde."
{"De facto, this means an expropriation of the countries with natural resources. This leads to a very different development from that which has been triggered by development policy."}
Edenhoffer replied:
"Zunächst mal haben wir Industrieländer die Atmosphäre der Weltgemeinschaft quasi enteignet. Aber man muss klar sagen: Wir verteilen durch die Klimapolitik de facto das Weltvermögen um. Dass die Besitzer von Kohle und Öl davon nicht begeistert sind, liegt auf der Hand. Man muss sich von der Illusion freimachen, dass internationale Klimapolitik Umweltpolitik ist. Das hat mit Umweltpolitik, mit Problemen wie Waldsterben oder Ozonloch, fast nichts mehr zu tun."
{"First of all, developed countries have basically expropriated the atmosphere of the world community. But one must say clearly that we redistribute de facto the world's wealth by climate policy. Obviously, the owners of coal and oil will not be enthusiastic about this. One has to free oneself from the illusion that international climate policy is environmental policy. This has almost nothing to do with environmental policy anymore, with problems such as deforestation or the ozone hole."}
(Note that the translation is by Philip Mueller, apparently for the Global Warming Policy Foundation. As that organization has repeatedly proven itself an unreliable source, I do not trust the translation, but not speaking German, must relly on it.)
Stating the obvious first, RM, or his source, has reversed the order of the two sentences he does include in the quote, and deleted three of five sentences in the paragraph, one from between the two sentences, and all without any indication of the deleted sentences existence. That sort of manipulation of other peoples words is, in academic situations considers fraud. That is because the meaning of any sentence depends on its context - and RM (or his source) completely butchers the context whilst trying to hide the fact that they have done so. So, at best RM rellies on a fraudulent source without fact checking. I note that Larry Bell similarly butchers the text in an article for Forbes. CFACT also butchers the quote, but again not in an identical form. Simon Downing also has a similar, but distinct butchering. It appears that AGW deniers are almost as bad as creationists when it comes to lying by out of context quotation. But I can find no evidence that RM is not himself an original butcher of the quote; and hence a perpetrator of a deliberate fraud.
So what is the context of the quote, and how does it effect things? Well, to begin with Edenhofer had already stated clearly, in the immediately preceding response that:
"Basically it's a big mistake to discuss climate policy separately from the major themes of globalization. The climate summit in Cancun at the end of the month is not a climate conference, but one of the largest economic conferences since the Second World War. Why? Because we have 11,000 gigatons of carbon in the coal reserves in the soil under our feet - and we must emit only 400 gigatons in the atmosphere if we want to keep the 2-degree target. 11 000 to 400 - there is no getting around the fact that most of the fossil reserves must remain in the soil."
That is, he has clearly acknowledged the objective of climate policy, ie, to keep the increase in Global Means Surface Temperature to 2 degrees celsius or less. But in doing so, he notes that the policy necessarilly will have impacts beyond the environmental, and specifically economic impacts. He clarrifies what that means afterwords. Specifically, the choice of different responses to AGW will de facto result in different consequences for the distribution of global wealth. He has already mentioned one example in the response before that (ie, two responses before the one RM, or source, butchered):
"That will change immediately if global emission rights are distributed. If this happens, on a per capita basis, then Africa will be the big winner, and huge amounts of money will flow there. This will have enormous implications for development policy. And it will raise the question if these countries can deal responsibly with so much money at all."
I might note that the current approach, of limits on emissions as a percentage of a nations current emissions locks in higher living standards for the first world as part of the treaty system well into the future.
No reasonable climate policy can be devised without noting, and negotiating these de facto effects. But they are, as Edenhofer clearly states, even in the butchered version of the quote, de facto effects. That is, consequences that were not the intended consequence of the policy.
- Russian email hackers keep playing us for fools
adamski at 16:12 PM on 10 January, 2017Tom @30. U.S. Intel Chiefs have a history of deceiving the public ( Glenn Greenwald). Who can forget James Clapper performance before Congree regarding the NSA in 2013?? So then - where is the evidence?? The latest report again says nothing on this, a report which was claimed to be why the 35 diplomats were deported. The phrase “we assess” was used 19 times without a single fact to demonstrate Russian involvement. In other words we, the intelligence community, have made a judgment, and you, the American people, must take it on faith. NSA even gave it a moderate vote of confidence.
So lets look at your reasons.
Malware - It cannot be claimed that tools such as X-Agent have been exclusively sourced by Russia when it can be shown others have access and these tools and the infrastructure the DNC hackers allegedly used are not evidence that points to any specific actor. Indeed any cyber-crime actor, like the NSA, seeks to disguise as a different actor when committing attacks. Something that "proves" that A did it is likely to have been created by B, C or D to disguise as A. All such hacking tools use freely available infrastructure like TOR or rented networks from cyber-crime wholesalers like the recently exposed Israeli denial-of-service franchiser.
Crowdstiker - FBI claims that democracts refuse full access to DNC servers. Did C/striker get this? How do you do a thorough investigation without full access?
Putin - stated that he would like a cooperative relationship with US. With Clinton comparing him to Hitler, naturally look to the othr side. How many time have we heard the US state thier preferred candidate.
Assange - WikiLeaks conducted themselves as actual journalists, not stenographers for the CIA and Pentagon, and made the secret documents public, damaging the candidate who was the overwhelming favorite of the military-intelligence leadership. If you think the publication by WikiLeaks of US military and diplomatic communications that document war crimes in Iraq and Afghanistan and conspiracies against governments around the world is treasonous, then you and I have a major difference.
- No longer taken seriously, we're seeing the last gasp of climate denial groups
Rocketscientist at 09:31 AM on 10 November, 2016Your ‘congregation’ could do with a little more of a balanced assessment of the points raised by Ridely (and many others).
I have a degree in Physics and helped developed the first satellite communication satellite systems used around the world i.e. so while not an expert I can understand the science involved. I'm also a greenie, left winger by nature and was initially at least very concerned by Al Gore’s ‘famous’ work. After spending a LOT of time and effort looking into the issues involved I came away impressed by much of the science of global warming - particular the ice age reconstructions - but extremely disappointed by much of the work on 'climate modelling'. The CO2 modelling fails the most basic of tests in that it HAS CONTINUNALLY FAILED to predict current trends or more importantly replicate the past paleoclimatic cycle data. To match the short term recent temperature data the models have continually required after the fact hindsight tweaking to match the data or the data has required tweaking.
So, when 'sceptics' point this out give them a little credit and admit the science is far from perfect. I've quoted your own assessment of Christies report below to point out the problem. You should acknowledge and THANK him instead you denigrate!
'So, this recent paper did a few things. First, they took the contrarian argument that the mid-troposphere temperatures have been rising at only 1/3 the rate predicted by models. They found that Christy’s team neglected the contamination of the cooling in the upper stratosphere. When they applied this correction, they found that Christy’s claim was incorrect. Differences between modelled and observed warming rates were much smaller, and had known explanations'.
The abstract is also provided below
‘We use updated and improved satellite retrievals of the temperature of the mid- to upper troposphere (TMT) to address key questions about the size and significance of TMT trends, agreement with model-derived TMT values, and whether models and satellite data show similar vertical profiles of warming. A recent study claimed that TMT trends over 1979 and 2015 are three times larger in climate models than in satellite data, but did not correct for the contribution TMT trends receive from stratospheric cooling. Here we show that the average ratio of modeled and observed TMT trends is sensitive to both satellite data uncertainties and to model-data differences in stratospheric cooling. When the impact of lower stratospheric cooling on TMT is accounted for, and when the most recent versions of satellite datasets are used, the previously claimed ratio of three between simulated and observed near-global TMT trends is reduced to ≈ 1.7. Next, we assess the validity of the statement that satellite data show no significant tropospheric warming over the last 18 years. This claim is not supported by our analysis: in five out of six corrected satellite TMT records, significant global-scale tropospheric warming has occurred within the last 18 years. Finally, we address long-standing concerns regarding discrepancies in modeled and observed vertical profiles of warming in the tropical atmosphere. We show that amplification of tropical warming between the lower and mid- to upper troposphere is now in close agreement in the average of 37 climate models and in one updated satellite record.’
To get the models to match it was also necessary to mess with the basic satellite data itself as well - probably for good reason but none the less more after the fact hindsight fiddling - yet AGAIN. Now all this is fine - that's how science and the models advance but at least acknowledge the problem and the fact that the science is NOT OVER. (PS the factor of 3 error was reduced to 1.7 – WELL DONE)
The other major problem is that none of these, what I call CO2 forcing factor driven models have manage to replicate the past ice age cycle data. Especially if the CO2 levels allowed to 'free run' rather than being artificially forced to match the ice core data response. The problem with the later should be obvious – does CO2 drive temperature or does temperature drive CO2 – obviously, a combination of both but the two factors need to be isolated.
This is basic 101 stuff - you have to validate major model assumptions before they have any credibility. The ONLY work that managed to do this as far as I've been able to determine was a paper (peer reviewed) published in 2013 in Nature. ' Insolation-driven 100,000-year glacial cycles and hysteresis of ice-sheet volume.' This to me was a major piece of work which has largely been ignored. This group finally managed to replicate the past ice age cycle behaviour largely using insolation factors coupled with isostatic rebound of the continental plates. I'm sure you'll be aware of this work and its potential importance. Basically, they appear to have demonstrated that you do NOT need to assign an artificially high forcing factor to CO2 to replicate the cycles. As they noted from their sensitivity runs 'Carbon dioxide is involved, but is not determinative, in the evolution of the 100,000-year glacial cycles.'
FINALLY, you avoided the other incredibly important issue totally - which is to question whether a warmer, wetter planet with higher CO2 levels is a BAD outcome. The greening of the planet since the end of the last ice age has directly enabled us to develop agriculture and societies to the point that we now all enjoy. Past geological data also readily indicates the planet has been much warmer in the past and lush as a result. Plants have done an incredible job in terraforming the atmosphere reducing CO2 to TRACE levels. I noticed that there was no response to Ridley’s and other’s arguments in this respect.
These are important issues and as Ridley rightly points out the concern is that attention and resources are being diverted from much more important ecological and social concerns.
PS I wonder whether this post will survive your ‘peer’ review? - Barack Obama is the first climate president
sauerj at 14:25 PM on 4 November, 2016Tom @3: Thanks for your feedback. 1) On mandatory %renewable requirements on energy consumed, I still worry that the ratio of btu per capita will simply go up in step w/ reductions in %FF/total consumed energy. We will consume energy with whatever money we have available; as prices drop, we will use more. Net effect: no reduction in carbon emissions, until higher prices drive industry & markets to lower cost solutions. 2) Cap & Trade is a viable solution (Shi-Ling Hsu rates it as #2 best option in Case for Carbon Tax), but he & Hansen's complaints seem logical, a) not as effective as free market cost, leakage likely, b) arbitrary carbon ceiling limits likely lower industry's cessation potential, c) middle-man economic burdens. 3) Agree that 100% fee & dividend may be hard to pass, and sadly the end result may instead be some sort of payroll tax offset (like mentioned on Dicaprio's recent BTF video). Yes, this would not have the broad reaching efficacy as the full CCL CFD proposal. But, what is missing is not getting congress to act, what is missing is political will from the public (but I would be naive to think that is an easy nut to break, but the growing Climate Solutions Causcas, with 20 & growing congress members, gives one hope).
Lastly, it is likely that I believe in CFD so much because Hansen gave such a convincing argument for it (& its simple logic) in his Storms book, which was my first indepth introduction to AGW science.
John @4&5: Thanks for your feedback. 1) Pre Mar-2016 (when I joined CCL), 18 hits came up for 'Citizens Climate Lobby', but only 6 of these 18 articles had any real mention of CCL (others were only CCL authors or the word 'Citizens' separately or no mention of CCL at all, not sure why they were hits). What I was thinking about was an article with CFD and CCL blaringly in the title. 2) But, alas, I admit, I was wrong! One of these 18 articles (HERE, dated 6-18-2013, by Dana) was all about CFD and CCL. A very good promotional article, with CFD and CCL blaringly in the title! Thanks SkS for promoting CCL at that time; I am sorely sorry that I missed the opportunity it gave me then. Although, at that time, there was no CCL chapter in my town. Now, there are chapters in almost every district. Maybe it would be good to occasionaly re-run this article as it is very good, and may help other people like me to connect the dots & get involved. 2) Dana's concluding paragraph was so apropos to my situation. Here is how I think many the average reader (like me) feels: Struggles for some way to help, some way to get involved. Extremely depressed because he/she has come to realize that everything he/she has ever done their whole life (30+ years, in my case, of engineering over $100 million of manufacturing expansions) was all based on wrong economics and therefore was all wrong! And, more so, realizes that he/she can't do any real good now because they are enslaved by the status quo, as their family's subsistence depends on abiding with the status quo. There really isn't much a person like this can do but lie to their colleagues thru-out the work day and feel, deep down, that all they are really doing is screwing the people of the future. 3) I am sure that the SkS vision includes empowering individuals like this to get involved in as effective ways as possible; after all, it all boils down to getting carbon emissions down, using any good means possible. Now, based on my readings, I had assumed that all would have agreed that CFD is king, and that everything else is less effective, hence my frustation why CFD and CCL isn't promoted more. (My error, as I see now that there was in fact one such good article). Maybe I'm not so right on CFD being king, but one thing is true, the CCL organization is extremely talented, organized and wise. And, it gives a person, like me, something (powerful I think) to finally work for, and that makes all the difference. Now my life is not a complete contradiction of my morals. For this reason of citizen empowerment, I would hope that SkS would repeatedly rally to promote CCL, and its effective vision of CFD, its depth of talent & passion, its deep organization and the grace of its spirit. There may be many a person, like me, still out there that may need a smack over the head, i.e. an article that connects the dots and says in blaring letters: 'Go Here to Help!'
- GHG emission mitigation solutions - a challenge for the Right?
RedBaron at 11:41 AM on 30 September, 2016@scaddenp,
On another thread you said, "If you can see an effective solution to mitigation of CO2 that the libertarians can live with, then please share in detail on this thread. Fresh ideas are extremely welcome."
That's actually pretty easy. There are right wing Libertain Christians (probably right wing Libertarian athiests too) mitigating AGW in their own small way already. Yes that's right, right wing Libertarian free market capitalists making 6 and 7 figure income annually and mitigating AGW all at the same time.
Don't be confused by the current crop of neo-conservatives currently in power in the US. They are not even conservatives really, just refugees from the left wing. They believe in high taxation and big government every bit as much as the most left wing liberal socialist.
A substantial number of neoconservatives were originally moderate socialists associated with the right-wing of the Socialist Party of America (SP), and its successor, Social Democrats, USA (SDUSA).
Neoconservatism ... originated in the 1970s as a movement of anti-Soviet liberals and social democrats in the tradition of Truman, Kennedy, Johnson, Humphrey and Henry ('Scoop') Jackson, many of whom preferred to call themselves 'paleoliberals.' [After the end of the Cold War] ... many 'paleoliberals' drifted back to the Democratic center ... Today's neocons are a shrunken remnant of the original broad neocon coalition. Nevertheless, the origins of their ideology on the left are still apparent. The fact that most of the younger neocons were never on the left is irrelevant; they are the intellectual (and, in the case of William Kristol and John Podhoretz, the literal) heirs of older ex-leftists.
Notable people associated with neoconservatism
The list includes public people identified as personally neoconservative at an important time or a high official with numerous neoconservative advisers, such as George W. Bush and Richard Cheney.Politicians
George W. Bush announces his $74.7 billion wartime supplemental budget request as Donald Rumsfeld and Paul Wolfowitz look on.
Jeb Bush (R) – 43rd Governor of Florida (1999–2007) and 2016 presidential candidate[122]
Newt Gingrich (R) – Representative from Georgia's 6th congressional district (1979–99), Speaker of the House of Representatives (1995–99) and 2012 presidential candidate[123]
Lindsey Graham (R) – Representative from South Carolina (1995–2003), Senator (2003–present) and 2016 presidential candidate[124]
Peter T. King (R) – Representative from New York's 3rd congressional district (1993–2013) and New York's 2nd congressional district (2013–present)[125]
Jon Kyl (R) – Representative from Arizona (1987–95), U.S. Senator (1995–2013) and House Minority Whip (2007–13)[126]
Joe Lieberman (I) – 21st Attorney General of Connecticut (1983–89), Senator from Connecticut (1989–2013) and 2000 Democratic vice presidential nominee[127]
John McCain (R) – Representative from Arizona (1983–87), Senator (1987–present) and 2008 Republican presidential nominee[128]
Tim Pawlenty (R) – 39th Governor of Minnesota (2003–11) and 2012 presidential candidate[129]
Mike Rogers (R) – U.S. Representative from Michigan's 8th congressional district (2001–15)[130]
Mitt Romney (R) – 70th Governor of (2003–07), 2008 presidential candidate and 2012 Republican presidential nominee[131][132][133]
Jim Talent (R) – Representative from Missouri (1993–2001) and Senator (2002–07)[134]
Government officials
Elliot Abrams (R) – Foreign policy adviser.[135]
William Bennett (R) – Chairman of the National Endowment for the Humanities (1981–85), Director of the National Drug Control Policy (1989–90) and U.S. Secretary of Education (1985–88)[136]
William G. Boykin – Under Secretary of Defense for Intelligence
Eliot A. Cohen – U.S. State Department Counselor (2007–09), now Robert E. Osgood Professor of Strategic Studies at the Paul H. Nitze School of Advanced International Studies at the Johns Hopkins University.[137]
Jeane Kirkpatrick (R) – Ambassador to the United Nations[138]
Scooter Libby (R) – Chief–of–Staff to Dick Cheney[139]
Victoria Nuland – Assistant Secretary of State, foreign policy adviser to Vice President Dick Cheney.[140]
Richard Perle (R) – Assistant Secretary of Defense and lobbyist.[141]
Karl Rove (R) – Senior Advisor to the President of the United States (2001–07) and White House Deputy Chief of Staff (2005–07)[142]
Paul Wolfowitz (R) – State and Defense Department official[143]
R. James Woolsey Jr. (D) – 16th Director of Central Intelligence, Under Secretary of the Navy and green energy lobbyist[1]
So what does a true conservative, who also happens to be a Libertarian, mitigating AGW at a tidy profit in a free market look like?
Be sure and watch all three episode of Meet the Farmer. A lot of what he talks about are related to food security and government regulations, but interspersed between stories of his battles with the government are a few references to the carbon footprint of his farm. And if you know what to look for, you can actually see causation as to why a system that wasn't necessarily developed for AGW mitigation, actually does mitigate AGW through biological carbon capture and storage (BCCS) and reduced emissions. See if you can spot this evidence.
- IPCC special report to scrutinise ‘feasibility’ of 1.5C climate goal
RedBaron at 06:39 AM on 29 September, 2016@9 John Hartz,
Claimed in the link you provided:
"It is possible the natural processes that remove methane from the atmosphere have slowed down, but it is more likely that there’s been an increase of methane emission instead, especially from the hot wet tropics, according to the authors."
In my opinion both are happening. Agriculture as it is most widely practised now is both reducing the natural processes that remove methane, and in some cases increasing methane emissions. So the net component of increasing atmospheric methane that agriculture is responcible for is dramatically rising due to the effect agriculture has on both sides of the methane cycle.
You asked how can BCCS make a significant contribution to mitigating this contribution to manmade climate change? Well starting with wetlands emissions, the primary agricultural component to that portion of the methane cycle is paddy rice production. So in the case of rice, a shift to SRI would be a significant improvement.
• Reduced greenhouse gas (GHG) emissions from paddy soils
o Methane (CH4) is reduced by between 22%
and 64%, as soils are maintained under mostly
aerobic conditions [10,11,3]
o Nitrous oxide (N2O) is only slightly increased
or sometimes reduced as use of N fertilizers is
reduced; N20 increases do not offset CH4
reductions, so GWP is reduced [9,10,11,12]
oTotal global warming potential (GWP) from
flooded rice paddies is reduced 20-30%
[10,12,3], even up to 73% [11]The System of Rice Intensification (SRI)… … is climate-smart rice production
SRI has over 700 published journal articles which can be found here: JOURNAL ARTICLES ABOUT THE SYSTEM OF RICE INTENSIFICATION (SRI)
Please note that yields per hectare are increased at the same time as the impact to AGW is reduced. You will also find that many of the outliers mentioned in the above quote are also the same outliers in yields too. In other words, the farmers that reduce emissions the most are also the same farmers yielding the most. (and the farmers sequestering the most carbon in the soil) And the farmers producing the record yields have little to no impact on AGW any longer at all. It can not be emphasized enough how important this breakthrough is, as the methane signature from rice cultivation goes back thousands of years according to the Ruddiman Early Anthropocene Hypothesis .
The next biggest agricultural component to methane increases is related to the way we currently practice animal husbandry. This component is primarily driven by reducing the natural processes that remove methane from the atmosphere. Since ruminants and other animals have been passing gas since the beginning of time, it is less an emissions problem but rather a symptom of soil degradation caused by the way we currently raise grains (largely to feed animals in confinement).
In my opinion methane is an animal husbandry problem primarily because of CAFO's. It is not a problem in a properly managed grassland/savanna biome. After all those biomes supported many millions and millions of grazers who were extirpated. The methane levels before they were extirpated were actually lower than now! According to the following studies those biomes actually reduce atmospheric methane due to the action of Methanotrophic microorganisms that use methane as their only source of energy and carbon. Even more carbon being pumped into the soil! Nitrogen too, as they are also free living nitrogen fixers.
Grasslands and their soils can be considered sinks for atmospheric CO2, CH4, and water vapor, and their
Cenozoic evolution a contribution to long-term global climatic cooling. Cenozoic Expansion of Grasslands and Climatic CoolingThe subsurface location of methanotrophs means that energy
requirements for maintenance and growth are obtained from
CH4 concentrations that are lower than atmospheric. Soil Microorganisms as Controllers of Atmospheric Trace Gases
(H2, CO, CH4, OCS, N2O, and NO)Upland (i.e., well-drained, oxic) soils are a net sink for atmospheric methane; as methane diffuses from the atmosphere into these soils, methane consuming (i.e., methanotrophic) bacteria oxidize it. IMPACT OF METHANOTROPH ECOLOGY ON UPLAND METHANE
BIOGEOCHEMISTRY IN GRASSLAND SOILSNevertheless, no CH4 was released when soil surface CH4 fluxes were measured simultaneously. The results thus demonstrate the high CH4 oxidation potential of the thin aerobic topsoil horizon in a non-aquatic ecosystem. Methane fluxes from differentially managed grassland study plots: the important role of CH4 oxidation in grassland with a high potential for CH4 production.
Of all the CH4 sources and sinks, the biotic sink strength is the most responsive to variation in human activities. Environmental impacts on the diversity of methane-cycling microbes and their resultant function
The CH4 uptake rate was only 20% of that in the woodland in an adjacent area that had been uncultivated for the same period but kept as rough grassland by the annual removal of trees and shrubs and, since 1960, grazed during the summer by sheep. It is suggested that the continuous input of urea through animal excreta was mainly responsible for this difference. Another undisturbed woodland area with an acidic soil reaction (pH 4.1) did not oxidize any CH4. Methane oxidation in soil as affected by land use, soil pH and N fertilization
I pulled a few quotes out to make my case, but I highly recommend you read the sources in their entirety and even find further educational materials, since this is a highly complex subject.
The main summary being, the current system used to raise animals in confinement has removed them from the farmland, where when managed properly their methane emissions are part of a larger agricultural system that oxidizes more methane than the animals emit. Since this biological oxidation of methane occurs below the soil surface where that carbon enters the soil food web, actually animals improve the BCCS systems even more than without them. This actually has been known for decades and is well vetted, but was never quantified for climate scientists. Sir Albert Howard, father of organic agriculture, noted this effect on soil biology (of removing farm animals from the land and replacing their impact with synthetic fertilizers) way back in the 1940s.
“As the small trickle of results grows into an avalanche — as is now happening overseas — it will soon be realized that the animal is our farming partner and no practice and no knowledge which ignores this fact will contribute anything to human welfare or indeed will have any chance either of usefulness or of survival.” Sir Albert Howard
In my honest opinion one reason for the recent spike in atmospheric methane is simply the fruition of Sir Albert Howard's dire prediction, since we continue to ignore this.
The third part of the link you submitted talks about increased emissions from natural wetlands. I am less familiar with this portion of their claims, but I can hypothesize that it could potentially be related in part to agricultural runoff causing anaerobic conditions (dead zones), since most decomposition under anaerobic conditions does produce large quantities of methane. Fertilizer Runoff Overwhelms Streams and Rivers--Creating Vast "Dead Zones" Ironically the "King Corn" lobby is so huge, that even though the above article from Scientific America admits the primary cause cropland runoff of synthetic nitrogen, they actually propose:
the only way to increase ethanol production from corn and reduce nitrogen runoff would be for Americans to stop eating meat, thereby freeing up corn used as livestock feed for other uses.
While also stating:
"That [also] means not utilizing all the land to grow crops."
Apparently they don't see the irony in these two statements. The solution of course is not to grow corn for ruminants at all and dramatically reduce its usage for other livestock. And not to use corn for ethanol production at all. (excepting a nice corn whiskey) There are other ways to feed animals and distill ethanol more efficiently than using "king corn" surpluses. So step one is to stop subsidizing the over production of corn and soy and changing our production models to more efficient regenerative models of production that don't cause AGW.
- Climate urgency: we've locked in more global warming than people realize
RedBaron at 14:37 PM on 18 August, 2016@saileshrao,
One solution is parallel to Freeman Dyson’s geoengineering “solution” of just plant more trees. There are many reasons this won’t work, but the basic one is that planting trees increases stocks, but doesn’t stabilize fluxes. Using the bucket analogy, you have a created a bigger bucket, but still a bucket with no drain. It helps temporarily … until the new bigger bucket gets full. We call that Saturation. It’s a temporary fix that helps, but it is not a long term solution.
However, maybe even accidently, Dyson might have stumbled onto something that can solve AGW to the benefit of all.
Atmospheric CO2 level is the primary human impact we can change that directly influences energy flows. It comes down to the carbon cycle and the CO2 fertilization effect. Dyson is correct BTW that there is more carbon in the soil than in biomass and atmosphere combined. Also correct about the fertilization effect on plant growth. This is what is called a stabilizing feedback. The debunkers of Dyson are also correct about the increasing emissions from the labile fraction of soil carbon as temperature increases. Called a reinforcing feedback.
Here is where it gets interesting. Dyson AND the vast majority of the Dyson debunking sources have focused on the wrong biome. It is NOT the forest plants that have the capability to mitigate AGW. It’s the grassland/savanna biome that actually can be a forcing for global cooling, and counter the current global warming trend.
In a forest, the stabilizing feedbacks and the reinforcing feedbacks largely counter each other, and little is done long term to mitigate rising CO2 levels. Once you reach that saturation point you are done. You might even decrease albedo. But grasslands sequester carbon very differently than forests. Most grassland carbon is not sequestered in biomass, nor labile carbon in the top O horizon of the soil, but rather the newly discovered liquid carbon pathway. Grasslands also have higher albedo.
Most terrestrial biosphere carbon storage is in grassland (mollic) soils. Where trees store most their products of photosynthesis in woody biomass, grasslands instead of producing a woody tree truck, secrete excess products of photosynthesis (exudates) to feed the soil food web, especially mycorrhizal fungi. Those fungi (AMF) in turn secrete a newly discovered compound called glomalin deep in the soil profile. Glomalin itself has a 1/2 life of 7–42 years if left undisturbed. The deepest deposits even longer with a 1/2 life of 300 years or more in the right conditions. Then when it does degrade a large % forms humic polymers that tightly bind to the soil mineral substrate and can last thousands of years undisturbed. Together they all form what is called a mollic epipedon. That’s your really good deep fertile soils of the world and they contain far more carbon, even in their highly degraded state currently, than all the terrestrial biomass and atmospheric CO2 put together. This LCP is what built those famously deep and fertile midwest soils.
Even though wood is resistant to decay, the biomass of forests is still considered part of the active carbon cycle (labile carbon) That litter layer on the forest floor is relatively shallow, and most that decay ends up back in the atmosphere, unless locked in some kind of peat bog or permafrost. Tightly bound soil carbon in a mollic epipedon is considered differently than the labile carbon pool. It is the stable fraction of soil carbon, and grassland biomes pump 30% or more of their total products of photosynthesis into this liquid carbon pathway.
The importance of this recent discovery of the Liquid Carbon Pathway (photosynthesis-root exudates-mycorrhizal fungi-glomalin-humic polymers-mollic epipedon) to climate science AND agriculture can not be stressed enough.
Glomalin: A soil protein important in soil sequestration
Glomalin Is Key To Locking Up Soil Carbon
Liquid carbon pathway unrecognised
Cenozoic Expansion of Grasslands and Climatic Cooling
So while specifically Dyson was wrong, he has identified in the most general terms the pathway forward. “Plants” is too general. Forests is categorically wrong, although we still need them for their rapid buffering capability on climate as well as many other important ecosystem services, not to mention lumber. But the forcing of CO2 mitigation long term comes from the grassland biome, now largely under agricultural management and that is plants after all. Dyson got the wrong plants and the wrong soils, but did hit on the right concept.
The real question is can this mitigation strategy work within conservative ideals so that a political coalition between both liberals and conservatives can be made to devise a plan acceptable to both? It is pretty obvious that a carbon tax has and will continue to meet with opposition.
I believe it is possible, yes. But certain areas will take dramatic change for that to happen. Most importantly energy and agriculture. Right now both those sectors have already overgrown what can be sustained. Quite predictable since they were never really sustainable since the industrial revolution anyway. Just took a while for people to realise it.
For it to happen though, agriculture production models will need to be changed to regenerative systems, energy will need technological fixes like solar and nuclear etc. and overall since population has already exceeded environmental capacity, a large amount of ecosystem recovery projects will be needed as well. So yeah, reforesting can be a part where appropriate. All of these are possible, however I personally believe they are unlikely to happen on their own given social and institutional inertia.
My focus is on agriculture. Having studied it quite intensely for years, I believe we currently have the ability to fix that one. Only a few minor gaps remain. I can only hope others committed to the other two big ones meet with similar success. But then comes the hard part, actually doing what we know how to do before these unsustainable systems currently in effect start failing world wide, collapsing even our ability to do what we know how to do! That’s the actual tricky part.
For example, if agriculture fails before we fully institute regenerative models and the infrastructure changes needed, civilization collapses. Not much going to be done about it then. AGW will see to it that all three will fail if changes are not done soon enough. Once again with the potential to collapse civilization, or at least many nations including ours. Again making it near impossible to implement what we already know how to do.
So how do we institute the changes needed in a free market economic base beneficial to mitigating AGW?
The most important leg is agriculture. The answer may be more simple than you think. The rise of “king corn” can be seen as a direct result of a series of changes in agricultural policy instituted by Earl Lauer Butz, Secretary of Agriculture under Presidents Richard Nixon and Gerald Ford. Most important to this policy change was the Buffer stock scheme (ever full granary) combined with urgings to farmers to “get big or get out”. (Which happened by the way. Now there is actually a crisis from too few family farmers, average age being 60.) That led to huge surpluses which we then were able to successfully use for many purposes, including major grain sales to Russia and China and many humanitarian aid projects.
Something has changed though. Now China has opened up beef sales. This is a value added commodity over grain. It makes more sense to drop the buffer stock scheme on grain, and instead I propose a buffer stock scheme on grass fed beef instead. You can do this on the same amount of subsidies that we currently use for grain, and instead put them on restoring the great prairies/steppes/savannas of the world….raising beef. This would positively affect carbon sequestration, pesticide use, erosion, seasonal dead zones in our productive coastal waters, biodiversity, energy budget, economic growth, international trade balance, rural economic development, etc… AND if done properly, as many case studies at the USDA-SARE & USDA-NRCS clearly show, even increase total yields of food for humans.
So to fully answer, instead of adding a carbon tax, one way to solve this is simply change what we subsidize. No need for new taxes. In agriculture instead of a buffer stock scheme on king corn, a buffer stock scheme on carbon being sequestered in soils. Just redirect the same amount of funds away from one to the other. Same goes for energy. Fossil-fuel consumption subsidies worldwide amounted to $493 billion in 2014, with subsidies to oil products representing over half of the total. Those subsidies were over four-times the value of subsidies to renewable energy. Simply redirect the subsidies for fossil fuels over to renewables. Doesn’t necessarily need to cost one penny more.
The idea that we are still subsidizing AGW, while trying to find solutions to AGW is quite frankly ridiculous. Goes to the wise old saying, “A house divided against itself can not stand.”
Now for some interesting general numbers. “Under appropriate conditions, 30-40% of the carbon fixed in green leaves can be transferred to soil and rapidly humified, resulting in rates of soil carbon sequestration in the order of 5-20 tonnes of CO2 per hectare per year.”
Liquid carbon pathway unrecognised
Fast facts: The State of the World’s Land and Water Resources
5-20 tonnes of CO2 per hectare per year x 1.5 billion hectares = 7.5 - 30.0 billion tonnes of CO2 per year AND that's just arable cropland, that doesn't even include the ecosystem recovery projects that could be done on degraded desertified rangeland mentioned by Allan Savory in his famous TedTalk. That's actually a larger area of land, but much more complicated to calculate. Because some rangeland is healthy and currently sequestering carbon in the LCP. A larger % is degraded by overgrazing and/or undergrazing, both causes of desertification and either nearly net zero flux, or actually a CO2 emissions source. Depending on the brittleness factor, they also each respond differently when properly managed. So it is difficult to quantify exactly how much more CO2 could be sequestered per year restoring these areas, but likely even more total (but less per hectare). China's restoration project of the desertified Loess Plateau early results shows just how significant this can be.
Soil carbon sequestration potential for "Grain for Green" project in Loess Plateau, China
Pasture Cropping: A Regenerative Solution from Down Under
The System of Rice Intensification (SRI)…
… is climate-smart rice productionThe next two have USDA case studies on file with the USDA, and instructional vids. I will post both.
No-Till Case Study, Brown's Ranch: Improving Soil Health Improves ...
Gabe Brown: Keys To Building a Healthy Soil
and
12 Aprils Grazing Dairy Manual
Trantham's Sustainable 12 Aprils Dairy Grazing Program: A Top Farm that Almost Went Under
As you can see, more food per acre. Little to no cost. More profitable. Large enough.
- Lomborg: a detailed citation analysis
ubrew12 at 06:16 AM on 27 April, 2015PluviAL@30 said: "something motivates... [Lomborg] and his supporters, and it is not just money." You claim open-mindedness. Open your mind to the possibility that it is, in fact, just money. Even consider the possibility that Lomborg, himself, may not know it. He is skeptical, he says so, and money flows his way. Why wouldn't he continue down that path that has worked so well for him? According to this article, "Lomborg operates by attaching himself to these centres as an adjunct professor... rather than a staff member. This offers the freedom to command remuneration well above a professorial salary – such as the US$775,000 he was paid in 2012 by... [his U.S. based Copenhagen Consensus Center] and the US$200,484 paid... in 2013."
As regards Lomborgs economic arguments, I'm reading 'Climate Shock' by economists Wagner and Weitzman. Once CO2 rises to 560ppm (this is almost certain by 2050 or so), the probability of hitting 1.5C to 4.5C is 66% (IPCC estimate). But that probability has a positively skewed distribution with a high end 'fat tail'. Assuming a 6C rise means mass extinction (very likely) and profound disruption to the global economy (also very likely), then there is already a small (0.04%) chance of hitting 6C already, at todays 400ppm CO2. But, by mid-century, at 560ppm, that probability increases a hundred-fold, to 4%. That's a 1-in-25 chance, higher odds than of hitting 'snake eyes' when rolling two dice. And that level of risk is already 'dialed in' because we can't 'decarbon' the economy fast enough to avoid it. A game-theorist should understand 'Pascals Wager': why risk a 'wait-n-see' on carbon, if the punishment is eternal damnation? As the authors state "The appropriate price on carbon is one that will make us comfortable enough to know that we will never get to anything close to 6C."
- There's no empirical evidence
RedBaron at 16:56 PM on 26 February, 2015I also have found very limited maths concerning this as well! It is an over looked but in my opinion highly important part of the problem! It's an oversite that in my opinion causes the IPCC analyses to be flawed! There is however some information out there. It just hasn't been rigorously applied to climate science models. At least not to my satisfaction.
But let's start with historical ecosystems prior to the anthropocene. (the proposed epoch that began when human activities had a significant global impact on the Earth's ecosystems)
https://www.zotero.org/jsebastiantello/items/itemKey/Z6B9F3QE
"the truly novel event of the Cenozoic was the evolution and expansion of grasslands, with their uniquely coevolved grasses and grazers. Neogene expansion of the climatic and geographic range of grasslands at the expense of woodlands is now revealed by recent studies of paleosols, fossils, and their stable isotopic compositions. Grasslands and their soils can be considered sinks for atmospheric CO2,CH4, and water vapor, and their Cenozoic evolution a contribution to long-term global climatic cooling. Grassland soils are richer in organic matter than are woodland and desert soils of comparable climates, and when eroded, their crumb clods form sediment unusually rich in organic matter. Grasslands also promote export of bicarbonate and nutrient cations to lakes and to the oceans where they stimulate productivity and C burial"
So according to Retallack, the primary driver that gave us the climate we humans evolved in was the grassland/grazer biome. Admittedly taking geological time to evolve. Grasslands/graziers didn't just pop into existence and immediately take over 1/2 the worlds forests. But the biome is the biome that once established did make a major contribution to our climate. So this is the biome that historically originally pulled down our carbon to pre-industrial levels. Simply removing that biome would tend to cause climate to rebalance at pre-Cenozoic levels. (much warmer and wetter than we are now)
Now look at agriculture. What is the primary agricultural ground? Yes some of it is cleared forests and alfisols. But they tend to loose their carbon and fertility quite rapidly. The prime agricultural land is regions like the midwest North American plains. Particularly the tall grass prairie. Why? because that's where the deep fertile mollic soils are primarily formed! But those ecosystems are largely extirpated and replaced by artificial agricultural ecosystems. Even in the dryer plains/savanna areas of the world, the grazers are largely extinct or extirpated, causing those grasslands to no longer effectively function as carbon sinks. Replaced once again with agriculture, either dryland crop production or livestock. Often many of those grasslands are burned due to there not being nearly enough animal impact to cycle the vegetation.
Because of this we get analysis from many sources already mentioned in this thread: "Since 1750, anthropogenic land use change have resulted into about 50 million km2 being used for cropland and pasture, corresponding to about 38% of the total ice-free land area (Foley et al., 2007, 2011)"
It's not just that 38% is in agriculture. But the prime arable land is almost completely under agriculture. It's not evenly distributed. Mountains and deserts have far less % of the land in agriculture. Agriculture rests primarily right in the middle of the best land, which also is the land responcible for mitigating carbon increases in the atmosphere! So that 38% is right in the same land that potentially would be mitigating our fossil fuel emissions. Quantifying it is hard though. Entire regions and whole trophic levels of the biomes are gone. We are not going to let loose millions and millions of bison in Iowa corn country and let them and the wolves roam freely to measure what carbon would have been sequestered if we hadn't extirpated them. Certainly can't bring back the extinct megafauna of the planet. So hard numbers on that are very difficult to get.
But what we can and have done is develope models of agriculture with farming methods that function as carbon sinks. They have been measured compared to conventional best management practises currently being used.
Here is an example: LINK
and
http://www.esajournals.org/doi/abs/10.1890/1051-0761(2001)011%5B0343:GMACIG%5D2.0.CO%3B2
These studies show that best management practises on both rangeland and planted pasture increases CO2 sequestration by 11 tons CO2/ha/yr simply by regenerating ecosystem function. You couldn't of course say all grassland does that, but it shows an INCREASE over conventional by that amount in those locations. Some areas like Iowa probably would be more as the conventional model there is corn fed instead of grass fed. Here is a white paper by the author of the first paper descibing the potential if that model were applied worldwide:
It's not as easy to restore ecosystem function without animal impact. But relatively good results have been achieved by David Brandt on traditional row crops. Documented by USDA NRCS on Brandts demonstration farm.
Unlikely to reach the historic 8-10% SOC with Brandts system as it doesn't include animals. But he has achieved results as high as 4-5% SOC sequestered in a decade even in a row crop model. (no til with multi species covers)
There are systems out there that integrate all three of the above that have achieved the historic 11%!
- Uncertainty, sensitivity and policy: Kevin Cowtan's AGU presentation
Kevin C at 09:54 AM on 17 January, 2015This is a very brief outline. It's late and I'm tired, so apologies for the poor writing:
Why do we reconstruct temperatures over sea ice from land temperatures? There are four sources of evidence on which this decision was made:
- The physics.
- The models.
- The observations.
- The experts.
But first, one thing needs to be clear: rapid arctic warming is a winter phenomena. The central arctic can't warm in summer, because melting ice holds the temperature around zero. That's vital to understand the rest of this discussion - we are talking about something which happens in winter.
The physics
Global mean surface temperature is based on historical records, which limit how we can measure it. We can't use brightness temperatures because we don't have the data. We've got weather station data, so we use 2m air temperatures. But marine air temperatures are unreliable, so we use sea surface temperature as a proxy for air temperature over the oceans.
When it comes to understanding the physics of the problem, to a first approximation we can say that the sun heats the surface and the surface heats the air. If the surface is cool, it can cool the air too. That's true for land or ocean.
The big difference is that ocean surface is liquid, and surface mixing means that the effective surface heat capacity is much greater than for land. (Waves and spray improve heat exchange with the air too). As a result, temperature variation over land is much greater than over the oceans, whether it be diurnal or seasonal. Many of us experience this if we visit the coast - temperatures swings become smaller as you approach the sea.
What happens over sea ice? The air temperature is no longer coupled to the water temperature. Ice is a reasonable insulator, and snow on ice is very good (Kurtz et al 2011). So the thing which makes oceans different from land has gone away. Air temperatures over water behave differently from air temperatures over land. Air temperatures over sea ice, especially with a covering of snow, behave like air temperatures over land.
This different behaviour can be seen in the land and ocean temperature data. They show different amounts of variation over time, and they vary spatially over different distances. And if we use the land and ocean data to reconstruct temperatures in the isolated central arctic, we get very different results - mainly because of the different behaviour of the temperatures fields (but the distance to the nearest observation plays a role too).
The models
The reanalysis models incorporate the physics, including freezing/melting effects. And as we saw in my last post, the three modern models agree well with our reconstruction. Here's a month-by-month comparison to MERRA, comparing kriging reconstructions from the land and ocean data respectively. This is for the most isolated region of the central arctic, chosen to be most distant from any weather station, and so it's as hard as it gets. The SST based reconstruction doesn't show remotely enough variation, whereas the land data shows the right sort of variability, and fairly good agreement with the features even for the most isolated region of the Arctic.

Observations
In the paper we did a comparison over the same region with the international arctic buoy program (IABP) data of Rigor et al. In particular they produced a dataset by kriging combining land stations and temperatures measured on ice buoys in the central arctic. We showed a comparison with IABP in the paper. Rigor et al also examined kriging ranges by season, and found that while the distances over which temperatures were correlated in the summer were small, in winter they could be up to 1000km, including between land and ice stations.
In addition, the AVHRR satellite data also show rapid arctic warming comparable to reanalysis models. So there are two independent source of observational data showing similar behaviour over ice to us.
The experts
Because I was worried about this issue, I went to the 2013 EarthTemp meeting on temperatures in the Arctic. Which meant I could ask the experts about how air temperatures behave over sea ice. And they produced the same answer, for basically the theoretical reasons I outlined above.
Practical aspects
So what would happen if we were to reconstruct temperatures over the central arctic from sea surface temperatures instead of from air temperatures?
Winter sea ice extent hasn't changed as much as summer extent, which means that the limit of the winter sea ice hasn't moved very far. Sea surface temperatures at the edge of the sea ice are anchored at around freezing for the same reason as arctic temperatures in the summer. Further away from the ice other factors, such as tropic sea surface temperature and meridional heat transport also play a role. Even so, the variation in sea surface temperature in the northernmost sea cells in winter is small, and as a result a reconstruction from sea surface temperature will never show much change.
In other words, if we reconstruct air temperatures over sea ice from sea surface temperatures, we are imposing a constraint that the central arctic can not change in temperature, even in winter. But we're doing so with no physical basis - the freezing of water more than 1500km away doesn't constrain temperatures, any more than sea surface temperatures can do much to moderate temperature extremes 1500km inland.
- Examining Hansen's prediction about the West Side Highway
Tom Curtis at 13:00 PM on 25 December, 2014michael sweet @94, a couple of points.
First, on see level rise it is well worth looking at the blog posts by Aslak Grinsted, particularly
his view in 2009, his update of that view in 2013 in light of three recent papers; and his view on the rate of sea level rise. From those pages, his 2009 graph is very interesting and does not require major modification in light of the later papers:

This plots expected sea level rise relative to projected long term global temperature anomalies. As we are already committed to somewhere between 6 and 25 meters of sea level rise, with a mean estimate of about 12 meters (values judged by eye from the graph).
All three recent papers suggest the increase in sea level with temperature will be fairly flat for a given temperature range, and then ramp up suddenly. The disagree, however, about the temperature range. The empirical data suggests greater than 20 meters of sea level rise even for a 2 C rise in temperature. The model based data suggests we will not reach 20 meters even at about 5 C. Grinsted's take is that:
"At 2°C (383 ppm) we will lose the Greenland ice sheet. We do not really know how strongly the West Antarctic will respond. There is evidence of a large response during the last interglacial though (e.g. this).
At 4°C (525 ppm) then we are pretty much committed to an eventual complete deglaciation of both the West Antarctic ice sheet and the Greenland ice sheet.
At 6°C (720 ppm) we may be committed to an ice free planet."On short term sea level rise, these are his semi-empirical predictions, with uncertainties:

The second point is that projecting Earth System Sensitivity, or even Equilibrium Climate Sensitivity on current CO2 levels is ill advised as the CO2 levels will reduce if we eliminate all net greenhouse emissions. That is big if, as even 5% of emissions is likely to maintain levels at a constant value, and any higher than that (and certainly if higher than 10%) will result in an ongoing increase. I suspect, however, that if we can transition to a renewable energy economy, zero net emissions is feasible provided we keep in mind that it is necessary to avoid the worst consequences of climate change.
- Arctic sea ice has recovered
MA Rodger at 07:31 AM on 21 December, 2014Responding to off-topic comment here (as is #68 & #69 above).
The David Rose item in the Rail on Sunday of 30/8/14 basically does the usual Rose trick of "hiding his bogus decline" in AGW predictions by making such predictions as extreme as possible and then proving them to be in error. Sadly, and Rose is a real saddo, he is unable to do this without misrepresenting those extreme positions and his proofs.
To debunk his 30/8/14 piece would take a while to write out. But it would likely start something like this.
☻ Rose misrepresents what Gore said in 2007. Firstly Gore was reporting what others had said and secondly he mentioned two predictions for an ice-free summer - 7 years and 22 years. Rose usually plays an extremly strong game misrepresenting AGW comment.
☻ The 25th August date is a bit of a cherry-pick. A couple of days earlier and it would have been "since 2009" not since "since 2006" because 2009, 2013 and 2015 SIE were very similar through the height of the melt season.
☻Rose mischaracterises the period 2012-14. Most of the SIE increase (90%) occurred 2012-13. His comment about 'consentrations' is likewise a mischaracterisation. Most of the SIA increase (95%) occurred 2012-13. So his news story is a year out-of-date. SIV is however more even between the two years.
☻ Judy Curry is more a denialist blog-mom these days and no longer a pukka climatologist. Her assertion that the "death spiral" is (or will be) entering a reversal which will last decades is air-headed lunacy of her own creation.
And on and on and on. - It's cooling
Tom Curtis at 09:30 AM on 21 November, 2014pbjamm, if you follow the link to find out how to obtain your free copy of his book (it turns out you can obtain the free book by sending him $5 - and I doubt very much you will be sent the hard cover version shown, and suspect you will be emailed a PDF), you find a list of his basic arguments. They are in order:
1) Climate Science is a conspiracy for financial gain (maintained without evidence, emphasizes the amount at stake by confusing "border protection" with customs and immigration control. Perhaps that is an American usage, but I would have taken border protection to include the entire activities of the Homeland security department plus the military, on which basis his claims are egregiously false.)
2) It has not warmed. Based solely on RSS over the last 39 years. He makes the outrageously false claim that temperatures have only been measured for the last 39 years (news, of course, to the Hadley Center, University of East Anglia, NOAA, GISS, BEST, and the maintainers of the Japanese index, whose name currently escapes me).
3) Global warming has paused (based solely on RSS temperatures which he incorrectly also attributes to NOAA and NASA on the basis that those agencies use the data. If he is a scientist, he knows that his attribution on that basis is fraudulent.
4) The oceans are getting colder, for which his evidence is:
5) Arctic sea ice extent is growing (based on the fact that 2013 had more ice than 2012)
6) There is no consensus (based the fact that Al Gore emits CO2, and on the fraudulent claim that the Cook et al consensus is actually 1%)
7) Climate has changed before; based on the unsupported claim that climate change was a big factor in Alexander the Great's conquest of Persia (which is possible, but news to me), and the LIA.
He then goes into his own version of it's the Sun, based on mathturbation which is presumably in the book so I cannot comment further, except to note that it is not original (not even in 2007) and is definitively refuted by direct measurements of solar forcing.
Finally he finishes with the obligatory UEA email hack out of context quotations.
All these have been copiously discussed on SkS before, and most feature in the climate myths. If you want a more detailed rebutal, you will need to spend $5 US for your "free" book that even the pseudoskeptics consider a scam, but I am not going to waste my money (which is better spent on one seventh of a scientific paper).
- Global warming: a battle for evangelical Christian hearts and minds
paul at 03:18 AM on 4 October, 2014@DSL,
Since Im not a scientist heres a couple of links about the polar ice caps melting.
http://wattsupwiththat.com/2013/12/16/nature-proves-al-gore-wrong-again/http://stevengoddard.wordpress.com/ice-free-arctic-forecasts/
DSL, some models have been proven faulty. Some models are tweaked by omitting some of the numbers. For example, I could show you a warming or cooling trend by cherry picking the years the planet warms or cools and Im not even a scientist.
no global warming for 18 years 1 month
The Great Pause is the longest continuous period without any warming in the global instrumental temperature record since the satellites first watched in 1979. It has endured for a little over half the satellite temperature record. Yet the Pause coincides with a continuing, rapid increase in atmospheric CO2 concentration.
http://wattsupwiththat.com/2014/10/02/its-official-no-global-warming-for-18-years-1-month/
Blogs like this one would establish credibility to openly disavow politicians like Al Gore. Politics using scare tactics to openly advance agendas that have everything to do with money and nothing to do with saving the planet have effectively ruined any and all good faith in the sciences. Many people like me simply do not believe the climate change agenda.
It really irritates me to see blogs like this wanting to win the hearts and minds of Christians by telling them their religion is make believe.
When your minds are already made up about Christians how can you present yourself in good faith?
As for believing the "greenhouse effect" theory I cant really say I do or don't. What I know for sure is that the polar bears are doing just fine, the polar ice caps are doing just fine and last years winter was one of the coldest on record.
I think you guys need to rethink your approach to climate change. Theres been to many glitches along the way and blogs, such as Skeptical Science, never seem to root out the riff raff, such as Al Gore, among the rank and file. It is jaw dropping that he showed his face at the climate change march.
So, spare me the Psalm references and stick to science.
- Antarctica is gaining ice
Tom Curtis at 11:24 AM on 25 September, 2014jetfuel @282, googling a sentence is not the same as reading the article. Nor is failing to read the article is not evidence a sentenc is not in that article. It is only evidence that your approach is evidence free. For your benefit, however, here is the sentence with sufficient context to easilly locate it within the article:
"Introduction
With a capacity to resolve detailed patterns of elevation change at the scale of glacier drainage basins [Shepherd et al., 2002; Davis and Ferguson, 2004; Pritchard et al., 2009; Remy and Parouty, 2009; Shepherd et al., 2004; Wingham et al., 2006; Zwally et al., 2005], repeat satellite altimetry has transformed our ability to study the polar ice sheets. Nevertheless, direct measurements of elevation change have been restricted by the latitudinal limits of satellite altimeter orbits (81.5° and 86.0° for conventional radar and laser systems, respectively), by the reduced performance of conventional radar altimeters over the steep terrain that is typical of ice sheet margins and by the irregular temporal sampling of satellite laser altimeter data due to the episodic nature of ICESat mission campaigns and due to the presence of clouds. These limitations have precluded, for example, comprehensive assessments of Antarctic Peninsula volume change, and altimeter data omission may also explain differences in mass balance estimates for other ice sheet regions [Shepherd et al., 2012]. CryoSat-2 was designed to overcome several of the limiting factors that previous satellite altimeters faced, with an orbital limit extending to 88° and a novel synthetic aperture radar interferometry mode providing measurements of fine spatial resolution in areas of steep terrain [Wingham et al., 2006]. Here we use CryoSat-2 data acquired between November 2010 and September 2013 to produce the first altimeter-derived estimates of volume and mass change for the entire Antarctic ice sheet.Data and Methods
..."
(Bolding of section headings in original, bolding of relevant sentence mine.)
Jetfuel @281, your pet theory.
That NBC made the same error as you six days after you made it does not prove you derived your theory from them. Nor does NBC claiming something relating to science to be fact prove it is, given the notoriously poor standard of scientific reporting by MSM.
Further, trying to score rhetorical points of a point where you have already acknowledged your error (@274) just makes you look silly. Are you now trying to take that back (with a complete absence of relevant evidence)? Or are you just trying to sow as much confusion as you can? Either way you have just ratcheted your credibility another notch lower.
- Thousands of ‘Nameless Short-Lived Lakes’
Tom Curtis at 14:49 PM on 13 September, 2014Riduna @1, the IPCC discusses these issues in FAQ 13.2, saying of Greenland:
"In Greenland, mass loss through more surface ablation and outflow dominates a possible recent trend towards increased accumulation in the interior. Estimated mass loss due to surface ablation has doubled since the early 1990s. This trend is expected to continue over the next century as more of the ice sheet experiences surface ablation for longer periods. Indeed, projections for the 21st century suggest that increasing mass loss will dominate over weakly increasing accumulation. The refreezing of melt water within the snow pack high up on the ice sheet offers an important (though perhaps temporary) dampening effect on the relation between atmospheric warming and mass loss.
Although the observed response of outlet glaciers is both complex and highly variable, iceberg calving from many of Greenland’s major outlet glaciers has increased substantially over the last decade, and constitutes an appreciable additional mass loss. This seems to be related to the intrusion of warm water into the coastal seas around Greenland, but it is not clear whether this phenomenon is related to inter-decadal variability, such as the North Atlantic Oscillation, or a longer term trend associated with greenhouse gas–induced warming. Projecting its effect on 21st century outflow is therefore difficult, but it does highlight the apparent sensitivity of outflow to ocean warming. The effects of more surface melt water on the lubrication of the ice sheet’s bed, and the ability of warmer ice to deform more easily, may lead to greater rates of flow, but the link to recent increases in outflow is unclear. Change in the net difference between surface ablation and accumulation is projected to contribute between 10 and 160 mm to sea level rise in 2081-2100 (relative to 1986-2005), while increased outflow is projected to contribute a further 10 to 70 mm (Table 13.5).
The Greenland ice sheet has contributed to a rise in global mean sea level over the last few decades, and this trend is expected to increase during this century. Unlike Antarctica, Greenland has no known large-scale instabilities that might generate an abrupt increase in sea level rise over the 21st century. A threshold may exist, however, so that continued shrinkage might become irreversible over multi-centennial time scales, even if the climate were to return to a pre-industrial state over centennial time scales. Although mass loss through the calving of icebergs may increase in future decades, this process will eventually end when the ice margin retreats onto bedrock above sea level where the bulk of the ice sheet resides."
The most important points are the uncertainty as to whether the large increase in ice loss is due to the NAO or to global warming, and the fact that any runaway process will ground out (last sentence in the quote).
As it happens, Jason Box was a contributing author to that chapter. That does not mean the chapter reflects his views, but it does mean his views were given due consideration. Therefore to the extent that his views differ, they do not reflect the consensus of relevant experts.
Having said that, there is a divide among the relevant experts between those favouring "process based" and those favouring "semi empirical" based projections. The later give consistently higher projections than those obtained by the process based methods (on which the IPCC headline results are based, as shown in the IPCC Fig 13.12:

Figures a, b, c and d are for RCP scenarios 2.6, 4.5, 6.0, and 8.5 respectively. The black line is the median process based projection with the likely (66%) range shown in grey. Blue estimates are based on temperatures, red on forcings, with the bars showing the "extremely likely" (95%) range.
Based on that, sea level rise one or even two meters greater than IPCC projections cannot be excluded, but there is no basis in the literature for Hansen's projection of 5 meters. It should be noted that the IPCC preffers the process based projections because they are assessed as having medium confidence, while the semi emperical projections are assessed as having low confidence.
- US State Department underestimates carbon pollution from Keystone XL
Andy Skuce at 09:30 AM on 31 August, 2014Russ,
I certainly agree that there should be an end to all fossil fuel subsidies. However, most of the direct subsidies occur outside of developing nations and are focussed on petroleum products and gas. All theses images are from Brad Plummer.

None of this is within the political control of our governments and is well beyond the influence of climate activists. People often scold anti-pipeline activists for a lack of attention to coal. Coal is the big beast of climate change, it is true, but removing direct fossil-fuel subsidies would do little to affect coal consumption, because the subsidies are so small.
Once we start to look at the full subsidy, by including a $25 per tonne of CO2e charge for climate damage, then we start to see much bigger numbers and much bigger slices attributable to rich countries (blue) and bigger amounts aimed at coal.

Applying this tax and getting rid of the effective subsidy is within the theoretical power of our governments and would make a big difference to emissions. In fact, if this policy was in place globally I would likely drop my opposition to new oilsands infrastructure. Probably, whatever I decided to do would be moot, because a global carbon tax would reduce demand and price new carbon-intensive bitumen projects out of the picture.
Now, you are rightly concerned about tax leakage, as one country charges a carbon tax while its trading partners get a free ride and a boost to competitivity by not charging one. This would not be easy to solve, but a border fee could be imposed on imports within WTO rules, at least according to this presentation via the Citizens' Climate Lobby.
Having said all of that, getting a carbon tax introduced with our current governments in advanced economies appears to be a very long shot, although I will continue to lobby and vote for it. In the meantime, I will continue to focus part of my energy on stopping individual infrastructure projects. At least we have a fighting chance to score a win there on KXL and the pipeline projects through BC to the Pacific.
- Rapid climate changes more deadly than asteroid impacts in Earth’s past – study shows.
howardlee at 01:35 AM on 30 May, 2014Billthefrog @16 wow, there's a lot in there! I'll do my best...
The Faint Young Sun Paradox is still just that - a paradox. We know from sediments at the time that there was liquid water and normal sedimentary processes, so the Earth was not frozen solid. The work of William Moore shows that very early Earth was essentially in Large Igneous Province mode all the time. There was a lot of CO2 in the atmosphere as plate tectonics handn't started yet (subduction started ~3.2 billion years ago) so the world was basically covered in volcanic islands, but lacked the large mountain ranges and surface area for weathering to draw down CO2 so fast. Yet experiments on fossil raindrops suggest the atmosphere was not so dense, so alternative atmospheric gas mixes have been inferred. We also know the oceans had about 26% more water in them, so the Earth's albedo was likely much lower. By the time of the ice ages @2.9, & 2.5Ga, subduction had started and continents had grown, and oceans had reduced somewhat, but until oxygen arrived the atmosphere was methane-rich. There's much more than I can fit here and it is still an area of ongoing research, and there has even been a suggestion that the sun back then might have been 5% larger (effectively negating the faint young sun paradox).
Regarding the slow decline of CO2 and temperatures since the Eocene hyperthermals, see this post. This decline has been correlated with a reduction in subduction zone length by Prof Zeebe and others. One critical event was the marooning of Antarctica by continental drift and the establishment of the Antarctic Circumpolar Current 33.5-30 million years ago, but increased weathering (Hymalayas, Andes) had a role. I reccomend THE book on the subject: "Earth's Climate Past and Future" by Bill Ruddiman. Hope this goes some way to answering your post.
- It's cooling
Dikran Marsupial at 19:56 PM on 8 May, 2014Just to add to Tom's comment on the three recovery winters, thisimage from the NSIDC puts those winters into context very nicely:
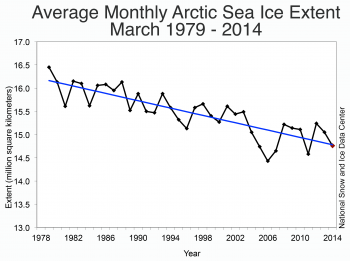
The annual maximum sea ice extent usually takes place in March each year, and as you can see the last three winters have basically followed the long term declining trend in March sea ice.
My recommendation to jetfuel is to look at the long term trends because measurements for individual years or a few years are too susceptible to cherry picking. As Tom says, the winter sea ice extent maximum is not a good predictor of the summer minimum, as it depends a lot on Arctic weather during the summer (which causes a lot of variability around the long term trend). Also we should expect a larger *increase* in sea ice following a decreasing summer minima, simply because it leaves more open water to freeze (which gives a good opportunity for a misleading report of the "recovery", indeed SkS rebutted such arguments made by WUWT and Steve Goddard last year).
- Brandis confuses right to be heard with right to be taken seriously
MA Rodger at 01:22 AM on 8 May, 2014It was curious that somebody who professed to have been “a strong supporter of alarming warming during the 90's” and who stated they still consider CO2 emissions cuts and renewable energy are “great outcomes,” would have managed to effect some major upheaval in his understanding of things climatological caused by such a banal reason of somebody claiming it will soon never again snow in London (shock-horror), or some ridiculous claim that seas will rise by 9 metres by 2100.
That this same person also considered a 6ºC global temperature increase in the same light (which I believe is an upper value projected by IPCC AR5 under BAU), had problems accepting the millennial NH temperature reconstruction of Mann et al 1999 (an presumably every other such reconstruction produced since 1999) while picking out the Daily Mail-esque nonsense-claim of an ice-free Arctic by 2013 as yet another profound gripe – how can this have been a serious student of climatology? Surely such claims were far too puerile to be legitimate.
- Brandis confuses right to be heard with right to be taken seriously
CBDunkerson at 21:47 PM on 7 May, 2014Warren wrote: "...the increasingly absolute belief systems of the AGW lobby (Mann's flawed hockey stick graph, climate gate, It won't snow in London again, the Arctic will be ice free by 2013, etc.etc.) caused me to adopt a contrarian and skeptical view."
So you have based your position on lies and nonsense... and continue to hold that position even when shown that these things are lies and nonsense.
Sorry, that doesn't make you a 'skeptic'.
- Brandis confuses right to be heard with right to be taken seriously
Glenn Tamblyn at 18:08 PM on 7 May, 2014Warren, regarding no Arctic sea ice by 2013, that was a projection by one modelling group and actually was 2016 +/- 3years.
This is a graph of Arctic sea ice volume from PIOMAS since 1979. Each line is one month with the green bottom line being September. The bottom axis is zero volume.
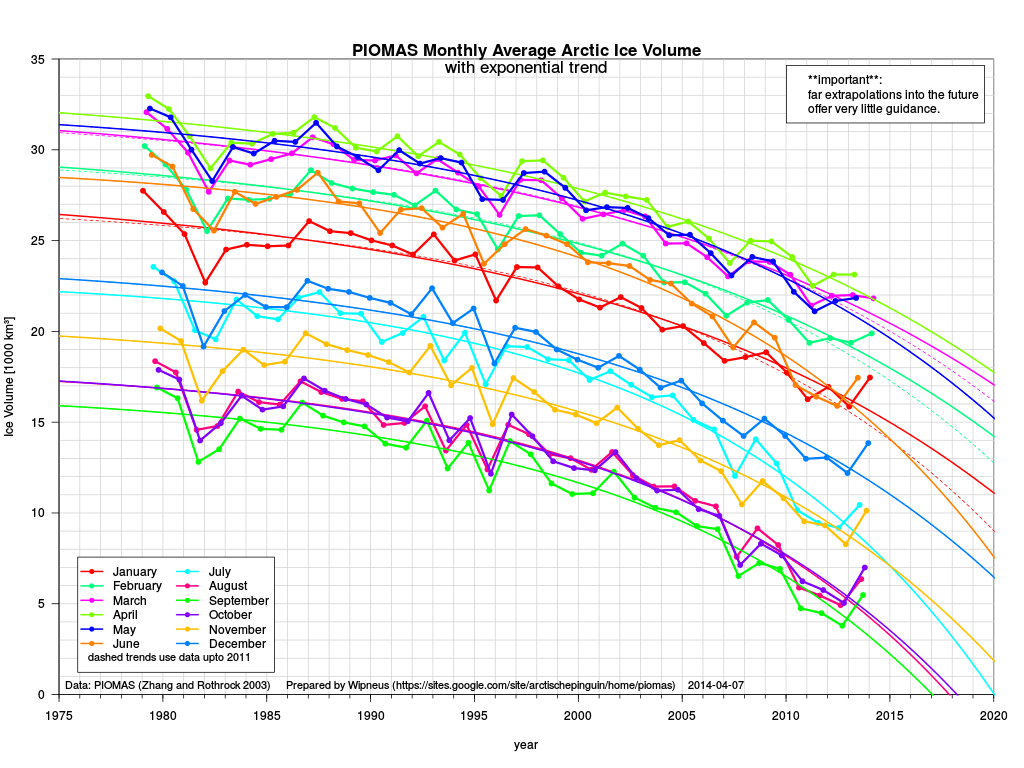
After last years mild season ice volume ticked back up so now the trend projection is saying 2016/17 for zero. Prior to last year the projection was saying 2015/16. Ice volume up there has returned to what it was a year ago - the 'recovery' has evaporated away. Will ice reach zero by 2016? Its not certain, but it is also quite plausible that it could.
So '... but you still have to give me "Ice free Arctic"...'. What do you think the data is suggesting
- Brandis confuses right to be heard with right to be taken seriously
Dikran Marsupial at 17:43 PM on 7 May, 2014Warren, the claim that the Arctic may be ice free by 2013 was made by one (1) scientist, the IPCC reports (and the majority of Arctic sea ice scientists) did not agree with that projection. So what you are doing is cherry picking headlines and not bothering to check whether they were actually in accordance with the mainstream scientific position.
Here is a hint, if you think some climate change claim is alarmist, try looking to see what the IPCC reports say about it.
- Brandis confuses right to be heard with right to be taken seriously
Dave123 at 17:25 PM on 7 May, 2014Warren, I'd like to have said I was astonished by your reply, but I found it sadly predictable.
I still believe these are great outcomes but the increasingly outlandish claims of 9m sealevel rise and 6c temp rise by the end of the century and the increasingly absolute belief systems of the AGW lobby (Mann's flawed hockey stick graph, climate gate, It won't snow in London again, the Arctic will be ice free by 2013, etc.etc.) caused me to adopt a contrarian and skeptical view.
As others have noted, the moment you added the "C" to AGW you betrayed a propagandistic stance towards matters. Adding the 'catastrophic' to AGW was simply a branding tactic by a political opposition that had no basis in published work. Your use suggests either you don't know manipulation and propaganda when you see it, or that you are willfully interested in propogating a false meme. Which is it?
Moving on to the hockey stick, I'm not sure what your apparent concession to TonyW means, but in any case you've not made it clear what you think the importance of the hockey stick is. Again, this is a dismissive stance, that isn't about understanding but about something else entirely. To be blunt: do you recognize that Mann's original 1998 work has been replicated and extended by other groups using other proxies and statistical methods? If not, in terms of this debate you're talking about, I and many others here are far more technically competent than you to evaluate the claims and methods: what hope do you have of persuading us? Referring to JoNova? Part of the issue Warren, is that you have to have the technical chops to know when a McIntyre or Nova is simply wrong. If you don't have those skills, like I do, then you can't be a skeptic... you're simply a bystander to something you don't understand.
Moving on then to the disappearance of Artic sea ice in summer, you surely know that one group reported results of 2013-2019. It's one group, reporting a preliminary result, not a consensus opinion and you distort it when you aren't sayig 2016+/- 3 years. It is a perfectly normal and expected part of science for someone to publish a finding of this sort "hey, we tried a new approach and it gave these interesting results". The whole point of this is so that other people can look at the approach, see if they think it is correct. You don't seem to register this part of normal science and instead seem to be taking a legalistic approach of constructing an advocacy case- an approach with no obligation to consider the findings as a whole. So if this is the sort of debate you think is productive, you've probably signed your death warrant as far as being seen as someone who a scientist can have a productive discussion with.
I think the same applies to the "no snow in London" business. AFAIK that was one remark, not published paper, and the modeling results for the UK tend to show the kind of winter England just had. And again it seems that you have a barrister's approach to things- finding one little thing and stripping it of context.
This is what the UK Met office shows these days. Why is it not the story rather than whatever the no snow in London story?
So when you say "increasingly outlandish claims" say for sea level, you ignore the mainstream projections, and take some sort of odd umbrage that outliers in the scientific work exist.
Beyond that you give the appearance of advocating some sort of censorship of worst case assessments. Kerry Emmanual, of MIT (where I got my doctorate) makes a strong case for the importance of including the long tail risks, because leaving them out would be misleading. On my own authority and training (industrial process safety and hazards analysis) I think he's quite right. In my reports to management I certainly included the long tail risks and mitigation strategies.
In toto, I don't think you've provided an example of facts changing your mind, rather you've provided examples of how you get lost in the whole business and can't see the forest from the trees. It certainly doesn't give me any warm feelings on the possibility of rational interchange with the WUWT and JoNova factories, and even further ignores whether these folks or you really matter anyhow.
- Brandis confuses right to be heard with right to be taken seriously
Warren Hindmarsh at 15:14 PM on 7 May, 2014Dave123 You asked where I have changed my mind and I have to be careful here because the last few comments have been way off topic of this post which is about the link of set beliefs and AGW denial.
Any way, yes I did follow the warming debate and you could probably say I was a strong supporter of alarming warming during the 90's. I considered it had a lot of credibility after all, no matter what the case, to cut CO2 emissions pollution and promote renewable energy are all great outcomes.
I still believe these are great outcomes but the increasingly outlandish claims of 9m sealevel rise and 6c temp rise by the end of the century and the increasingly absolute belief systems of the AGW lobby (Mann's flawed hockey stick graph, climate gate, It won't snow in London again, the Arctic will be ice free by 2013, etc.etc.) caused me to adopt a contrarian and skeptical view.
In other words with each global warming claim now I go and check the fact, it's not that difficult these days.
Contrary to the above post I consider a skeptical inquiring mind as a strength. I recommend it.
- Skeptical Science consensus paper voted ERL's best article of 2013
Timothy Chase at 15:07 PM on 23 April, 2014Congratulations! I believe this is well-deserved.
Given the role of free market ideologies in all this, I believe it is worthwhile to keep in mind the following points:
- The fossil fuel industry receives massive subsidies.
- Power utilities are typically government regulated monopolies, and both solar and wind that generates power sold back to the grid offers a more decentralized approach - an approach that is already supported by some libertarian and tea party groups.
- Carbon taxes can be revenue neutral, and with an "across the board" approach in which carbon taxes are entirely offset by reductions in other taxes there is no reason why they can't be implimented on a local level while the regions that apply them remain competitve with those that have yet to do so. (British Columbia seems to be doing quite well at $27.88 per ton with corresponding reductions in income tax.)
Personally? I was a libertarian of sorts (Objectivist, actually, for about a decade and a half), and I am still quite sympathetic towards that sort of world view. I also recognize industrial climate disruption as the single greatest issue facing humanity of our time. Failing to address it will make people impoverished and desperate, and the freedom of the individual tends to be greatly discounted under such conditions.
- 2014 SkS Weekly News Roundup #10B
chriskoz at 12:18 PM on 12 March, 2014Tom@16,
Very useful links, thanks.
I note the following from your QLD link:
When will the 44 cent [FiT] rate expire?
Under the Electricity Act 1994, the 44 cent rate is due to expire on 1 July 2028, for those who maintain their eligibility.
That's far worse than NSW's until end of 2016. I wonder how many eligibles for such essentially free lifetime gift of monies are there. As I said before, govs would do far better by terminating those contracts and settling with some lump sum of money, rather than killing the growth of PV industry, as you describe. That's really sad news: the worst imaginable from the GHG emission perspective. I just cannot believe that it happens in such state as QLD, Australia where solar energy potential is the largest in the developed world :(( The only hope is that the storage alternatives become cheaper and the competition from the comunity cooperatives will force the silly govs to quickly change their minds.
The wholesale price report is quite old (2008) although still interesting to look at, esp. the spikes in prices over $4000MWh in summer. I'd like to get my hand on a newer report, from 2013, when every fifth household in OZ got their PV installed, and at the same time we hit the record hot summer nationwide. I know for example that grid penetration of renewables in SA (mainly wind) became very signifficant (perhaps some 30%+?), and the overall demand figures has fallen, condradicting the fossil-fueled "expert predictions", so the production picture looks very different now.
- Cartoon: the climate contrarian guide to managing risk
Tom Curtis at 10:48 AM on 10 March, 2014Russ R @72, if you recall, what I originally indicated @47, and which you challenged, was:
"Fox & Gallant estimate the costs of transferring to renewables on the assumption that all gross costs of electricity generation are also net costs. That is, they assume that increased investment in renewable energy will not be partly offset by reduced investment in coal fired power plants. That fact alone means that their headline result does not follow from their analysis"
That should have been straightforward enough for you, but apparently not.
In simple terms, if Ontario had not embarked on a LTEP to switch to carbon reduced* power generation, costs of electricity to the consumer would still have risen. They would have risen with increased wages due to inflation. Potentially they would have risen due to increased costs of fossil fuels. They would have risen due to increased investment in fossil fuel power stations to meet demand. The real cost of the choice to go to carbon reduced electricity, therefore, is the difference between the cost of that decision, and the cost of the cheapest alternative energy plan that did not take a reduced carbon route, but which similarly increased generation capacity. In economic terms, that approximates to the opportunity cost.
The LTEP does not itemize that opportunity cost. It does not compare the cost of the LTEP to an alternative, high carbon plan that would have been pursued instead. Consequently referring back to the 2010 LTEP does not account for those opportunity costs. Nor does it show how their adjustments (even if considered legitimate) would effect alter the opportunity cost.
For what it is worth, the 2013 LTEP indicates that the total cost of coal use was 4.4 billion a year. That is 25% of the 2013 total cost of electricity generation, and 22% of 2030 costs. (These figures underestimate the cost of coal as they compare 2003 nominal values with 2030 nominal values.) Health costs alone could have risen above 3 billion per annum (2005 study cited by 2010 LTEP).
You introduced Fox and Gallant to show that projected costs of renewable energy programs underestimate actual costs. As has been pointed out, it only showed that one set of projected costs was higher than another. More to the point, it has now been shown that both the 2010 LTEP, and even more so, Fox and Gallant overestimated the increase in costs, at least over the first 3 years of the plan.
Finally, you, following Fox and Gallant, highlighted the discrepancy between the Geoge Smitherson's statement in parliament and the 2010 LTEP. Neither you nor they, however, have shown whether Smitherson's statement referred to real value, nominal value or oportunity cost. Of the three, the later is the far more likely, and as it would be absurd to promise the LTEP would keep energy rises below the inflation rate, nominal value is extremely unlikely. Yet despite this, you (and they) have been quite happy to compare projected nominal increases to that statement as though they refuted it. For the record, the 2010 projected real increases work out at 2.3% per annum over the 20 years to 2030, not 3.5% quoted by Fox and Gallant. And opportunity cost would have been way below that.
* not carbon free because they will still use gas power plants.
- The epidemic of climate science false balance in the media
MA Rodger at 01:11 AM on 1 March, 2014Chris Snow @11.
Back in October the BBC Radio 4 Today programme reported that the BBC could not find a British climate scientist that was not signed up to the IPCC's findings. That morning there were 6 items on the IPCC AR5 SPM release. The only skeptical voice was that of Lawson but from the archive and presented as an exemplar of wrongheadedness. It made for refreshing listening.
However, by luchtime the numpties had managed to get Bob Carter onto The World At One, resulting in an attrocious piece of news reporting by the BBC (transcript here - Peter Stott was not even allowed to hear what Carter had said, due to 'technical problems' apparently). Of course, in 'finding' Carter the BBC had not found a British climatologist. Carter is Australian and a geolologist. But he does have a UK connection - as one of Lawson's Gentlemen Who Prefer Fantasy, by dint of the GWPF being a charity, he is thus able to spread his untruths at the UK taxpayer's expense.
- Unprecedented trade wind strength is shifting global warming to the oceans, but for how much longer?
HK at 06:02 AM on 14 February, 2014Klapper #61:
Sea level rise from thermal expansion is not an accurate proxy for ocean heat uptake without a more careful analysis.
Take a look at this graph in Wikipedia. (the water’s density for each degree from 0°C to 100°C is listed further down the page) If you convert density change to expansion you get this for some temperatures:4-5°C: +0.001%
6-7°C: +0.004%
10-11°C: +0.01%
15-16°C: +0.016%
20-21°C: +0.021%
Heating water from 10 to 11°C makes it expand ten times more than if you heat it from 4 to 5°C! So the amount of thermal expansion doesn’t only depend on how much heat is being added, but where it is added, since warm water expands more than cold. These numbers are for fresh water. Salt water continues to contract down to its freezing point, but the principle is the same.
And where has the ocean heating taken place?
If you study this and this and this graph thoroughly, you will find that a rising fraction of the heat is accumulated in the deeper and colder parts of the oceans.
With a caveat for quite uncertain pre Argo data I got this result for the fraction of the heating taking place deeper than 700 meters:1957-1994: 25%
1994-2011: 38%
2005-2013: 49%
The tendency is quite clear: More of the heat accumulation happens in the deeper, colder parts of the oceans where each unit of energy cause less thermal expansion than in the warmer, upper layers.
And finally, this graph shows that the warming in the upper 100 meters have been almost zero for the last ten years. Each unit of energy added here would produce at least 10-20 times more expansion than in the deep and cold parts of the oceans!
Conclusions:
1. You can’t translate thermal expansion to heat accumulation without knowing where the heating takes place.
2. Much of the SLR from increased melting of ice sheets in the 2000’s has been offset by decreased thermal expansion because more of the warming happens in colder water. That probably explains the apparent lack of acceleration seen here.
- Discussing global warming: why does this have to be so hard?
Composer99 at 05:15 AM on 13 February, 2014Russ R:
In my view, Dr Abraham is overstating the uncertainties regarding global warming - or rather, that he has not clarified enough the distinction between the uncertainty regarding ultimate outcomes and uncertainty regarding timeframes and severity.
For example, analysis of paleoclimate data suggests that, if CO2e were to stop dead at 400 ppm, we would still be in for substantial sea level rise due to the melting of the large ice sheets in Greenland and Antarctica (e.g. see here for an estimate of sea level, relative to the present, in the last interglacial period). If that emissions continue unabated, we can be extremely confident that given time, all the ice would melt away eventually.
The ultimate outcome of unabated greenhouse gas emissions - massive sea level rise following the melt-off of the continental ice sheets - follows of necessity from the assumption of unabated emissions and what is presently known regarding cryosphere response to global warming. There is, effectively, no uncertainty regarding the ultimate outcome: if we warm the planet enough we could end the current ice-house state of the Earth and return it to an ice-free, hot-house state. This would entail a sea level rise of some tens of metres.
What is uncertain is how long it will take to get there. A higher climate sensitivity and more sensitive ice sheet response, for example, would suggest such sea level rise would occur very rapidly, in geological terms at least, and vice-versa for lower sensitivity and less sensitive response.
As the ultimate outcome of unabated warming with respect to sea level rise is not in doubt, we must sooner or later look to decarbonisation and, if technology permits, carbon sequestration in order to avoid it (on the assumption that multi-metre sea level rise is undesirable).
I could go on about other consequences of global warming - impacts on (agricultural) plant growth and distribution, heat stress on mammals, and so on. The ultimate consequences of unabated warming are, in my view, very cut and dried; the uncertainty lies in how quickly they will arrive (and/or how they will be distributed spatially, in the case of, say, changing weather patterns).
What is more, the ultimate outcomes of warming are not avoidable just by virtue of climate sensitivity being, say, on the low end of IPCC estimates. All that means it that it takes longer to get there, assuming unabated warming.
TL,DR: Assuming we want to avoid the ultimate outcomes of global warming, we have to abate it. And, as many people have pointed out in many articles and comment threads here and elsewhere, while there may be reasonable points of disagreement on how quickly and extensively to ramp up decarbonisation and sequestration, uncertainty is not our friend.
----------
As some final notes, with respect to the Globe & Mail article, I find the following paragraph very telling:
It is also the latest sign of turbulence in the green-energy industry after the global recession reduced the need for power and an uncertain economy made less costly conventional electricity more attractive than pricey renewables.
Leaving aside the fact that in Ontario about half of power generation is from nuclear power, the remaining proportion of "conventional" (that is, fossil fuel) electricity is only "less costly" than renewables because of (a) enormous direct and indirect subsidies paid out by various levels of government (in effect, we citizens pay fossil fuel power generators for the privilege of having lower numbers on our bills and at the fuel pumps), and (b) the rather large externalized costs of fossil fuel combustion (namely, global warming and its attendant consequences), which are not currently well-reflected in the prices we pay for, say, electricity from fossil fuels. (This latter point is the basis for arguing for carbon taxes, fee-and-dividend systems, and the like.) Their lower apparent cost compared to renewables is, in effect, an illusion.
Further, the Globe & Mail article suggests that the growth of renewable energy in Ontario is not falling victim to some perverse consequence of pursuing renewable energy per se, but rather to such things as retrenchment during economic stagnation and what I assume would be a normal driving down of prices due to over-supply ("After a decade of rapid expansion, during which Ontario badly wanted to increase the power supply as it shut down coal plants to cut greenhouse-gas emissions, the recession drove down demand and the province wound up with an electricity surplus"), austerity measures and/or perception-management by the government ("The still-shaky Ontario economy has also made it politically harder to justify the cost of subsidizing green power both to cash-strapped households and industrial enterprises for whom power is a major business expense"), and competition ("The rise of low-cost solar panel manufacturers in China has put further pressure on Western-based companies").
- Why rainbows and oil slicks help to show the greenhouse effect
joeygoze at 07:56 AM on 6 February, 2014The statements of the 3 non-scientists are as relevant as Sarah Palin or Jame Inhofe statements raised by Composer99. For a scientific discussion, those individuals are not relevant at all. Saying all those public figures do not represent mainstream scientific discussion.
As far as the accusation of "tone trolling" or "poisoning the well", no comment. That is an accusation against me, not my argument. Just to be clear, I agree with 99% in the above article, the sciecne of a greenhouse effect that warms the planet is clear basic physics. The assertion that a majority of people that question man's contribution to the greenhouse effect also do not believe in a greenhouse effect at ALL is what I was talking about. That is not a "mainstream" scientific position. Along the same lines, I do not accept everything Al Gore says as the mainstream position of the majority of climate scientists. i.e, I do not believe that Al Gore's statements reflected a mainstream position of climate scientists that the arctic would be ice free in the summer of 2013.
- Why rainbows and oil slicks help to show the greenhouse effect
joeygoze at 04:41 AM on 6 February, 2014Moderator:
Paul Beckwith - http://www.sierraclub.ca/en/AdultDiscussionPlease
John Kerry - ""It is already upon us and its effects are being felt worldwide, right now," he wrote. "Scientists project that the Arctic will be ice-free in the summer of 2013. Not in 2050, but four years from now. Make no mistake: catastrophic climate change represents a threat to human security, global stability, and — yes — even to American national security." http://www.politifact.com/truth-o-meter/statements/2009/sep/02/john-kerry/kerry-claims-arctic-will-be-ice-free-2013/
Al Gore - "Last September 21 (2007), as the Northern Hemisphere tilted away from the sun, scientists reported with unprecedented distress that the North Polar ice cap is "falling off a cliff." One study estimated that it could be completely gone during summer in less than 22 years. Another new study, to be presented by U.S. Navy researchers later this week, warns it could happen in as little as 7 years."
So correction on the Al Gore assertion, if it happened in as little as 7 years, would be the 2014 minimum would be ice free, not 2013
- Why rainbows and oil slicks help to show the greenhouse effect
chriskoz at 07:43 AM on 5 February, 2014joeygoze@15,
It needs to be clarified, that "forecasts made in 2007, 2008 and 2009 predicting an ice free arctic in 2013" were not any forcasts but simple & primitive distortion of scientific literature by deniers.
Wieslaw Maslowski predicted back in 2007 (before we saw the Sept 2007 minimum) "nearly ice free arctic" in 2016+/-3years, if the trend (as pointed by ubrew12@14) continues.
Deniers took Maslowski sentence, removed the "if the trend continues" clause, removed uncertainty, instead picking up the lower bound of uncertainty value (2013) and estaqblished it as the abosolutely certain, central value, thus creating the bogus, moronic slogan you're refering to.
So this "argument" by deniers is so silly that no scientist (inc maslowski) bothers to even listen, but we must debunk such arguments over and over because simple slogans "stick hard" to many minds. And unfortunately, many of those affected minds are supposed to take responsibility to reverse AGW (e.g. US Congress) but stick their heads in the sand.
There is an important need to debunk such slogans with basic science, and this article does good job with several of them related to IR.
- Why rainbows and oil slicks help to show the greenhouse effect
ubrew12 at 05:57 AM on 5 February, 2014joeygoze @12 said: "[Disbelieving the greenhouse effect] Goes in the same bucket as fringe arguments such as forecasts of the arctic being ice free in 2013" You can't seriously believe these are in the same bucket! The former is a refutation of basic Physics now two hundred years old. The latter is a forecast consistent with the last 30 year trend. There's a one minute stretch of this video that starts at 0:50, which shows the month by month trend in Arctic ice since the 1980s. Tell me you can look at that trend and NOT expect an ice free Arctic summer in the next decade or so!
https://www.youtube.com/watch?v=ZYaubXBfVqo
- Australia’s hottest year was no freak event: humans caused it
Tom Curtis at 10:00 AM on 28 January, 2014Barry @41, a Watt equals one Joule per Second. The units for the solar exposure are in Megajoules per day per meter squared. Therefore multiplying by one million then dividing by 86,400 (24 x 60 x 60) converts to Watts per meter squared. I originally thought the units were Megajoules per annum per meter squared, and further divided by 365. Correcting for that error, the maximum possible forcing from solar exposure is then 21.8 W/m^2. That is the figure before correction for albedo, and for loss of greenhouse forcing due to reduced cloud cover and water vapour content in the atmosphere. It is, however, sufficiently large that I cannot argue for a small relative effect without quantifying those values as I did in my prior post.
Here is an albedo map for Australia:

The data is from Modis, and full global maps are available here.
It is hard to derive an exact value, but as yellow, which predominates, represents an albedo just greater than 0.3, and as orange to red areas (3.5-4) are more extensive than green areas (0.2-2.5), I think an average albedo of 0.3 for Australia is a conservative estimate. That reduces the transient forcing from the high solar exposure (low cloud cover) over Australia in 2013 to approximately 0.7 x 22, or to 15.4.
Further, the high solar exposure is due to low cloud cover, which reduces the greenhouse forcing due to clouds over Australia during that period. The solar exposure was 9.6% greater than normal. As the increased solar exposure was due to low cloud cover, that represents approximately a 9.6% reduction in cloud cover. Globally, single factor removal of clouds removes 14% of the total greenhouse effect, or 21.7 W/m^2. Therefore removal of 9.6% of clouds would remove 2.1 W/m^2 of the greenhouse effect. A similar reduction in WV content would remove just over twice that amount, but that does not allow for the overlap between WV and clouds. Single factor removal of Water Vapour and clouds at the same time removes 103.7 W/m^2 of forcing. Removing just 9.6% of that removes 10 W/m^2.
Combined, these two effects will bring the net transient forcing from increased solar exposure in 2013 to about 5 W/m^2. Clearly the error margins on this calculation are large. Without exact information on cloud content, water vapour, temperatures and access to a climate model, I do not think I can significantly lower them.
The final factor that comes into play is the lag in increase in temperature. It takes around 60 years for 66% of the final temperature response to a forcing to come into effect, and over 200 years for the full effect to be felt. Consequently a transient forcing over one year will not have the same temperature effect as a long term forcing that has been in existence for much of a century. The initial rise is rapid, however, especially over land. Therefore, while we would expect a transient forcing of 5 W/m^2 to not have had the same temperature response as a long term forcing of 5 W/m^2, it may have had the same, or greater response 2.3 W/m^2 (ie, the effective radiative forcing from anthropogenic activity).
The consequence of this is frustrating. Bruiser will not be convinced, and nor should he be convinced, by this that he is wrong in attributing most of the increased temperature to the high solar exposure. The error margins are too large. Neither should he be convinced from this that he is correct, for the same reason. I have tried to be conservative in my calculation, and to the extent that I have succeeded, that means it is more likely that the errors will have favoured his case rather than undermined it, and therefore, that an error free calculation would show his case to be wanting. Therefore I do not believe we can use direct calculation of the transient forcing to further the discussion (contrary to what I attempted).
This does not mean Bruiser should not be persuaded by the first part of my discussion (and by your comments). The fact is that the difference in temperature between years in the late twentieth and early twenty first century is much smaller than the difference in temperature between those years and years in the early twentieth century. That is not explicable in terms of solar exposure. It follows that while solar exposure is (very convincingly) the primary reason why 2013 was hot relative to 1990-2013, it is not the reason why 1990-2013 was hot relative to 1910-1939. Nevertheless, I would now like to analyze Australia's solar exposure data to determine if it has a trend; and what the relationship is between solar exposure and temperatures over recent years to strengthen (or refute) that case.
- 2014 SkS Weekly News Roundup #2
Tom Curtis at 08:59 AM on 15 January, 2014Poster @7, Tom Switzer's article begins with the claim that the Australasian Antarctic ("Spirit of Mawson") Expedition (AAE) "... was promoted as the voyage to study the melting of ice sheets in the South Pole". That is, at best a 1/10th truth, and a massive misdirection. The Antarctic Ice Sheet is indeed melting, but the AAE did not go to Antarctica to study that melt, and nor was the Akademik Shokalskiy trapped by a sudden freeze of the Antarctic Ice Sheet.
The actual scientific reasons for the expedition are explained at the AAE website, an explanation mentions ice sheet melt just twice; and which details the specific scientific reasons for going to Antarctica:
"We are going south to:
- gain new insights into the circulation of the Southern Ocean and its impact on the global carbon cycle
- explore changes in ocean circulation caused by the growth of extensive fast ice and its impact on life in Commonwealth Bay
- use the subantarctic islands as thermometers of climatic change by using trees, peats and lakes to explore the past
- investigate the impact of changing climate on the ecology of the subantarctic islands
- discover the environmental influence on seabird populations across the Southern Ocean and in Commonwealth Bay
- understand changes in seal populations and their feeding patterns in the Southern Ocean and Commonwealth Bay
- produce the first underwater surveys of life in the subantarctic islands and Commonwealth Bay
- determine the extent to which human activity and pollution has directly impacted on this remote region of Antarctica
- provide baseline data to improve the next generation of atmospheric, oceanic and ice sheet models to improve predictions for the future"
(My emphasis)
The most interesting item (in this context) is (2). The Akademik Shokalskiy was trapped by windblown fast ice (ie, sea ice) and the AAE went to Antarctica to study (among other things) "...the growth of extensive fast ice...". Unfortunately for deniers, a tail about scientists going to Antarcitica to study growth of extensive fast ice and then being trapped by that extensive fast ice due to a short term wind change doesn't have the right level or irony. Consequently they simply made up reasons for the expedition not significantly related to the objectives of the expedition, and imply the ship was trapped by a sudden freeze (it was not), and in Switzer's case, imply it was trapped by a sudden extension of the ice sheet itself. That is, because the truth does not suit their propaganda needs, they deal in fantasies.
Almost the entire rest of the article discusses political facts. That is worth noting. Switzer's evidence against global warming consists almost entirely of evidence that people are ignoring the harm from global warming. Even his narrow purported case that he is not denying the warming but only the harm from the warming is not helped by that. Indeed, it is made worse in that he cites no studies or evidence of the likely impacts of global warming at all. Apparently in Switzer's opinion, global warming is likely to be harmless because all of the right people do not believe it to be harmfull, regardless of scientific evidence to the contrary.
I distinguish between his purported case and his actual case because his sole "scientific argument" is "Meanwhile, 2013 marked the 15th year of flat-lined global surface temperatures, despite record levels of carbon dioxide being pumped into the atmosphere since 1998." Flat lined? In fact the 15 year trend to the end of 2013 is 0.093 +/- 0.14 per C/decade, greater than the 0.084 +/-0.009 C/decade trend since January 1901. Further, adding that fifteen years increases the trend, ie, the trend from Jan 1901 to Dec 2013 is greater than the 0.071+/- 0.01 C/decade trend from Jan 1901-Dec 1998. Even with his obvious cherry pick, saying the temperature trends "flat-lined" is another case of spreading fantasies because the facts are not suitable to the propaganda purposes of the author.
The article is a disgrace to journalism. It shows in full that theory of journalism that anything labeled as "opinion" is publishable, if it comes from the right people, even if it is fact free, or completely counter factual. It represents, further, an example of that political theory that holds democracy in such high regard they think the way to advance their political cause is to con the people. To pervert Lincoln's famous dictum to say that "You can't fool all of the people all of the time, but you can fool enough of them enough of the time to suite your ends."
Given the debasement of journalistic and democratic ethics evident in Switzer's article, it is no surprise that his background is with the American Enterprise Institute; as opinion editor of The Australian, as an advisor to former Liberal Party leader, Brendan Nelson, and as an unsuccessful candidate for preselection for the Liberal Party.
- Broad consensus on climate change across American states
PhilMorris at 03:28 AM on 20 November, 2013kanspaugh @3. While not denying the power of lobbying groups, the analogy between the NRA and fossil fuel industry doesn't play well. The former claim second amendment rights in support of the right to bear arms, and short of being in the firing line, Joe Public isn't affected by the NRA's love of weapons. Not so with climate change; Joe Public most certainly will be affected. And while a good majority of them may believe that climate change is real, I suspect very few really have any idea of the catastrophe that awaits, if not them, then their children and grandchildren.
With at least one notable exception, climate scientists have been very conservative in aggressively telling the public about what the future may – no, WILL – bring without adequate reductions in CO2 emissions. I suspect most of the public think in terms of perhaps a few more storms in the mid-west, maybe some water shortages in the south west, and maybe some more events like Sandy (but the insurance companies will pay, won’t they?). Do they really know the likelihood of extended drought in the mid-west and south west, decimating livestock production, and making the south west uninhabitable due to lack of fresh water (‘A 12000 year perspective of 21st century drought in southwestern North America’, Woodhouse et. al, PNAS 2009)? Do they understand that there is nothing they can do to save east coast cities from rising sea levels (‘Rapid accumulation for committed sea level rise from global warming’, Strauss, PNAS, 2013)? Do they understand that rising summer temperatures will result in significant decline in production of corn, soybeans and cotton (‘Nonlinear temperature effects indicate severe damages to US crop yields under climate change’, Schlenker and Roberts, PNAS, 2009)? I suspect not.
Some people may take solace in knowing that timescales may be measured in centuries, but with the Arctic melt trend lines suggesting an ice free summer by 2016/2017 weather patterns will continue to change for the worse in much shorter timescales. And catastrophic collapse of the WAIS – likely to occur once the Ross ice shelf disintegrates - would cause significant sea level rise occur in decades.
- Oceans heating up faster now than in the past 10,000 years, says new study
chriskoz at 00:44 AM on 7 November, 2013CBDunkerson & Dave123,
I concur. We cannot make a conclusion about the total OHC based on a study from a single ocean temp proxy, even if that proxy suggests the local water temperature fell by as much as 2degrees during Holocene. Local variability of water T may seem to be higher than global average but it shoul not be indicative of global conditions. Therefore, I would not suggest the "disconnect between ocean cooling pre-1950 and rising sea levels over the same period" as barry@1 did. Besides, SLR does not depend on water temp only - a study about SLR should take into account other factors, like melting/re-freezing of icesheets, postglacial isostatic rebound.
However the conclusion than present rate of T change is unprecedented can be concluded from one proxy as in this study; moreover the current rate (about 0.18degree per century) is global. So, this globaly averaged, therefore less varying change is higher than the change recorded at the subject proxy (2degree/10ka = 0.02/century).
Not only MWP has been denounced in recent research as misnomer (because the warming was likely not universal, therfore MCA would be better name), the same applies to LIA. For example, Mike Lockwood concluded that LIA, commonly thought to be caused by Maunder Minimum, was likely a local Arctic dipole phenomenon. Mike describes his study of LIA in this blog post, written in response to silly misinterpreting spinoffs.
So, there is growing evidence, that AGW in last century is unique to Holocene. Its uniqueness evidenced by unprecedented rate of change in all climate indicators. When we look at the rate of change, AGW stands out easily. Comparing the absolute values of said indicators (i.e. arguing if MWP was warmer) does make lesser sense because AWG will not stad out beyond the uncertainties.
- Temp record is unreliable
Tom Curtis at 13:57 PM on 26 October, 2013Stranger @23, I assume you are referring to this research, a popular account of which is given here. The same research is detailed more briefly in the link provided by Doug Bostrom.
Given that, all that is required for moss to not accumulate new C14 from the atmosphere is that it be either dead, or unexposed to the atmosphere (ie, covered in ice). There is a slight twist to that. Specifically, if new and living moss grows in the same location as old and dead moss, it will potentially contaminate the age signal, making the older moss appear younger. If you look at this image from the popular report, you will see areas in which new plants is growing by the green colour:

In fact, looking closely, it appears that the new plants are grass rather than moss. That is important for two reasons. First, it makes it easier to distinguish between the old moss and the new growth, thereby avoiding cross contamination. Second, It is my understanding that moss will grow in situations too cold for grass to grow, suggesting a possibility that Baffin Island is now warmer than when the moss was formerly growing, not just when it was ice covered. Of course, that later point depends critically on the species of moss involved, and as the original research is behind a pay wall, I cannot confirm it.
Despite the fact that C14 doesn't distinguish between a merely dead plant, and one covered by ice, the conclusion AGW "skeptics" apparently want to draw from that does not follow. That is because if a soil is not ice covered, and is above freezing for at least part of the year, new plants will grow in it. Those new plants will then show up as having a relatively young age in carbon dating. Thus, for the "skeptic" scenario to make sense, the ice would have had to melt away without temperatures ever rising above freezing. Quite apart from the conundrum in that, temperatures in the area are definitely above freezing for at least part of the year now so even in that scenario, temperatures are still warmer than they have been, likely in the last 110,000 years.
I should note that I am not expert in arctic biota, so there may be some contrived way in which temeratures were briefly warmer in the interval and not shown up based on biology alone. However, the only time since the end of the last ice age in which temperatures may have been warmer is shown by the younger C14 ages across much of the transect to have also been a period when the icecap was growing. (Those younger ages also illustrate my point in the preceding paragraph.)
- Arctic sea ice "recovers" to its 6th-lowest extent in millennia
chriskoz at 21:17 PM on 19 September, 2013When Lord Monckton was preaching here in AU, his Arctic Ice "recovery" of 2008-2009, he was cherry-picking the two-year "trend" as the basis for his teachings. Note, that he was teaching his rubbish confidently in the middle of 2011, when data of 2010 melt season was available, contradicting him. Apparently he could afford that, likely vause his prefered audience did not know the facts.
Today, David Rose, incidentally Monckton's compatriot, is not waiting for 2 year of "recoveries", but jumping at a single 2013 straight on. He's beaten his lord on that. Likely reason: "report it until hot, don't wait the news to be spoiled by the uncertain future!". Amazing, what an extraordinary race of ignorance. Honestly, I thought Monckton would not be beaten on that subject. But he's just been!
Meanwhile, I think Wieslaw Maslowski's prediction of ice free Arctic (2016 +/- 3y)* is still on track, given the PIOMAS volume models This year Sept volume was marginaly higher than last year, with pretty much the same thinkness. So, the ice in as vulnerable as it's been, no real recovery. That's what you conclude when you look at the data rather than "Rosy" race of ignorance.
* "Rosy" media reported it as if Maslowski's said "ice free Arctic in 2013" reporting only the lower uncertainty range, in an effort to portray him as "alarmist".
- Latest myth from the Mail on Sunday on Arctic ice
Jim Hunt at 18:02 PM on 18 September, 2013Please forgive me for continuing to flog this particular dead horse, but an interview with Wieslaw Maslowski from December 2007 which reveals the sort of things he was actually saying at that time can be heard here:
http://greatwhitecon.info/2013/09/shock-news-why-isnt-the-arctic-ice-free/
Needless to say Prof. Maslowski's views were not accurately reported by David Rose in the Mail on Sunday. Hence we are attempting to persuade the Mail to recant this and the many other inaccuracies they have recently put into physical and virtual print with the aid of the UK's Press Complaints Commission. How far we'll get remains to be seen, but please feel free to inform any of your friends and acquaintances who might be interested in following the developing story. - President Obama acts on climate change by enforcing the law
JasonB at 17:42 PM on 27 June, 2013Donthaveone,
@23 and 24, my question was do they have the power to regulate H2O as a pollutant
No, because it doesn't meet the legal definition of pollutant that CO2 does because of the explanation already given above.
if you raise the cost of coal fired electricity via a CO2 tax ofr the purpose of encouraging an alternative then surely nuclear would be the best option.
Nuclear gets to compete in the market place just like all the alternatives. A carbon tax neither favours renewables relative to nuclear nor hurts them relative to nuclear because nuclear is also low-carbon — raising the cost of carbon helps nuclear exactly as much as it helps the renewables, and if you like nuclear then this is a good example of the benefits of using a market-based scheme (like a carbon tax or ETS) rather than a "direct action" scheme like Tony Abbott wants.
a way to raise the cost of nuclear would be to claim H2O in its gaseous state is a pollutant as well thusly driving the electricity sector towards an alternative of their liking.
CO2 is being claimed to be a pollutant because of the impact it is having on the environment. The 2007 Supreme Court case linked to in the main article showed that CO2 legally met the definition of pollutant given in the Clean Air Act and therefore the EPA were required by law to regulate CO2 emissions. Remember, at the time, the Bush administration was in charge and the EPA had to be dragged kicking and screaming to get it to do its job.
The only way for the EPA not to regulate CO2 emissions now would be for Congress to pass a special law claiming that CO2 was not a pollutant despite legally meeting the criteria or by removing the need for the EPA to act by imposing their own regulations (like an ETS or carbon tax).
Your suggestion doesn't make any sense anyway — even if H2O was classified as a pollutant, why would that hurt nuclear relative to e.g. solar thermal? Both can be made low water users at additional cost.
However how could you reduce the gas plants? CCS is not feasible both in cost and technology so i suggest you will lose them aswell
A combined-cycle gas plant has an emissions intensity of 800 lbs CO2/MWh so it would have no problem meeting the standard.
To JasonB @23 and Rob Honeycutt @27 regarding CO2 tax has no effect on manufacture sorry but i must disagree. The tax adds to the cost of manufacture so if you are competing with an overseas manufacturer then you become less competitive and in the current environment this is the last thing you need obviously.
I didn't say "no effect", I said "negligible effect" compared to the massive effect that the exchange rate has had on profitability. Something can indeed be non-zero but still be lost in the noise and make no difference to the outcome. If you think the carbon tax has had a material effect on competitiveness since it was introduced then please by all means produce that information and show that it is a direct result from the carbon tax.
The tax that is applied to the coal miners
Note that coal miners don't have to pay tax on the coal that they mine — the consumers of that coal, the ones that actually burn it, have to pay the tax. The coal miners only have to pay tax for fugitive emissions that they release during the mining process, which gives coal mines with less emissions a competitive advantage, as it should.
for the most part this cost is passed onto the consumer
Exactly. That's what the bonus payments and tax cuts were to compensate consumers for, and now that the figures are in it's clear that most consumers have been over compensated, which is why it's put a hole in the budget!
the amount of co2 produced will remain the same as there is no viable alternative
That's clearly false, as evidenced by the reduction in Australia's CO2 emissions and the increase in renewables.
You may be surprised to find that studies have shown (both here and in Germany) that the increase in renewables has actually led to cost reductions because the renewables have zero production cost, and so they're dumped onto the grid at whatever price is going, undercutting the peaking power generators that have the highest production costs (which is why they're only used for peaking power) leading to lower wholesale prices on average.
If you think the co2 emissions have reduced since the tax has been introduced then please by all means produce that information and show that it is a direct result from the CO2 tax. From my understanding all the major coal fired power stations are still running flat chat, still producing the same amount of electricity ergo CO2.
How was that understanding informed?
April: Emissions from power sector drop to a 10-year low while the share of renewable energy in the National Electricity Market (NEM) has soared beyond 12 per cent and looks set to continue rising (SMH)
June: In the eleven months since Australia's carbon price began, emissions from Australia's National Electricity Market were down 7.4%, emmissions intensity was down 5.1%, brown coal electricity was down 13.3%, and black coal electricity was down 4.2%. The 11 TWh reduction in coal-fired electricity generation was made up for by a 5 TWh increase in renewables, a 1 TWh increase in gas and liquids, and a 5 TWh reduction in consumption. (Link)
Now this is a tax it is no different to any other tax so my question is how can applying a tax create a better environment for manufacturers?
It is actually different because it is an ETS that just happens to have a preset price on carbon permits at introduction to allow businesses to plan better.
But its purpose is not to "create a better environment for manufacturers", it's to "create a better environment", fullstop. To the extent that benefits manufacturers, then they benefit. You know, because the economic impacts of the climate effects of BAU have been avoided, for example. Manufacturers who rely on externalising the true costs of their manufacturing will obviously suffer when those costs are internalised if they do not react accordingly.
At the moment we here in Oz are paying the largest co2 tax in the world and our major trading partners do not
And yet you haven't produced any evidence that it's having a meaningful impact on the bottom line, and in a few years the point will be moot as we'll be in the largest ETS market in the world, paying the same price.
Even if the world does act as one at some point in time how is raising the cost of cheap reliable electricity going to have any affect apart from raising the cost of that cheap reliable electricity.
Basic economics. If you make something bad more expensive relative to alternatives, less of the bad thing will be consumed.
I think you also need to recognise that not incorporating the true cost of emitting carbon into the price of fossil fuels is actually distorting the free market and preventing it from allocating resources efficiently. If the consumers of coal, for example, are not required to pay the true cost of burning that coal, and instead that cost is bourne by everybody and not just those consumers, then they are going to consume a lot more than they otherwise would have, and other technologies that do not have those costs aren't able to compete fairly in the market.
As for the world acting "at some point", the EU was way ahead of us, and by the end of this year a billion people will be living with some kind of carbon pricing mechanism. We're not exactly trailblazers.
This is just another tax applied by governments to increase revenue nothing more nothing less.
And yet it is revenue negative thus far, and you yourself claim that it's going to blow a gaping hole in the forward estimates!
Maybe, just maybe, the purpose is to actually reduce carbon emissions instead?
- Media Overlooking 90% of Global Warming
Donthaveone at 11:12 AM on 26 June, 2013Esop in 14,
You raise some interesting points re Arctic ice however you need to be careful with what you say. For example Professor Wieslaw Maslowski made a rather bold prediction when he stated according to his model the Arctic will be ice free by the summer of 2013 (see link below)
http://news.bbc.co.uk/2/hi/7139797.stm
Now if we look at the current state of Arctic sea ice we can see it is a long way from being ice free, granted we are a few months away from "peak melt" but the Arctic will not be ice free (see link below)
http://www.ijis.iarc.uaf.edu/en/home/seaice_extent.htm
Obviously Professor Wieslaw Maslowski got his prediction/projection wrong i will be interested in hearing what his reasonings are.
- 2013 SkS Weekly News Roundup #25A
grindupBaker at 02:17 AM on 21 June, 2013"Antarctic melting from underneath". Obviously. I presume it's useful for projection data if they can quantify it, to project the rate once it really gets going. Since ocean temp is 4.05 an increase to 5.55 to 7.05 for CO2x2 (depending on whether, say, 2.0-3.0 Celsius is final CO2x2 radiative balance restored after ocean equilibrium and whether oceans dissolve enough CO2 to slow it) should have an effect considering the huge proportional increase above the freeze/melt point of water (presumbly the -1.9C for sea water). Balmaseda, Trenberth, and Källén (2013) asserts 200+-40 ZettaJoules added to oceans since 1958. Since 11,000 to 17,000 ZettaJoules must be added to oceans before the oceans will permit the surface to restore its radiative balance of CO2x2 for my example +2.0-3.0 Celsius, it would be interesting to know how much ice melt for the trivial 200 ZettaJoules thus far.
"Global warming appears to have slowed lately" Plumer, Wonkblog, Washington Post states "the “missing heat” may be lurking in the deep layers, 700 meters below the surface" but SKS Posted on 25 March 2013 by dana1981states categorically "A new study of ocean warming has just been published in Geophysical Research Letters by Balmaseda, Trenberth, and Källén (2013)." and "...has been found in the deep oceans...". What is the certainty of this paper and if >90%, say, then why is Plumer, Wonkblog saying "may be lurking". The slope of B,T & K (2013) indicates 0.85 wm**-2 average 2000-2010. This seems crystal clear. I understand that the buoys' data of prior decades likely has suspect accuracy, but typically these random errors cancel well to near-zero if a large enough statistical sample is used and I see no reason why buoys' data of prior decades would affect the slope 2000-2010.
On the same topic when are you educated bods going to tell media suits and the public what "global warming" is so that this nonsense stops ? Typically for science, what the subject is would be outlined fairly early in a discussion of the science subject, not 20 years after "the science is settled".
- UK Secretary of State for the Environment reveals his depth of knowledge of climate change (not!)
DSL at 05:37 AM on 13 June, 2013HJones, I think misunderstand me. I'm saying that his claim that his claim is not exaggerated. It is quite relevant. However, he left it at that. He put a simple piece of evidence out there without providing any context for understanding, other than the general bent of his other comments. You erased his claim as exaggerated. Why? You provided no reasons for doing so, probably because you were thinking of his statements in terms of their rhetorical value. When read in the scientific context, Funder et al. 2013 is quite important, because it gives us further secondary evidence that we're warming the climate system with extreme rapidity. What Marcott et al. 2013 found makes sense alongside Funder et al., and the news ain't pretty.
Others have commented on your clinging to "individually correct" statements. As the main post points out, there are several of Patterson's claims that are so bizarre I have to question the man's training: "the climate has not changed - the temperature has not changed in the last seventeen years."
Eh? The climate has changed quite significantly. A poleward shift of the Hadley circulation by 5 degrees in two decades is not climate change? An 80% reduction in Arctic sea ice volume at summer minimum (-33% at winter max) in just 35 years is not climate change?
And if there's anything that gets my goat more than representing the system with the surface/lower troposphere, I don't know what it is. Phil Jones was careless with this point, and he hasn't heard the end of it. Now you're giving Patterson a free pass on it. No. Patterson deserves to be ripped for that claim. The system is warming as expected. The surface/lower troposphere (all of how much of the thermal capacity of the system?) has gone through a longish positive excursion (97-07 roughly) followed by a multi-year negative excursion. Would you say that .172C per decade over 40 years is significant? That's the trend up to present, including this alleged "hiatus."
NODC OHC during the alleged "hiatus". Positive trend? Yah. Significant? Yah. Last value? Ouch. It's all good. It'll drop down to 0 next year. Snort. - Imbers et al. Test Human-Caused Global Warming Detection
Tom Dayton at 11:41 AM on 5 June, 2013Stealth, to illustrate and augment the advice given you about modeling by other folks in this thread, I encourage you to read a brief history of modeling here at Skeptical Science, and for more the detailed history by Spencer Weart. Note that even in the 1820s, Fourier was using a model. Not a computerized model. Not a model as complex as the ones used today. Each improvement in the science involved an improvement in the models, but only relatively recently did they get "complicated" in modern terms. Even the earliest models were quite successful in predicting global temperature relative to other possible predictions such as "the Earth is frozen solid" and "the Earth is cooling drastically" and "the Earth is maintaining its temperature" and "the Earth will be as hot as the Sun in fifty years." Complication is needed only to fine tune the predictions by the desired amount.
You can try some simple models yourself by getting an introductory textbook such as David Archer's "Global Warming: Understanding the Forecast," or by taking notes while watching his free online lectures from his class at the University of Chicago.
Tamino has illustrated a simple climate model you can run without a computer if you have a lot of time, or with a spreadsheet if you don't mind using a computer. He also has a followup that's only a bit more complicated.
There are a bunch of other climate models that are simple enough for learning and teaching. One list has been compiled by Steve Easterbrook.
You also might be interested in Steve Easterbrook's comments on verification and validation (V&V) of climate models. Steve once did V&V for NASA.
- Skeptical Science Study Finds 97% Consensus on Human-Caused Global Warming in the Peer-Reviewed Literature
s_gordon_b at 06:42 AM on 28 May, 2013Hi JasonB,
You wrote in reply to my post:
Perhaps it would be easier to understand your point if you could point us to some examples of where the study is being spun?
Ironically, in light of the methodology of the paper, the spin (more neutrally, I should call it confusion or conflation) starts with my "rating" of where Cook et al.'s abstract stands on AGW (emphasis below is mine):
"We analyze the evolution of the scientific consensus on anthropogenic global warming (AGW) in the peer-reviewed scientific literature, examining 11 944 climate abstracts from 1991–2011 matching the topics 'global climate change' or 'global warming'. We find that 66.4% of abstracts expressed no position on AGW, 32.6% endorsed AGW..."AGW is immediately defined as "the scientific consensus on anthropogenic global warming," not in the broadbrushed, imprecise, popular way that ranges from "we're a significant contributor, along with natural causes" to "we're the cause." In the next breath, we're told that "32.6% endorsed" that consensus. Ask anyone who reads climate science papers what the term "scientific consensus on anthropogenic global warming" means in the context of such a paper, and how many will say "simple: humans are a significant cause of global warming" vs "it refers to the consensus of the IPCC and pretty much all of the other major scientific review bodies that humans are the dominant (if not the only) cause of global warming, at least since the 1950s"? In climate science circles "consensus" has a precise meaning. And this is a climate science paper. This is why when I initially read about the paper - and based on my very high level of trust in SkS - I took the claim about support for "the consensus" literally, in the IPCC sense, and represented the paper that way on social media. It's also why I was stunned when I actually read the paper and got to the part where categories 1, 2 and 3 were rolled up together and rated as "the consensus." Not so. Two and 3, by definition, lacked the scope to indicate one way or another whether they support the consensus. Basically, just as most of all of the abstracts that were rated lacked the scope to comment at all on causation; 2 and 3 lacked the scope to comment on the consensus quantification of causation.
You continued:
Regarding the authors, again, they were asked to state whether each specific paper endorsed the proposition that anthropogenic GHGs are causing global warming, rejected the proposition that anthropogenic GHGs are causing global warming, or was neutral. If the author of the paper felt that their paper implied humans were having a minimal impact on global warming (e.g. by proposing an alternative as the main cause of global warming), or stated that human impact was minimal or non-existent, or stated that humans were causing less then half of global warming, then they would have categorised their own papers as rejecting the proposition.
I'm fairly confident that anyone who rejected the consensus view would have made damn sure their paper was counted as a rejection if it was at all possible to do so! And let's not forget that the authors of any papers who feel their paper should have been counted as a rejection are free to search for their paper in the results and alert us to the miscategorisation.
You're misunderstanding my argument. I'm not in any way suggesting that minimizing or denying papers were lumped into the "endorsing"/consensus-supporting abstract count. For example, if I wrote a paper that (to quote from the choices the authors were given) "... explicitly states humans are causing global warming or refers to anthropogenic global warming/climate change as a given fact," I would concur if it was rated as category 2. Likewise, I would concur with a category 3 rating if my "paper implies humans are causing global warming. E.g., research assumes greenhouse gases cause warming without explicitly stating humans are the cause." But I would concur in both these cases even if my paper had zero to say for or against the IPCC consensus on degree of causation. Indeed, if my paper had supported the consensus, I would have rated it 1.
Anyway, the bottom line is that the authors of 97.2% of the papers that took a position stated that their papers endorsed the proposition that anthropogenic greenhouse gasses are causing global warming. That's it.
Exactly. They "endorsed the proposition that anthropogenic greenhouse gasses are causing global warming." "Are causing" can be read the same way as "obesity is causing Type 2 diabetes": it's a contribuitng cause. But, again, only a fraction of the papers were designed to endorse or reject the dominant cause IPCC consensus implied in the abstract and in all manner of coverage that has followed. E.g.:
From the lead in Suzanne Goldberg's story in The Guardian (http://www.guardian.co.uk/environment/2013/may/16/climate-research-nearly-unanimous-humans-causes):"A survey of thousands of peer-reviewed papers in scientific journals has found 97.1% agreed that climate change is caused by human activity."
When I write (as a journalist) or read "is caused by" in the context of the climate change social debate (it is a debate, in civil society; otherwise there would be no need for this paper and the Consensus Project), my meaning/understanding is primary causation, if not "the cause."
There's no shortage of argument on this board about the semantics used in the study and surrounding it. Cook et al. could simply address this by releasing a clarification, unless they really believe it's scentifically sound to infer that category 2 and 3 papers do endorse the consensus. Alternately, they could go through all their past writings and redefine their use of the word consensus to mean that human activities are at least a significant contributor to global warming.
Quoting and answering me:
*I've looked everywhere, but I can't find where the numbers of abstracts assigned to each of the original Table 2 categories is or the category assignments by the study authors. Could you point me to that data?
http://www.skepticalscience.com/tcp.php?t=search
I had already gone there. I still don't see how I can use that page to get those figures. Why isn't the data simply published somewhere? It's such basic information for people who want to understand the study's findings.
Perhaps you should spend some time reading the earlier comments to avoid rehashing the same points over and over again.
I read plenty and found little beyond arguments about semantics. But now you've provided me numbers for category 1 in your earlier post, where you write:
... of interest to this discussion is the breakdown between papers that quantify the human contribution to global warming as >= 50% and papers that quantify the human contribution to global warming as < 50% (i.e. levels 1 and 7), since there is no interpretation required for those. The former represent 88% of all papers that quantify the human contribution to global warming (64 of 73).
I think you've made a fundamental error here. For a paper to unambiguously support the IPCC et al. consensus, it does indeed have to fall into category 1. But for a paper to unambiguously reject or deny it, it only has to fall into category 5, 6 or 7. That's 0.7 of 11,944 papers = 84 (maybe a few more, judging by the responses to some to the queries Popular Technology sent to known anti-AGW scientists whose papers had been rated). So the proper comparison, it seems to me, is 64 vs 84 or 64 out of 148 explicitly, unambiguously endorsing vs rejecting the IPCC consensus.
For me, the lesson of this study is that it's very hard to find robust support for the IPCC consensus just by doing a head count of papers on climate change, because very few papers, so far at least, have explicitly (or implictly, I suppose) sought to test that quantified consensus. Maybe this is analogous to the relationship between any large body of literature and the relatively uncommon major reviews and meta-analyses that attempt to put it all together and draw those larger conclusions of which consensuses are made.
- The anthropogenic global warming rate: Is it steady for the last 100 years?
Dumb Scientist at 03:50 AM on 19 April, 2013Due to my inexperience, I have found it difficult to answer individual questions, mostly of them are technical in nature. I have tried to explain the technical details, but that did not seem to work. [KK Tung]
It didn't work because your technical details didn't address my point, as many have noted above. That's why I distilled my point into two yes/no questions. I look forward to the educational answers you've undoubtedly provided in your second post.
There is no obviously right or wrong answers; this is always the case when the science is unsettled---when the science is settled I will have to move to another field.
Science can be (loosely) defined as the search for answers which are less wrong than previous answers. That slogan is meaningless because all science has uncertainties.
One argues for the reasonableness of the assumption using evidence and physical mechanisms, and then proceeds to deduce what that assumption will lead to as consequences. In scientist publications, one always lists the assumption clearly so that others could refute it. We should argue whether the assumption is supported by the available evidence or not. But claiming that the argument is circular simply based on the technical fact that the consequence arose from the assumption is missing the bulk of the arguments in our paper leading to that assumption.
It's true that all science is based on assumptions, such as conservation of energy. But no study based on the assumption of energy conservation would conclude that energy is conserved. That would be a circular argument.
You regressed global surface temperatures against the AMO in order to determine anthropogenic warming. Because the AMO is simply linearly detrended N. Atlantic SST, this procedure would only be correct if AGW is linear. Otherwise you'd be subtracting AGW signal, sweeping some AGW into a box you've labelled "natural" called the AMO. So you're assuming that AGW is linear, and you're also concluding that AGW is linear.
I suspect a lot of that may have to do with the fact that our paper is behind a "pay wall", so that many posting here may not have read more than the abstract. I have posted a free link to the entire paper in the first few lines of my post. A correction: The link to our PNAS paper was deleted in this first post. I hope it survives in my second post, where it is provided again.
Actually, the first link in my article was a free link to the entire paper Tung and Zhou 2013.
Dr. Tung, I'd also like to thank you for your participation here. Right now I'm also trying to explain Antarctic ice mass balance at Jo Nova's, and the disappointing responses made me appreciate this civilized discussion even more.
- The Fool's Gold of Current Climate
Andy Skuce at 16:09 PM on 5 April, 2013There's a useful article here:
8 Tips From Scientists On Covering Polar Bears
It deals, among other things, with the myth that Polar Bears will just adapt to an ice-free Arctic, since ice is part of the ecosystem, like soil is in a forest and we would not expect trees to just adapt to a soil-free forest.
The climate conditions that Polar Bears will face by the end of this century with unmitigated warming will be unprecedented in the entire existence of the species over the last ~600,000 years since they split from brown bears. I hope I am wrong, but there seems every reason to doubt that they will be able to adapt to this very rapid change over just a few generations.
- 2013 SkS Weekly News Roundup #10
ajki at 06:54 AM on 10 March, 2013As reported by several newspapers and blogs there's a very nice visualisation (well, technically...) available on "The Future of Glaciers" as part of an exhibition "Mathematics of Planet Earth (2013)" [imaginary.org].
Another source is the webpage of one of the authors: Guillaume Jouvet, Free University of Berlin.
- 2013 Arctic Sea Ice Extent Prediction
cRR Kampen at 00:34 AM on 22 February, 2013[DM] "... new ice forms accross much of the Arctic during winter, and this is steadily pushed throughout the year towards the Canadian archipelago and northern Greenland throughout the year. Even when the Arctic is substantially ice free during the summer, this "stubborn ice" is likely to continue to be sufficiently replenished in the winter to last all summer, even when there is regular shipping across the Arctic."
This is simply not true: http://i1340.photobucket.com/albums/o728/OlTom67/cryosat_zpsf2aa8e10.gif (borrowed from a comment under http://neven1.typepad.com/blog/2013/02/cryosat-2-reveals-major-arctic-sea-ice-loss.html ).
Why would this trend reverse - especially as the albedo feedback kicks in ever more?
[DM] ]"This is simply incorrect, regression to the mean ocurrs in non-Gaussian situations as well..."
What 'mean'?
There are situations in which 'mean' is meaningless. Cf catastrophe theory, http://en.wikipedia.org/wiki/Catastrophe_theory .
Many examples are given in 'The Black Swan' by Nassim Taleb, http://en.wikipedia.org/wiki/Black_swan_theory .
What does 'mean' mean if you take the mean daily financial volume on Wall Street while knowing that over past half century only ten loose days account for half the total volume of the entire half century and realizing these are the days with true meaning?What is the mean melting rate of an icicle on the roof - when it includes its sudden moment of dropping off?
[DM] "Also, just looking at the data suggests regression to the mean is just what we should expect, extremes in the observations are generally followed by less extreme observations the next year. Every record low in the data set is followed by a higher extent in the following year. Why should 2012/3 be any different?"
Again, what 'mean'? To answer your question directly, the chance that 2013 will be different is considerable and actually increases every year - momentarily that is - because the drop of the 'mean' which is really a point value accelerates. Guassian reasoning fails here (and actually forces me to write gibberish like 'a mean being a point value').
Another reason to suspect relatively considerable chance of a new record in 2013 is simply the fact the total volume of ice in March 2013 will be smaller (again) than it was in March 2013. There is simply less ice to melt. And more heat te melt it, too.
[DM ]"Note that the minimum in 2012 came very close to being inconsistent with last years projection, being only just within the 95% credible interval, which suggests that last years minimum was a very extreme event judging by the long term trend."
No it was not, it was spot on considering the long term trend, which exhibits accelerating ice loss.
[DM] "Note "regression to the mean" doesn't mean that the minimum extent this year can't be lower than in 2012, just that "all things being equal" we would expect it not to be lower."
But not all things are being equal. This year the ocean-atmosphere system contains more heat than it did last year. This given, plus the fact total ice is less now than it was a year ago can only lead to the expectation next minimum will be lower. Only thing to save this is sheer luck e.g. a cool summer with benevolent stratus and winds.
Kind regards/cRR - Modelling the permafrost carbon feedback
ranyl at 08:50 AM on 4 October, 2012
Thanks Andy Interesting post pointing again to things having been underestimated by the models previously used to inform decision makers.
Looking at figure 1, DEP2.6 the range seems like a lower limit ~0.23C to an upper limit of 0.8C by 2100. That is an additional temperature rise for 39ppm extra CO2. 39ppm is only at most 1/10 of a doubling from 390ppm, so a CS in the model acting as 2.3C. Therefore must presume this a low end estimate, and as CS could just easily be 4.5C (especially considering the skewed distribution of CS), 0.45C is just as likely.
And even with complete cessation of CO2 emissions from fossil fuels in 2013 from figure 3, atmospheric CO2 remains the same just to due additional CO2 permafrost releases, so will be at least 390ppm all the way to 2100 even if that impossible extreme occured and that is despite there being strong CO2 sinks maintained in the model, when these do seem at considerable risk when the following are considered; peat drying, forest fires, mangroove degradation, aerobic methane release from the arctic, methane from permafrost world wide (as mentioned above), vegitative diseases (pests, fungus), hotter oceans, increasing weather extremes and mass biodiversity losses.
Not sure if SO2 emissions are ceased in the model but many studies have shown that this heating effect is very signifiance at least 0.4C by 2050 if SO2 emissions were stopped today.
Add in the heat in the system ~0.4-6C and 2C is an almost certainity even with a CS of 2.3C, and considering recent extreme events, 1.5C is a daunting proposition.
The Pliocene, the best past analogy of today, albeit with a slightly cooler sun, suggests 350ppm means a significant climate shift resulting in an Ice free Northern Hemishpere and a much warmer climate with lots more water available for the water cycle, due to the ability of air to hold 8% more water per extra 1C in average temperature (that is a lot of extra water).
Also there were wider tropics and a much warmer North Pole, therefore I pressume a meandering, blocking, severe extreme weather inducing jetstream situation and over time 20-25m sea level rise, how quick this will occur is debateable however 2m by 2100 does not look out of the question, and that this a lot of extra shallow tropical seas for storms to brew over.
Therefore does any on here feel, that 1 trillion tonnes of CO2 emissions, or bascially adding 80% again of what we already have, is safe? - Record Arctic Sea Ice Melt to Levels Unseen in Millennia
DSL at 03:49 AM on 8 September, 2012
Jack, looking critically at Arctic maximum requires one first and foremost to take into account land constraints. Max area is constrained by land. If there were no land in the northern hemisphere, the winter max area trend would be much more useful than it actually is. It is a downward trend, but not quite as severe as summer minimum trend, and the trend starts to increase later in the winter series compared to the summer.
The area that melts each melt season is also increasing. If minimum were today, 11.35 million km2 would have melted, an instrumental period record. Not surprising, though, since the ice is thinning. While 2012 started out anomalously high in area (against the trend), the drop was staggering in intensity when it came. There were 22 60-day periods where the average daily loss was over 100k km2. There was one such period in the entire instrumental record before this year. Will October be an equally sharp beginning to the race to the maximum? Or will the warmth linger and force the growth spurt to begin in earnest later?
Volume trend is down on every day of the year when using the full record as a basis. I get something like 2070 for winter max ice free when I extrapolate a ten year linear to zero intercept. That's unlikely, of course. Funny thing is, I can't tell you why. I suspect that decrease will slow as area max gets closer to the 80 degree line, but if ice is still mobile, then there's no reason to think it might not be susceptible to flushing and mixing.
This year's anomaly was, for my money, greatly enhanced by high-temp river drainage. That drainage was high temp thanks to the heat concentrated over parts of Siberia and North America (and the snow cover anomaly). And that, of course, can be tied to polar amplification related changes to the big circulation cells. 2013 is a crucial year. If we get a repeat of 2012, then 2012 will probably be considered the second barrel of the 2007/2012 tipping points.
My penny and a half. - 2012 SkS Weekly Digest #9
Albatross at 09:17 AM on 6 March, 2012
Composer 99 @7,
Did your response from Carleton read like this? Can you say conflict of interest.
"Dear colleagues
As you may be aware a 97 page report entitled "Climate Denial in
Canada's Classrooms" has been prepared by Chris Hassall, an insect
ecologist post doc in the biology department, and three consultant
friends (technical writers and former biologists) that is highly
critical of the delivery of ERTH 2402 as taught by sessional lecturer
Tom Harris. They apparently acquired video copies of the lectures and
have dissected them line by line. Their criticism of statements made by
Tom make up the bulk of the report. The tone of the report is, as one
might expect from the title, that of strident activists. It is not
terribly scholarly. They even had issues with Tom remarking that "the
only constant about climate is change", a statement remarkably bland to
geologists.
As you know Tom last taught the course in 2010-2011 and is no longer a
sessional lecturer with us. As an institution and department we firmly
respect academic freedom in the classroom but are vigilant that the
highest academic standards be maintained in the delivery of our
courses. ERTH 2402 was not offered this year as part of the natural
rotation of courses within the department. The course will next be
offered in winter 2013 by Tim Patterson, a senior faculty member with
considerable expertise in climate change research. Tom's services in
teaching this course will therefore no longer be required.
The report is spreading through the blogishere generating comments from
supporters and detractors, but has only resulted in a single real media
article thus far-- in the UKs left leaning Guardian newspaper. It
will be interesting to see whether sufficient interest can be garnered
before the story becomes stale amongst North American media outlets. If
queried by media you may wish to refer them to the departmental chairman.
If interested I can send you a link to download a copy of the report.
Tim
R. Tim Patterson, Ph.D.
(Acting Chairman)
Department of Earth Sciences
Carleton University
Tel: (613) 520-2600 ex 4425"
Note who wrote the letter ;) The bolded text (my highlighting) is IMHO wholly inappropriate language for the chair of a department to be using.
People can write to the Dean of Science here. - (Fahrenheit) 451 ppm
skept.fr at 00:54 AM on 16 December, 2011
#94 Tom : I would have prefer a counter-argument on my 8 points in #91, but let's go.
Your answer first brings us to another of my concern about Sphaerica’text. Why IPCC exists ? Because there are thousands of science papers each year, because there are dozens in independant climate models and enery-economy models, beacause we need a global assessment of the confidence of climate scientists about the robustness of their results. As it has been noted by SkS , ‘The IPCC was formed to report on a broad range of scientific enquiries into the climate, and our effects on it, and to summarise the science for laypeople. The science they summarise is published so it is simple to compare the primary science with the IPCC reports, and compare both to what actually took place.’ In this paper, SkS suggested : ‘Claims that the IPCC is alarmist are not supported by evidence, and there are clear indications that the opposite may be the case.’ I don’t know what means the ‘opposite’, but if it is suggested that we must not believe the IPCC reports because they are too ‘non-alarmist’ (the logical meaning of the sentence above), it would be particularly devastating in my point of view. IPCC has always been the target of deniers because the doubt on the quality on statements from IPCC reports would imply a disruption in the public trust in climate science conclusions, as it would be very easy to say ‘oh scientists disagree, all that is matter of debate, we’ll see later’.
Previous point explains why I’ve problem with reference like Smith 2009 in PNAS. Why? Because it’s the job of the whole climate community (and not 17 of its members) to assess the reasons for concern from the whole literature (and not just part of this literature). For example, one of this reason for concern is the risk of extreme weather impacts. But there is a recent IPCC report dedicated to this specific question, SREX 2011 (quoted above), so we should refer primarily to such a report. At least, a reference to this report will have more weigh than a reference to a particular study in the thousand of studies among literature. Of course, you have the (democratic) right to select your references and to determine from them you own level of risk or dangerous change. It was my point, so feel free to refute or endorse it, but be coherent in your choice. For my part, I suggest the good choice would be to refer to IPCC. And I observe it is the typical denialist strategy to distrust IPCC and to cherry-pick the studies that minimize sensitivity, sea-level rise, icesheets melting, etc. Of course, from a skeptical point a view, a symmetric and opposite cherry-picking is of no value. That’s why the SREX reference is correct for our level of understanding about extreme events projections impacts, vulnerabilities, etc. And the future AR5 2013 will be the correct reference for broader conclusions about climate change.
The same is true for Bill Hare 2005 paper : not only it is a one-man work, but it has been written before the AR4 2007 publication. So at least, you must refer to WG2 and WG3 2007 conclusion concerning the impact or mitigation, as I did above when criticizing some Sphaerica’s proposals. And the same for Danny Harvey 2007 Clim Change paper.
More broadly, you’re speaking of the future deaths in the third world due to climate change. But nowhere you speak of present deaths in the third world due to non-climatic reasons and nowhere you critically assess the carbon consequences of policy choices for preventing these present deaths. As the long as this blindness to present problems is the rule in climate mitigation debates here, don’t expect any trust in the conclusions from such a one-sided approach. The 20 years CO2 rise is mainly due developing countries. So look at another publication from UN experts, the Millenium Development Goals report. What is said for example in the latest fact sheet about the first concern, Eradicate Extreme Poverty and Hunger ? : ‘Over a 25-year period, the poverty rate in East Asia fell from nearly 60 per cent to under 20 per cent. Poverty rates are expected to fall to around 5 per cent in China and 24 per cent in India by 2015 (…)The World Bank estimates that the effects of the economic crisis will push an additional 64 million people into extreme poverty in 2010, and that poverty rates will be slightly higher in 2015 and beyond than they would have been without the crisis, mostly in sub-Saharan Africa and Eastern and South-Eastern Asia. (…)Between 1990 and 2008, the proportion of underweight children under five declined from 31 per cent to 26 per cent in developing regions with particular success in Eastern Asia, notably China. Despite such improvements, progress is currently not fast enough to reach the MDG target, and particular focus is required in Southern Asia.’
So it easy to see how our economy and energy decisions will affect the quality of life in the world : million of children in China have benefit from the carbon-intensive policy of their government. A 3% of negative growth is not just about ‘pizza’, it is about damaging consequences for such million of people now, and billion from now to 2050. That is the reality we must all cope with : million of people now escape each year poverty, hunger, disease, illiteracy thanks to policy choices founded on carbon-intensive energy supply for the national infrastructures. The denialist attitude toward such a reality is no more sustainable as there is an exponential growth of emission from non-Annex B countries.
As defender of an egalitarian agenda, the problem for me is not just the share of wealth, but the very first creation of the wealth we can share in the present and the future. Your involuntarily bad but so suggestive example of 1950 USA standard (point 8 above) showed how difficult it is to universalize what is perceived here in Western contries as a medium quality of life without the supply of huge amount of energy. This is not about pizza, this is about the present and next generation life. And this is about my main point of concern in the present discussion : if we are to prevent a too sharp CO2 rise, we must first understand the origin of the rise from a human needs perspective and we must assess our policy choices for their realism in that purpose of satisfying human needs. Not just draw scary but impotent scenarios for the second part of this century. Not just defend a 450ppm target as an unquestioned mantra.
Let's say that Smith at al 2009 are correct and preclude the future IPCC AR 2013 conclusions, or that your 3 billion citizens water-disrupted estimate in 2070 or 2090 (for a 2,5-3K transient warming) is correct. In this eventuality, what must we do? Must we cut CO2 emissions at any cost, or must we cut these emissions in so far we can replace the carbon energy service they provide by another service of the same quality? Must we ultimately forbid or strictly limit the fossil supply even if we know that a non-fossil source cannot provide the same amount of energy for population needs? Is the urgent good choice a 450 ppm target or a progressive carbon tax or another strategy? What if tomorrow India or another giant simply leaves climate negotiations they perceive as a threat for their national development and the world sink in a selfish strategy of separate energy choices? How can we accelerate the deployment of RE energy now and not in 10 or 20 years?
That are non trivial questions waiting for non-trivial answers. Hope you have the time to look at the Revkin's links, some of these deal with such new perspective of the climate mitigation strategy. - Websites for Watching the Arctic Sea Ice Melt
michael sweet at 20:58 PM on 24 June, 2011
Eric: You have presented data at last!!
You have found an interesting article on Greenland. They model that the ice melt on Greenland will peak and then decrease as the temeprature increases. Melt last year was greater than they project for the coming, hotter decades. Hansen (linked above) projects that the melt will double every ten years. For the past 8 years the satelite data shows that melt has increased at a faster rate than Hansen expected. Perhaps your model will proove correct and the melt will slow down in the future, it will be interesting to see how this paper is received by the scientific community (it is too new to know how it will be received). Hansen made his projection several years ago and most people seem to think he is high, but the data support him so far.
For sea ice you have also picked the longest projections for an ice free arctic. Maslink, linked above, projects an ice free Arctic as early as 2013. We will see in a few years, perhaps ths September, who is more correct.
You always choose the most optimistic projections to base your choices on. Do you realize the risk associated with that course?
You have not addressed my comments on flooding (20,000,000 people lost their homes in Pakistan alone, not to mention China, Australia and the USA), drought (largely responsible for the fires sweping the USA right now, Australia had it's share this year) or ocean acidification (which I did not mention before but is a severe effect that must be reversed).
Which of these effects are reversible? How will they be reversed? Please provide more data, since you have shown the ability to find some. - Renewable Baseload Energy
Riduna at 18:15 PM on 28 November, 2010
Australia has the hottest, most accessible granites in the world, at depths of 4,500-5,000m. where temperatures are 250-300C. At shallower depth (2,500-3,000m) temperatures of 135-150C are sufficient to generate electricity.
Over 30 companies are currently engaged in exploring for and mining heat in Australia. The most advanced of these is Geodynamics (GDY) which is currently drilling wells in the Cooper Basin, north of SA and Hunter Valley in NSW.
It has already drilled into and fractured hot rock at 4,500m, creating a heat exchanger, and drilled production wells bringing super-heated water to the surface. It has developed and applied the technology needed to extract emission free geothermal heat for electricity generation.
GDY has installed a 1MW test generator which it expects to commission in 2011 and intends following with a 25MW power station in 2013 and thereafter a series of 50MW power stations feeding into the National Grid. GDY estimates that its Cooper Basin tenement contains sufficient economically recoverable heat to generate 6.5 GWe and that by 2020 it will be generating 500 MWe from this source alone.
Australia is endowed with sufficient accessible geothermal energy to replace all of electricity now being generated by burning fossil fuels. Why then does it boast the highest per capita CO2 emissions in the world and operation of the worlds dirtiest power station?
There are several reasons why geothermal energy has not developed more rapidly. Foremost among them is:
• government failure to place a price on carbon,
• reluctance to withdraw subsidies for production and use of fossil fuels and
• commitment to on-going use of coal using so called clean coal technology.
These are all tied to an unsubstantiated and dubious belief that Australian industry would become uncompetitive were it faced with higher electricity costs. That belief is vociferously advocated by the mining industry, electricity generators and other vested interests, particularly the NSW and QLD State governments that are increasingly dependent on revenue derived from mining.
Once a price is put on carbon (2011/12?) and raised by the market in response to emission reduction targets, capital will be attracted to investment in the most efficient fossil fuelled power stations and, increasingly, to investment in clean renewable energy, particularly geothermal. A price on carbon will also increase the price of electricity generated from fossil fuels, reducing then reversing the price differential between it and electricity produced from wind and geothermal heat.
Domestic use of coal will then contract and government subsidies, currently estimated to exceed $1 billion/annum will be withdrawn as the workforce now engaged in mining is progressively retrained and employed elsewhere. Lack of political will rather than any economic imperative is responsible for failure to use renewable energy sources more rapidly and extensively in Australia.
See various publications at http://www.geodynamics.com.au or google the topic. - September 2010 Arctic Ice Extent Handicapping Via ARCUS
dhogaza at 01:09 AM on 26 June, 2010
"Given that the ice sheet extent is on track to dip below the record low Sept/Oct 2007 levels that caused panic at the IPCC, you folks are showing admirable restraint. Nobody is going ape s**t."
IPCC suggests that the arctic will become ice free in summers in the 2050-2100 time frame, hardly panic.
If you want panic, note that those noted warmists Watts and Goddard recently predicted an ice free arctic by 2060. Much more pessimistic than the IPCC!
Of course there's been a flurry of posts afterwards trying to live that down, since they were apparently under the misapprehension that the consensus date for an ice free arctic is 2013... - Arctic Sea Ice (Part 1): Is the Arctic Sea Ice recovering? A reality check
michael sweet at 11:43 AM on 14 April, 2010
Humanity Rules:
Surface temperature is limited over the summer ice by the melting ice itself. The temperature in the past was near zero celcius and continues near zero. It cannot go up until the ice is gone. Even then, the surface temperature is constrained by the cold arctic ocean. It is not suprising that summer temps have risen less than winter. There is more room for change in the winter. It will be interesting to see in the next decade if the summer temperature starts to rise faster now that there is so much less ice.
There are reports that the old ice near Canada includes large sections that are rotten (contain much degraded ice). This ice may not be resistant to melt in the summer, depending on the weather.
I have seen a variety of predictions when the Arctic is expected to be ice free, ranging from 2013 (!!) to 2070. It seems to me that Dr. Hogarth has adopted a conservative tone for this thread (IMO a good position). These models are in flux as the ice changes from year to year. The next few years data will be interesting to see.


THE ESCALATOR

(free to republish)