


 Arguments
Software
Resources
Comments
The Consensus Project
Translations
About
Support
Arguments
Software
Resources
Comments
The Consensus Project
Translations
About
Support
![]()
![]()
![]()
![]()
![]()
![]()
![]()
![]()
![]()
![]()


![]()


Latest Posts
- EGU2024 - An intense week of joining sessions virtually
- Skeptical Science New Research for Week #16 2024
- How extreme was the Earth's temperature in 2023
- At a glance - Is the science settled?
- What is Mexico doing about climate change?
- 2024 SkS Weekly Climate Change & Global Warming News Roundup #15
- Fact Brief - Did global warming stop in 1998?
- Skeptical Science New Research for Week #15 2024
- EGU2024 - Picking and chosing sessions to attend virtually
- At a glance - The Pacific Decadal Oscillation (PDO) is not causing global warming
- Climate Adam: Is Global Warming Speeding Up?
- 2024 SkS Weekly Climate Change & Global Warming News Roundup #14
- Gigafact and Skeptical Science collaborate to create fact briefs
- Skeptical Science New Research for Week #14 2024
- How can I make my retirement plan climate-friendly?
- At a glance - Global warming and the El Niño Southern Oscillation
- A data scientist’s case for ‘cautious optimism’ about climate change
- 2024 SkS Weekly Climate Change & Global Warming News Roundup #13
- Skeptical Science New Research for Week #13 2024
- You can start applying for the American Climate Corps next month
- At a glance - Human fingerprints on climate change rule out natural cycles
- Want clean electricity? These are the overlooked elected officials who get to decide.
- 2024 SkS Weekly Climate Change & Global Warming News Roundup #12
- Climate - the Movie: a hot mess of (c)old myths!
- Skeptical Science New Research for Week #12 2024
- Climate Adam: Could the Amazon Rainforest Collapse?
- At a glance - Does CO2 always correlate with temperature?
- The U.S. has never produced more energy than it does today
- 2024 SkS Weekly Climate Change & Global Warming News Roundup #11
- Skeptical Science New Research for Week #11 2024
Comment Search Results
Search for mcintyre
Comments matching the search mcintyre:
- At a glance - What evidence is there for the hockey stick?
John Mason at 18:16 PM on 24 March, 2023No need to apologide, Nigel. All feedback is good.
I'll take another look at this. For at-a-glance, however, I felt that few completely lay readers would have ever heard of McIntyre or McKitrick; however their role in this could be brough in for Further Details. Often it's a case of choice whether to play the man or the ball, and that's not always easy: you have to weigh up how much prominence to give the actors.
- At a glance - What evidence is there for the hockey stick?
nigelj at 06:37 AM on 24 March, 2023Regarding the basic version of the rebuttal to the hockey stick is broken myth. This stated the myth at the top about Professor McKitrick and Steve McIntyres scepticism about the hockey stick, followed by a rebuttal. But IMO the rebuttal was a little bit vague and wordy, and didnt clearly say why McKitrick and McIntryes work was not relevant, and it wasnt clear on the fact that new studies done using different techniques supported the shape of Manns original hockey strick (the key point surely). In contrast the intermediate rebuttal was excellent.
- CO2 effect is saturated
MA Rodger at 23:19 PM on 13 September, 2021Eclectic @625,
Of course, there is the point as to whether you should be referring to that paper as Wijngaarden & Happer (2020). Academic work is usually only dated if it is properly published or if it is presented at a conference. Otherwise it would be demoted to being a working paper which is thus not complete and thus not properly dateable. And I would suggest that up-loading a paper onto Cornell University's "free distributon service" arXvi doesn't count as 'publication', it being no-more 'published' than this comment I post here at SkS.
But the proof of the pudding and all that....
Whatever tha nature of a piece of work's origin, it is its usefulness to the science that is the proper measure of it. A look at google scholar for Wijngaarden & Happer (unpublished) 'Dependence of Earth’s Thermal Radiation on Five Most Abundant Greenhouse Gases' shows today just four citations, which is pretty rubbish. And one of those is a reference from a further Wijngaarden & Happer paper posted @arXvi which is but an updated version of the same while accounting for two more GHGs, CF4 & SF6. Of the remaining three, one explicitly styles itself a working paper. (I note its reference list is stuffed full of denialist nonsense: Koonin & Jon-boy Christy, Lewis & Dicky Lindzen, McIntyre & McKitrick & Monckton, Svensmark & Woy Spencer.) The final two citations do initially appear to be by published work. But in tracking down both ♣Pascal Richet (2021): 'Climate and the temperature-CO2 relationship An epistemological re-examination of the ice core message', History of Geo- and Space Sciences, Vol 12, pp97-110. and ♣David Coe; Fabinski, Walter & Weigleb, Gerhard (2021): 'The Impact of CO2, H2O and Other "Greenhouse Gases" on Equilibrium Earth Temperatures' Int J. Atmos. & Oceanic Sci.,Vol 5, Issue 2, pp29-40. I see either a blank space in the pp97-110 page-numbering or the pages pp29-41 taken by another paper. So it appears that the final two citations have failed to gain publication; not so uncommon with denialist works which both these final two citing paper evidently are. (An on-line French version of the first of these two simply presents a common climate myth while a posting of the second's Abstract still visible on a denialist website shows its finding is an ECS=+0.5ºC.)
....turns out to be a large bowl of rather-sticky humble pie.
- Climategate CRU emails suggest conspiracy
Philippe Chantreau at 05:39 AM on 18 February, 2020Booker is not a reliable source. The mining/fossil fuel stooge S. McIntyre years ago launched a harassment campaign by asking multiple followers to file FOI requests, directed against scientists whose work he disliked. Because they knew that the requests were not a good faith effort, the recipients were reluctant to release information, which unfortunately escalated to whole thing in a away that then became easy to exploit for the bad faith actors. It can certainly be said that Jones and others could have handled this better, and that was one of the conclusions of the investigation. Whomever can be perfect all the time when faced with bad faith attacks can throw the first stone.
https://skepticalscience.com/Climategate-freedom-of-information.html
- How did climate change get so controversial?
Philippe Chantreau at 04:57 AM on 26 January, 2020UncleJeff, that's wishful thinking. Deniers have shown over and over their willingness to argue in the most blatant bad faith, against scientific realities that they often don't even understand. I have lived through the "carbonic snow in Antarctica" days, or the averaging of percentages without weighing made by prominent deniers at WUWT. I have seen the Soon & Baliunas fiasco, McIntyre&McKitrick junk. I found the standards of the deniers camp to be essentially non existent.
What you are saying is that there has to be a double standard: deniers can be completely full of it, deliberately lie, misrepresent, cherry pick, harass, misleadingly quote stolen e-mails, threaten opponents, but advocates of a livable future must be perfect, because even honest mistakes will be exploited by deniers. Unfortunately, you're right; that is the current state of this non-debate.
- Hockey stick is broken
MA Rodger at 00:53 AM on 18 January, 2020alisonjane @166,
The paper you found had the broken link in the OP is McIntyre & McKitrick (2005) 'Hockey sticks, principal components, and spurious significance'
- Skeptical Science New Research for Week #48, 2019
John Hartz at 09:02 AM on 7 December, 2019ed56@4: You wrote:
Then again, when there is no refusal of AGW (any more), why does the world need a website like this?
If you carefully read the following article, you will understand why your global assertion is not accurate.
Flat Earthers, and the Rise of Science Denial in America, Opinion by Lee McIntyre, Newsweek, May 14, 2019
- Here Are 3 Climategate Myths That Have Not Aged Well
nigelj at 05:59 AM on 29 November, 2019nyood @10
"However, as an every man lay when you come in contact with these leaked emails for the first time, it makes you really wonder why there is such a severe hostility towards skeptics"
The reasons for the hostility towards sceptics include the following:
1) the sceptics relentlessly mislead and cherry pick. Dont ask me for examples - read this website regularly.
2) the sceptics tie up working scientists with endless pointless information requests.
3) the sceptics verbally abuse scientists and have made death threats, particularly with M Mann, and naturally this in turn makes all climate scientists hostile towards sceptics. Why wouldn't it?
4) the sceptics relentless junk science.
This is more than enough to explain the scientists hostility towards sceptics, and if anything scientists have been very restrained and patient. As far as I'm concerned some of the sceptics should be in jail.
"The language used in these emails is concerning, they are very political and extremely polarized to a point where it makes one wonder if it is still possible for the authors to keep a scientific neutrality. As I am not sure if quoting emails is allowed here..."
Oh I'm happy to post a few from an article in Forbes, and that will be enough. We don't need too many silly lists distracting us all. I don't know if they are genuine. They are indicative of normal people dealing appropriately with difficult issues as anyone does. If they are political, its no more than any other organisation on this fine planet. There is nothing criminal, unethical or sinister, and numerous official investigations found no corruption of science.
You denialists make me laugh. You are the people with obvious political motives, mostly right wing, and with lashings of paranoia. But people with nasty suspicious minds and bad motives assume everyone is the same. News flash - we aren't all the same.
The emails:
“The trick may be to decide on the main message and use that to guid[e] what’s included and what is left out” of IPCC reports, writes Jonathan Overpeck, coordinating lead author for the IPCC’s most recent climate assessment."
This is meaningless without background context. Its a selective quote. And professional people decide content all the time, theres no indication of wrong doing.
“I gave up on [Georgia Institute of Technology climate professor] Judith Curry a while ago. I don’t know what she thinks she’s doing, but its not helping the cause,” wrote Mann in another newly released email."
It helps to actually know something about Judith Curry then you would understand and commiserate with the scientists in question.
“I have been talking w/ folks in the states about finding an investigative journalist to investigate and expose” skeptical scientist Steve McIntyre, Mann writes in another newly released email."
Oh dear oh dear. Given M Mann has received death threats and packets of white powder in the mail, and endless abusive emails. I'm going to "cut him some slack".
- Climategate: Hiding the Decline?
MA Rodger at 19:56 PM on 11 May, 2019shveydaxx @102,
The image you present (bar the highlighting) originates with contrarian Steve McIntyre a decade ago. At the time Keith Briffa rebutted the rather silly accusations of McIntyre and that may be helpful to you in depacking McIntyre's silliness or other silliness that his interventions have spawned.
- Next self-paced run of Denial101x starts on March 5
Philippe Chantreau at 04:40 AM on 10 March, 2019Since we have seen very few of these high quality skeptics that Pormetheus claims to defend, I asked for some examples, a reasonable request and also very much on topic. Why is that? The OP presents a course aims at identifying all the non quality hallmarks of fake skepticism, of those how are not sincere, who are not bringing valid questions based on well informed opinions and logical reasoning. Bringing examples of what the MOOC is not aimed at would be as on topic as it gets in this thread. But we don't get that, just excuses and more rhetoric.
At this point, a definition of rhetoric should be introduced:
"a. A style of speaking or writing, especially the language of a particular subject: fiery political rhetoric. b. Language that is elaborate, pretentious, insincere, or intellectually vacuous: His offers of compromise were mere rhetoric."
There is another shining example of that later. I spent a paragraph outlining a typical example of bad skepticism and dishonest method with the MCIntyre "release the code" BS. It is abundantly clear from my words that the so-called skeptics who participated in that were not of the good kind, as it is patent from the sequence of events. Yet, because I mentioned that McIntyre has FF ties, a fact relevant because it can cause bias or conflict of interest, I am accused of ad-hom and guilt by association. Prometheus owes me an apology on this one, because it is obvious that at no point I try to establigh McIntyre's ties to FF as the cause of the code-releas BS being BS. There is no ad-hom argument in my post but Prometheus manages to squeeze that in there in the middle all his rhteoric and make himself appear virtuous, despite that he just accused again without any substance.
- Next self-paced run of Denial101x starts on March 5
Philippe Chantreau at 08:58 AM on 7 March, 2019"Massive bias"
Where is the evidence to back up such an assertion? A massive bias has to be detectable. I mentioned BEST, which reached the same conclusion as the research that Muller initially believed to be biased. Where is you evidence that a massive bias exist?
As for your question to me, such organizations exist through the World. In France, it's called the Centre National de la Recherche Scientifique. They produce "objective" science. The results are published so if they're not replicable, they don't stand. That's how it works.
You are the one accusing a whole lot of people to be either dishonest or incompetent. Scientists who work for government agencies are supposed to do good work. If there is a massive bias, they're failing. What is there showing that it's the case?
I'll add that I need no schooling on logical fallacies. Nowhere do I suggest that McIntyre's nonsense is BS because he has ties to FF. It's BS because it has no value, especially the "release the code" crap. The nonsense stands on its own for what it is, but McIntyre does have ties to FF nonetheless.
- Next self-paced run of Denial101x starts on March 5
Philippe Chantreau at 04:36 AM on 7 March, 2019Your post is full of ideology and every bit as biased as you suggest others are. I personally trust the government for protecting the public's interest far more than I trust corporations, or any other organization, except those specifically created to protect the public's interest. Not only because it is the logical thing to do considering where their interest truly is, but because of their respective records. I hear all this distrust about the government, and very little to back it up. In fact, most of the stuff that would back it up is what happens when the government is corrupted by private interests for the furtherance of their profits. It's funny how the government gets so much scrutiny and so much bad press every time one little thing goes wrong, but the private sector gets a passs by default even when they commit the most massive screw ups.
Private banks came close to tanking the World economy in 2008, because the entire financial system had become fraudulent. Hardly anyone went to jail. A few years later they're already complaining against regulations put in place to prevent them from doing it again. Last December, Century Link had a giant screw-up that rendered 911 inoperative in hundreds of counties throughout the nation, and it was barely even mentioned; I don't want to even imagine the uproar if it was a government service. In 2017, Equifax essentially opened the doors and let their commercial base free for the taking, namely the private information of 143 million Americans, and everyone just shrugged their shoulders. No consequence whatsoever. I never hear anything from the "government is bad" types about these problems, which reveals a double standard large enough to invalidate anything they say that includes the word bias.
Even you Prometheus trust the government far more than you think: I bet that you have no problem taking an airplane to cross the country without doubting that Air Traffic Control will do its job. Think about this: if ATC had a 99.99% success rate in their handling of flights all over the nation, you would see about 50 ATC-caused crashes per day. Instead, you see exactly zero, because the FAA achieves 100% success rate every day and has done so for years. As for the airlines, they achieve their success largely by complying with all these pesky regulations fort maintenance and operation that are there so our butts get from A to B safely every time. That's government work right there, so much a part of the landscape that people don't even realize it's serving them. This lack of perception and of recognition applies to pretty much everything that the government does right, which is vastly more than anyone in the US realizes.
You're talking about NASA and NOAA as if they were shady organizations bent on deceiving the public. That is total nonsense. Not only they are open to scrutiny and far more transparent than many private organizations, but their existence and their funding depends on them doing their job right. These administrations are full of highly educated, dedicated scientific experts, who often could make far more money in the private sector but they want to serve the public. Over the years, NOAA has refined their understanding of hurricanes and can now give 72 hours of notice within a very well defined geographical area so that evacuations can take place before a storm strikes. They save lives that way, and businesses too. Of course, some work at NASA has very strong implications with national defense and military applications, so the apropriate secrecy applies; usually the military is the darling of the "bad governement" types of ideologues so perhaps you don't mind that part.
So-called skeptics, led by the Fossil Fuel funded McIntyre, started whining about NASA Goddard not releasing the code for their climate models some years back (a number of years, I've followed this for a while). The argument from Gavin Schmidt at the time for not giving the code was perfectly reasonable because the algorithm had been released, but McIntyre went on a full blown mind manipulation campaign that was quite successful with his gullible followers. So NASA released the code, and of course, nothing happened. Zip. Why? Because none of these self professed skeptics had the expertise or were willing to put in the effort to examine the code. The demands to release information were nothing but a campaign to spread doubt in the integrity of NASA. Once the code was released, the pseudo-skeptics moved on to other things.
Another governement disliker and skeptic was Richard Muller. He did not believe NASA and NOAA either, so decided to examine global temperatures on his own by forming an independent team at Berkeley. He was hailed as a hero at the time by Anthony Watts. After quite a bit of painstaking dedicated work, they came to pretty much the same conclusion as NASA and NOAA. Anthony Watts didn't like him any more. You can find the BEST stuff along with the other sources regularly updated on the Real Climate site: NOAA, HADCRUT etc...
I've had conversations on this site before with skeptics strongly animated by anti-governement ideology, sometimes on the subject of MODTRAN, the line by line atmospheric radiative transfer model. They argue that it's just a model and it's a government thing, whatever. Yes, it's a model, developed by the Air Force for infrared weapon guidance, you really think it's inaccurate?
After years of following this pseudo-debate, it turns out to be really simple. Science aims at understanding the world. The quality, sincere science in the case of climate change overhwelmingly points in a certain direction. Fossil fuel interests have billions of dollars of profit per quarter at stake. Who do I trust? Seriously? What a joke.
- Freedom of Information (FOI) requests were ignored
Daniel Bailey at 09:53 AM on 26 December, 2018Note that the Muir Russell Commission was able to do a full global reconstruction from the raw data linked to from the above page, without any code, in a mere 2 days (when asked, they replied "any competent researcher" could have done the same).
The Auditors over at McIntyre's Climate Audit have been struggling with their "audit" reconstruction for many years now.
The "any competent researcher" bit comes from here:
"key data was freely available and could be used by any "competent" researcher"...They used data from public databanks and wrote their own computer code, which they say could be repeated by any "competent researcher". The results were similar to those of the CRU."
And
The "2 days" bit comes from here:
The report itself is here.
- How we know the greenhouse effect isn't saturated
MA Rodger at 19:52 PM on 23 March, 2018Further to my assertions @104 concerning the requirement for CO2 warming to maintain H2O in the atmosphere, a paper looking at the impact of the zeroing of LL GHGs has featured in the evidence resulting from Judge Alsup's call for an AGW tutorial. The evidence in question is from Monckton, Soon et al (its contorted thesis of high humour content) which cited Lacis et al (2010) 'Atmospheric CO2: Principal Control Knob Governing Earth’s Temperature'. While the description @104 was bravely considering a zero-CO2 steady-state, all LL GHG are something like 75% CO2 but those other LL GHG will be much reduced in a colder world so there won't be a great difference between zeroing CO2 and zeroing all LL GHG.
Lacis et al show by zeroing all LL GHG the world begins to cool at 4ºC/year thus becoming colder than ice-ages in 18 months. The cooling continues but at a far lower rate after the first seven years, and temperature will still be sinking beyond the 50 years of the modellng. At 50 years, average annual temperatures at the equator remain just above freezing allowing atmospheric H2O at 20% of pre-industrial values but 50% of the oceans are frozen over.
- 2017 is so far the second-hottest year on record thanks to global warming
John S at 04:37 AM on 2 August, 2017I just finished viewing a doc on You-Tube entitled “Climategate II Explained – NOAA Whistleblower – Data Manipulation – Global Warming Hoax” by Larouche PA published recently. Wikipedia’s account of Larouche PAC seems entirely economic, no climate change involvement indicated. The gist of the 72 minute lecture by an unidentified (?spokeperson for Larouche PAC?) was that ““NOAA breached its own rules on scientific integrity when it published the sensational but flawed report, aimed at making the maximum possible impact on world leaders including Barack Obama and David Cameron at the UN climate conference in Paris in 2015.” This was by Karl et all (2015) that claimed warming rate was twice what prior versions showed ( source Anthony Watts October (2015) and argued that truth was shown by satellite data from both UAH and RSS showing a flat line over this period. I know that Anthony Watts is a notorious climate change denial blogger, but rather than just dismissing the whole argument based on its source, I’d rather understand more of the background on this – basically is it true that, as alleged in this doc, NOAA fiddled the data, suppressed any internal dissention and then mysteriously “lost” the data all as revealed by whistleblower John Bates, a 40 year NOAA veteran and eminent climate scientist. I’m well aware that cherry-picking end-points over such a short period is no good way to consider the warming trend and that RSS put out a correction to its earlier data. What I want to know is any specific background on this specific accusation of wrong-doing by Karl et al exposed by Bates..
Later the talk characterizes such antics as typical for climate change advocates, citing the “broken hockey stick” supposedly exposed by McIntyre & MacKitrick in Energy and Environment. I heard Michael Mann’s response that their method was flawed but, again, I’d like to understand this on a deeper level than just “he said, she said”.
It also goes on about NASA supposedly lowering data before 1950 and raising it after 1950 thereby supposedly creating a warming trend. I heard about the correction of “bucket variances” for ocean data but I also thought I’d heard that these NASA adjustments created a lower warming trend not higher – so is the Larouche Pac presentation just a bald-faced lie or is there some more subtle fallacy involved in it?. The same accusation of NASA adjusting data upwards after 1950 was made in another doc on You-Tube, so, on the basis that where there’s smoke, there may be fire, I’m wondering where this story is coming from. I appreciate that adjustments to the temperature record have to be made to produce the best estimate of trend and so this can change retroactively and this fact alone allows the deniers to come in with clod-hopping boots, but as I said above, my understanding was that the net result of these adjustments was a lower warming trend not higher as alleged, so is that just a lie or what?
They also had a more fundamental question which I admit has confused me quite a bit also and that is how it is at all possible to calculate a global average from such a variety of circumstances affecting each temperature measuring device? I saw an explanation on NASA’s web-site of why changes were more reliable to average than absolute values but even so (and even after watching Cowtons’ excellent presentation on Denial 101x) it’s still a baffling subject. Maybe there is a good reference you can give me to read up on this. - Inconceivable! The latest theatrical House 'Science' committee hearing
Jim Hunt at 22:51 PM on 5 April, 2017My own thoughts on last Wednesday's events:
The House Science Climate Model Show TrialSome highlights from my Transatlantic perspective:
The denialosphere is of course now spinning like crazy attempting to pin something, anything, on Michael Mann.
not to mention:
Why on Earth Judith chose to repeat the “CAI” allegation is beyond me.
and:
Given our long running campaign against the climate science misinformation frequently printed in the Mail on Sunday it gives us great pleasure to reprint in full the following extract from [Mann’s] written testimony:
I'm currently doing battle with Steve McIntyre and other "skeptics" on Twitter over his assertion that "the CV contradicts his lie" regarding Mann's alleged CAI "affiliation/association".
I can only assume that Mr. McIntyre has neglected to watch the above video of the proceedings. I even managed to persuade one of Judith Curry's "denizens" to take on board my point of view about that contentious issue! - How to inoculate people against Donald Trump's fact bending claims
ryland at 19:42 PM on 24 March, 2016Dr Death @8. Not unsurprisingly despite your comment "I will look at scientific facts and the reasons for it and then I look at the debunking side of it as to why people believe that part is not true" none of those responding to your post have provided you with any sites where "debunking" occurs on a regular basis.
Some of those sites are Wattsupwiththat run by an American "meteorologist" but probably more accurately a TV and radio weather presenter; Jonova run by the Australian Joanne Nova who has an Honours degree majoring in Microbiology and Molecular Biology from the University of Western Australia; ClimateAudit run by Steve McIntyre a Canadian with a Bachelor's degree im Mathematics from the University of Toronto and a degree in politics, philosophy and economics from the Unversity of Oxford; Climate Etc run by the American Dr. Judith Curry who is a climatologist with many peer reviewed publications in the field of climate science; Global Warming Policyh Foundation started by the Englishman Nigel Lawson (aka Lord Lawson) who was the Chancellor of the Exchequer in Mrs thatcher's government. Others you might like to look up are the American Dr. Richard Lindzen an atmospheric physicist educated at Harvard, the American meteorologist Dr Roy Spencer and the American climate scientist Dr john Christy who, with Roy Spencer monitors the global climate using information from satellites
All of those who I have mentioned are persona non grata at this site but as your stated aim is to examine the views from the "debunking side" it seems remiss not to point you in the direction of some, but by no means all, of those who frequently comment on the 'debunking side" of the climate debate
- Climate denial linked to conspiratorial thinking in new study
Tom Curtis at 13:27 PM on 12 January, 2016chriskoz @54, Sheehan writes:
"The paper was entitled "NASA faked the moon landing – therefore (climate) science is a hoax". The abstract of the study states: "Endorsement of a cluster of conspiracy theories [...] predicts rejection of climate science … This provides confirmation of previous suggestions that conspiracist ideation contributes to the rejection of science."
Note the term "conspiracist ideation". The English language is being brutalised in the social sciences to create a false sense of rigour.
When Jussim checked the data, he found that of the 1145 participants in the study, only 10 thought the moon landing was a hoax. Of those who thought climate science was a hoax, almost all of them, 97.8 per cent, did NOT think the moon landing was a hoax."
(Emphasis mine, elipsis in square brackets mine)
If you look at the underlined sentence, what is claimed by the Lewandowski paper is that:
1) If you are a conspiracy theorist, you are more likely to be a climate change denier.
It does not claim that:
2) If you are a climate change denier, you are more likely to be a conspiracy theorist.
The two claims are quite distinct. One is a particular claim about the population of conspiracy theorists, and makes no particular claim about the population of climate change deniers. The other is a particular claim about the population of climate change deniers and makes no claim about the population of conspiracy theorists.
However, when we look at the evidence presented by Sheehan, it is a statistic about the population of climate change deniers, not about the population of conspiracy theorists. That is, it shows that the data for the Lewandowski "moon landing" paper does not support proposition (2) above. (Actually, it only shows it for a restricted version of proposition (2), as there were a total of 10 conspiracy theories considered by Lewandowski et al.)
For some strange reason, the logician in me wants to insist that refuting 'if B then A' does not refute 'if A then B'. It really does not. Ony those who do not understand the meaning of the word "if" could think otherwise.
So the best that can be said of Sheehan's critique (which he copied of McIntyre, JoNova and a host of other 'skeptical' luminaries) is that he is incompetent at either at logic, or at reading comprehension, or both.
- Hockey stick is broken
dvaytw at 00:11 AM on 8 November, 2015This comment will start a bit off-topic and then quickly make its way back, I promise.
As an introduction, I posted a response to Dr. Richard Muller's response to the following question on Quora:
It may interest people to know that Dr. Muller basically rules that forum when it comes to questions about climate change impacts, and IMHO, he's running amok. I don't think it comes from the usual ideological motivators; rather, I think it's the hubris that physicists tend to get that leads them to distrust the work of any scientists other than physicists. That and maybe some misunderstanding with regard to philosophy of science. In any case, here's where I get back on topic.
In my response to Dr. Muller, I quoted Wikipedia to him, pointing out that he'd been wrong in his opinion piece about Dr. Mann's Hockey Stick.
The quote stated that subsequent analyses had refuted McIntyre and McKitrick and upheld Mann's paper; further, that the Hockey Stick has been replicated numerous times using other methods.
It's a bit lengthy, but I'd like to post his last response to this exchange in full, as I found it very interesting and troubling:
First, let me say some words about the IPCC report.
To be considered a scientific conclusion, the rule of thumb amount scientists is that the probability of being wrong should be 5% or less. In particle physics, the standard is even higher, generally a fraction of 1%.
The IPCC defines something as "likely" if the probability of it being wrong is 33%. That is very far from a scientific standard. Sometimes politicians need to make decisions and they base them on less than scientific evidence, but 33% chance of being wrong would never be accepted as a scientific conclusion in any major scientific journal. When scientists say that their result is statistically consistent to 1 standard deviation (that's about the same as "likely") the conclusion in their paper is stated as follows: "No statistically significant effect was seen." I can show you one of my papers in which, for a 2-standard-deviation effect, that is a "2-sigma" effect, with only a 5%b chance of being wrong, I and my coauthors said that the effect was "statistically insignificant." Those are the standards of science.
The IPCC is also very clear that their assessments were never intended to be considered a scientific report.
Your quote about the NAS report, despite the usual reliability of Wikipedia, is mistaken. As I mentioned, I was a named scientific referee on the NAS report, and the report said clearly that there was no evidence that the current temperature is the warmest in 1,000 years.
Don't get me wrong. Global warming is real, about 1.5C over the past 250 years, and it is caused by humans. But the work of Michael Mann on the hockey stick was incorrect, and the errors were correctly pointed out by Macintyre and McKitrick, and the NAS concluded that the evidence could not be used to conclude on a scientific basis that we are now experiencing the highest temperature in the last 1000 years.
I'm curious what y'all's take on this is. It strikes me as, well, quite odd. I feel like, about the question of the use of the IPCC's uncertainty terminology, there's a deep misunderstanding here. Without having read much, I'm quite sure that climate research uses the same Frequentist standards that Dr. Muller is used to and that, if the IPCC is assessing likelihood based on a large number of such pieces of research, all of which purport to be showing statistically significant results, then in fact the IPCC is being even more conservative with its use of such terminology and not less.
- Climate's changed before
Tom Curtis at 10:07 AM on 31 October, 2015A Real Skeptic would know, having examined the issues, that Mann Bradley and Hughes 1999 (MBH99), aka, the Hockey Stick, has not been debunked despite strenuous efforts by McIntyre and McKittrick. Rather, McIntyre and McKittrick have used a statistical measure that calls a straight line plus white noise a Hockey Stick to argue that random noise generates Hockey Sticks in an attempt to debunk MBH99.
This is not to say MBH99 is without flaws (many first pointed out by Mann himself in later publications). Rather, it is a reasonably accurate first attempt to generate a multi proxy paleo temperature index with a calculated uncertainty. Because it was a first attempt, Mann, Bradely and Hughes had things to learn and made some mistakes, but the mistakes do not undermine the fundamental conclusions. This is seen by comparing MBH98 to later resonstructions that have eliminated some of those mistakes. Of those, the PAGES consortium reconstruction has used the most data and robust methods, and hence represents the best global reconstruction over recent times:
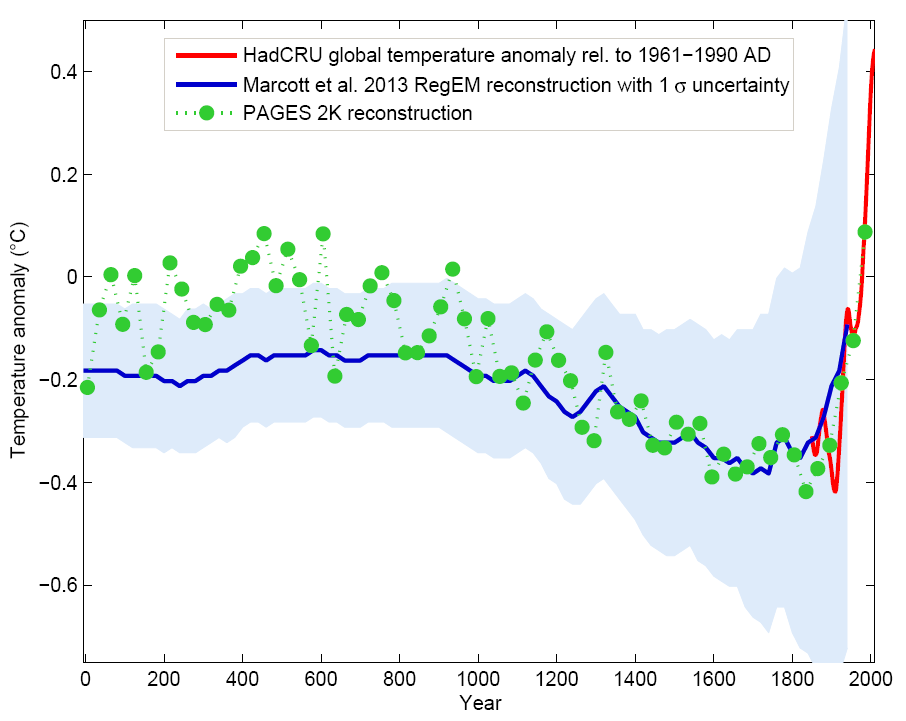
Please note the green dots (ie the PAGES reconstruction) all represent 30 year averages, so that the graph is not smoothed at a different rate for the recent period, yet the 20th century still stands out for the rapidity and magnitude of the temperature rise, not mention the reversal of the long term cooling trend and the magnitude of the final value (1971-2000) which exceeds all others. There is, of course, a qualification on that final result:
"Many of the proxy records used in the reconstructions were generated some years ago and end before the year 2000. The reconstruction for North America, Asia and South America do not extend to the 21st century. The instrumental record shows that the last several decades have generally been warmer than previous decades. Therefore, the most recent 30-year period in our analysis (1971-2000) underestimates the actual temperature of the last 30 years."
(From the PAGES FAQ, my emphasis)
Finally, it is my instinctive reaction to treat "persuasive names" such as "A Real Skeptic Says" as indicating that the person choosing the name doesn't think their real skepcism will come across without their first telling us their presumed status. That instinctive reaction is rarely wrong. So rather than flagging the uncommon skepticism of the person involved, it tends to flag the opposite. Just a word to the wise.
- Watts' New Paper - Analysis and Critique
MA Rodger at 20:25 PM on 3 July, 2015John Hartz @85.
There was another odd aspect to the authorship of Watts et al. (unsubmitted). The listing of the four authors (Watts, Jones, McIntyre, Christy) was followed by the following "plus additional co-authors that will be named at the time of submission to the journal". While at the time it appeared very odd, in the circumstnces it presumably will be a list of all the folk who identified and corrected all the mistakes in the original draft (if they care to be so named).
Tristan @90.
I think the source of that Evan Jones quote you present and what it is allegedly answering should be made a little more clear. It is from this 2014 HotWhopper comment thread (or threads - there was a previous one that it transferred from) which was exceeding long and didn't get very far (or questions such as that @90 would have been resolved).
One of Jones' final comments said "... But we cannot address all of this at once in one paper. I look forward to examining all of these issues." All rather ominous.
Evan Jones.
Given this record you have of filling up comment threads to no purpose, can you make clear your purpose here? Are you just after a bit of a chat? Are you here to announce the imminent pre-release of Watts et al.(unsubmitted) for a second time? Do you wish to share some specific aspect of its content with us denizens here at SkS (& if so, we would benefit from knowing what)? Or are you just trolling it?
- Making sense of the slowdown in global surface warming
Phil at 05:17 AM on 27 May, 2015@2 "Were global temps at the higher end of predictions at some point?"
This Sks post (by Dana) contains the following statement;
The observed trend for the period 1998–2012 is lower than most model simulations. But the observed trend for the period 1992–2006 is higher than most model simulations. Why weren't Curry and McIntyre decrying the models for underestimating global warming 6 years ago?
- 2015 SkS Weekly Digest #17
Tom Curtis at 14:05 PM on 27 April, 2015DSL @2, Roman Mureika is a statistician that frequently comments at Climate Audit, being very critical of anyone disagreeing with McIntyre. As a rough measure of his ability, he has an effective Google Scholar h-rating of 6. Most of his papers deal with the ins and outs of record times for 100 meter sprints. For comparison, Grant Foster who is belittled on Climate Audit as a statistical nobody in comparison to Mureika has an effective Google Scholer h-rating of 10. What is more, unlike Mureika, he has published on the temperature record.
The GWPF is certainly stacking the deck with people with a known outlook. As Nick Stokes points out, they have also stacked the deck with the questions they put to the inquiry.
Having said that, van Wijngaarden has an academic record that certainly justifies his being on this sort of panel, including publications on climate statistics. Based on his publication record, he at least is unlikely to perform a simple hatchet job.
- 2015 SkS Weekly Digest #14
chriskoz at 20:04 PM on 8 April, 2015You certainly have heard about new paper about AMOC slowdown by Stefan Rahmstorf et al. No free full text but plenty of comments on RealClimate.org and in popular press (e.g. linked to from Mike Mann's facebook).
But did you hear about Steve McIntyre's Blunter on the subject? Worth reading, just to haver a good laugh. While trying to critique said paper, Steve confused δ15N, a proxy for water mass movement, with a proxy for temperature. Subsequently, Steve's entire critique turned invalid nonsense.
- Climate Deniers Employ Predatory Tactics in Fight Against Facts: Scientist
Tom Curtis at 08:36 AM on 12 January, 2015PW inline @24, some of the "inappropriate language" in the CRU hack emails only has the appearance of being inappropriate by being quoted out of context. As Richlieu purportedly said:
"If you give me six lines written by the hand of the most honest of men, I will find something in them which will hang him."
It is a tribute to the integrity of the CRU hack victims that, having been furnished with tens of thousands of words spoken in private, the modern day Richlieu's can scarcely find six words altogether on which to build their spurious cases (and have been caught out fraudulently altering graphics* in order to make their case against the CRU hack victims appear stronger)
*Steve McIntyre may have simply used a low resolution html image rather than the high resolution PDF available. That being the case, he is simply caught out making bold, libelous accusations based on non-original data, known not to be sufficient to determine the case rather than making fraudulent alterations. The same defence cannot be made by the Mail on Sunday.
- Models are unreliable
Tom Curtis at 08:13 AM on 4 December, 2014SDK @784, what you are looking for was in fact provided in the draft version of the recent IPCC report:

In this graph, the range of the projections are given as the range between the mean projections for two different but plausible bau scenarios. To that is appended the grey zone representing the reasonable range of annual variability due to short term factors such as ENSO. The graph was ammended in the final report, mostly because of a fake controversy (see here and here)generated by ignoring that fact (which was not sufficiently emphasized by defenders of climate science, myself included). The graph does have some flaws, including an inappropriate baselining on a single year and the fact that the grey zone, out of graphic necessity, is drawn from the upper or lower limit of all projections. Therefore caution should be used in presenting that graph, which should not be presented without the disclaimers regarding its flaws, in links to rebutals of the trumped up controversy.
For these reasons, I prefer my own graph which plots observations against all model runs for AR4:

Doing so allows the actual model variability to define the expected annual variability, thereby eliminating the false perception of smoothness sometimes generated by showing only ensemble means for projections. The test for those claiming the models failed to project the current temperatures is to pick out the observations from the projections. If they cannot do so easilly, then the model projections have correctly captured both the trends (see below) and the range of annual variability.

- Mann Fights Back Against Denialist Abuse
CBDunkerson at 00:35 AM on 2 December, 2014dvaytw. as Tom has pointed out, the entire 'Tim Ball victory' story was a bizarre bit of fiction. I can't believe deniers are still managing to live in that alternate reality months after the fact.
Information about the data for the 'hockey stick' can be found here;
Of course, the fact that the National Academy of Sciences and numerous individuals (including 'sceptics' like McIntyre) have reviewed this data makes the continued claims that it isn't available right up there with Tim Ball's amazing non-existent court victory in the category of 'evidence that these people are mentally ill'.
- Hansen's 1988 prediction was wrong
Tom Curtis at 09:46 AM on 15 November, 2014TallDave @24:
1)
"Emissions (especially of CO2) rose like Scenario A."
Not according to Gavin Schmidt at Real Climate:

Or Tamino at Open Mind:
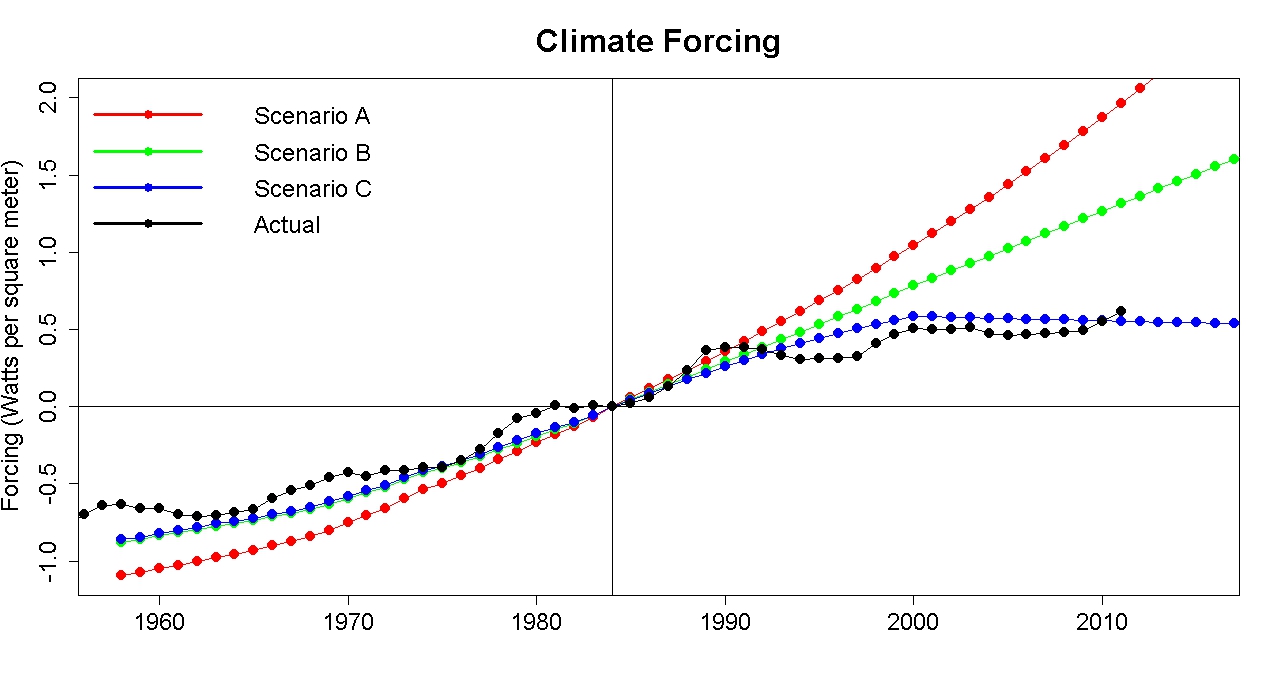
Or Steve McIntyre at Climate Audit:
What distinguishes all four from TallDave is that they have actually consulted the concentration data for the three scenarios, and done the calculations and compared them to observed changes in radiative forcing. All show actual forcings due to greenhouse gases slightly less than that for Scenario B, with the exception of Tamino who compares to all forcings (except volcanic) and finds the result slightly less than scenario C. (Note: he is not in disagreement with the others, he merely makes a different comparison.)
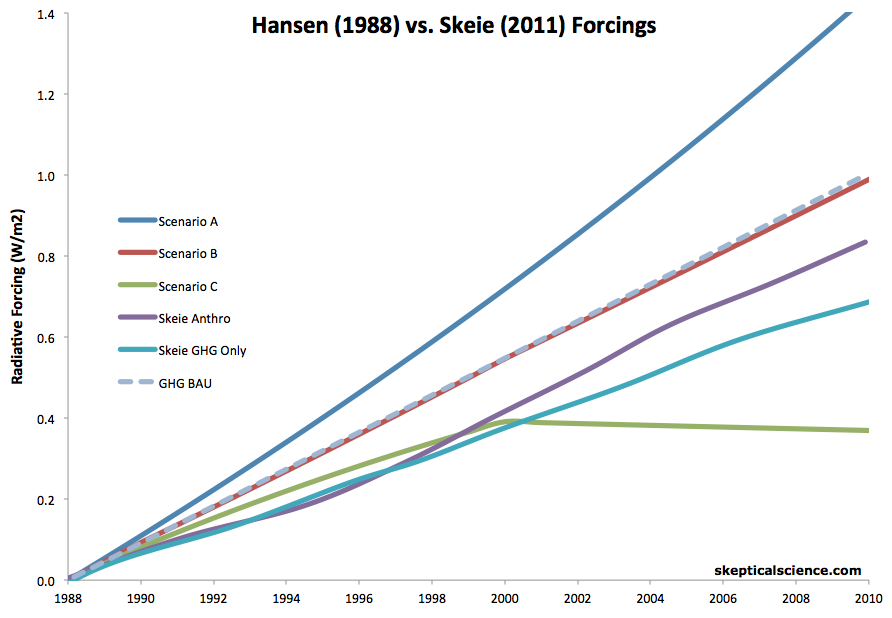
As can be seen from Steve McIntyre's graph, and in the following graph from Dana, while growth in CO2 (and NO2) was close to that predicted in Scenario A, growth in other greenhouse gases was way below that predicted for scenario A so that the total forcing was significantly less than that in Scenario A.
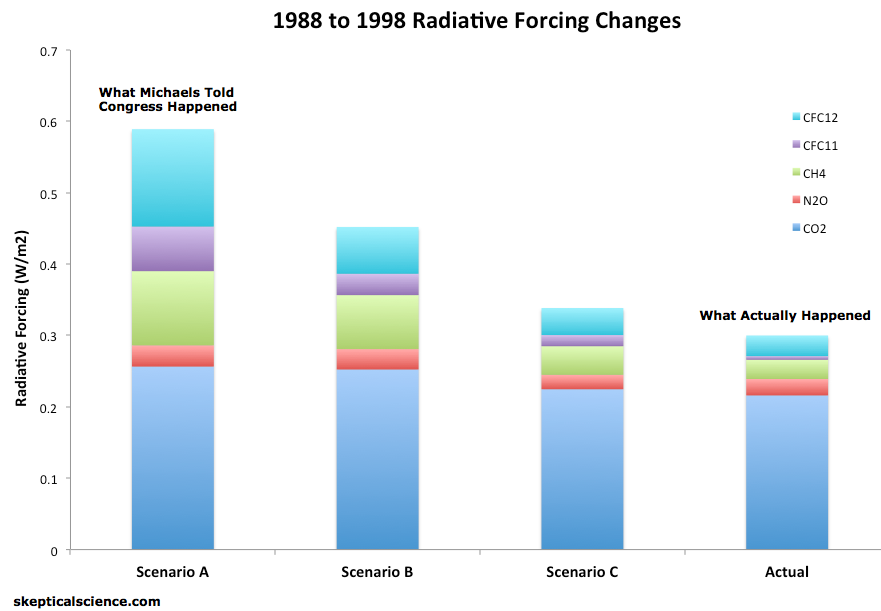
(Note with respect to Dana's graph: Hansen 1988 included the value of a host of minor greenhouse gases by the expedient of doubling the concentration of CFC 11 and CFC 12. Because Dana compares to the actual values of CFC 11 and 12, he leaves out these other minor gases. The actual growth in GHG radiative forcing is slightly greater than shown in Dana's graph.)
The growth in CO2 concentration is close, but not the same as that in Hansen's scenario A. Specifically, throughout the 1990s growth in CO2 was less than projected in scenario C. Since then, the growth rate has exceeded that in Scenario A so that concentrations have recently risen to about the scenario A level (and will soon exeed it if it has not already) - a pattern that can be seen in the EPA graph. The lower initial growth results in a lower initial radiative forcing, and hence a lower initial temperature growth that will not be eliminated for several years due to the thermal inertia of the ocean.
This is one of many topics in climate science where the common pseudo-skeptical opinion (as presented by Dave) cannot be honestly sustained except by the expedient of not checking the data. Comments such as Dave's are therefore always either insincere, or misinformed. Given the copious sources of information to the contrary, if misinformed by somebody who maintains some knowledge on the topic (as TallDave clearly does), then they are negligently misinformed.
2) TallDave quotes a small portion of the congressional testimony from a section of which I have already quoted at length. It comes just before the section I bolded, a section which makes quite clear that the the purpose in mentioning the scenarios was simply to explain the features of the graph, not to draw any conclusions from it. In other words, in response to my extensive quotation, TallDave's only response is a small out of context quotation that fails to address any of the points I raised. Therefore it requires no further refutation.
His rhetorical question regarding Scenaro C is shown to be less than candid by the fact that the common opinion of those who have analysed the data is that the observed GHG forcings most closely match scenario B.
3)
"Obviously because they're the only ones that can be tested on any meaningful time scale. Contra this site, the ability of a model to hindcast a highly complex phenemonen gives little confidence in its forecast (something painfully well-known in other fields)."
Contrary to TallDave's missinformed epistemology, there is no logical difference between forecasting and hindcasting. The only additional epistemic support to be obtained from successfull forecasting is forecasting is by its nature immune to overfitting the data. With GCMs, the number of parameters is very small relative to the number of predicted variables. That is not the case if you only pay attention to GMST, which is why pseudo-skeptics only consider GMST (plus a few other cherry picked data) for comparison to models, whereas climate scientists validate models against a large range of observed data. That is also, by the way why there is an approximately 15% mismatch between hindcast GMST model and observed trends over the last thirty years. The models are not fitted to obtain that result (for if they were, they could get a better match), but obtain that near match anyway.
- Models are unreliable
Tom Dayton at 04:35 AM on 26 October, 2014BojanD: An example of incorrect baselining by using the single year 1990 was an IPCC AR5 report preliminary draft's plot of model projections versus observations. That error was pointed out by Tamino and explained by Dana here on SkepticalScience.
That particular error has a problem in addition to what I explained in my previous comment: Each model curve is a different run of a model, with different parameters; think of each curve as being from an alternate Earth. The mean curve of those curves inherently averages out the noise and so is representative of the population of all those curves--the Average Earth. But there is only one observed dataset--only one of the many alternate Earths. We can't create an average across all the alternate Earths' observed temperatures, because we've got only one Earth. We have a really sparse sample of the population of alternate Earths' observed temperatures, that we are comparing to a much larger sample of the population of alternate Earths' modeled temperatures.
We can't get more alternate Earths' observed temperatures. But at least we can get a better estimate of the population of observed temperature at that year (1990) by averaging across the 30 years centered on 1990, and using that average as our baseline.
- Hockey stick is broken
Tom Curtis at 10:30 AM on 4 October, 2014I have been playing around with the top 100 (cherry picked) Hockey Stick Index (HSI) that are all that are supplied by McIntyre and McKitrick in supplementary data for their 2005 paper in GRL. In doing so, I noticed certain defects in the Hockey Stick index they used. Of these, the most glaring is that for any straight line with a any slope other than zero (fat) or infinite (vertical), it indicates that the straight line is a hockey stick. Even with white noise added, so long as the Signal to Noise ratio does not excede one, the line will probably (>50% chance) be given a HSI greater than 1, the conventional benchmark used by McIntyre to indicate something is a hockey stick.
Here is an example of a straight line "hockey stick":
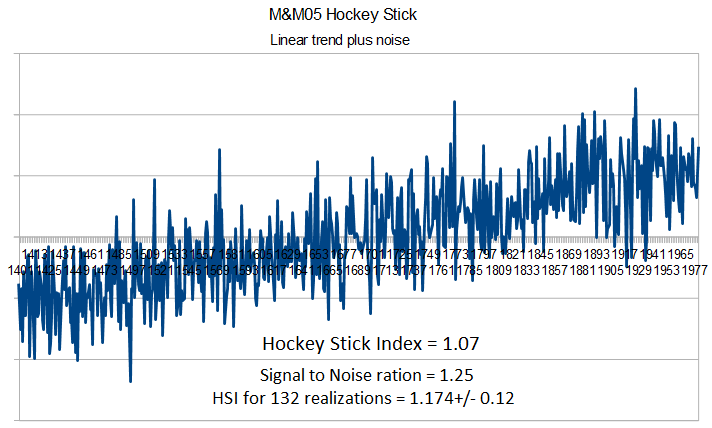
In this case, the HSI is less than that for MBH 98 or 99, but the mean is of the 132 realizations is greater. That is, according to the M&M05 HSI, a straight line with white noise and a S/N ratio of 1.25 or more is more like a hockey stick than are MBH98 and 99.
This fact does not depend in any way on the slope (provided it is neither flat nor vertical). Negative slopes will yield negative HSI's, but M&M05 (correctly) regard negative HSI's as equivalent to positive values in that the MBH98 reconstruction method flips the sign on proxies if that yields a better fit to the temperature data (which is not an error).
From this it follows that the HSI developed by M&M cannot consistently distinguish between a straight line and a hockey stick shape. I suspect there are other shapes that it cannot distinguish either, but for now we need only consider the straight line. That means that, from the M&M05 HSI, we are unable to determine whether or not half of the 10,000 pseudo proxies are distinguishable from a straight line. Nor, using that index, are we able to distinguish MBH98 from a straight line. That means that as a statistical test of the tendency of short centered PCA to generate shapes similar to that of MBH98, the test is totally without power. It tells you absolutely nothing.
The total statistical power of the first part of M&M05, it turns out, comes from the visual comparison between MBH98 (fig 2) and the MBH first Principle Component of the North American Tree Ring Network (fig 3). That's it. And as everybody should no, eyeball Mark 1 has very little statistical power as well.
Not being content with finding a flaw with M&M05 statistical test, I looked to see if they could have done better. In the end I developed five variant Hockey Stick Indexes (vHSI) that were superior as a statistical test of a hockey stick shape (although not necessarilly under all circumstances). These were,
- The ratio of the standard deviation of the calibration period relative to the calibration period (1902-1980) relative to the standard deviation of the non-calibration period. This tests for flatness in the "handle" vs noisiness or a high relative slope in the "blade". Like the M&M HSI, it will only work well when the "handle" is flat, but will work better in that circumstance.
- The angle formed by the slope in the calibration period relative to the angle of the slope of the non-calibration period if the two are displaced to intersect at the first year of the calibration period. This tests merely for the angle between "blade" and "shaft" and will work well regardless of orientation . It will not tell you how flat the "handle" is, however, and so can be confused by "hockey sticks" with very crooked "handles".
- The closeness of the largest inflection point in the period 1850-1900 to the inflection start of the calibration period. The inflection point is defined as the start year of the largest 50 year trend starting in that period. The index is defined as the difference between the inflection point and 1850 divided by the square root of the difference beween the start of the calibration period and 1850. (not shown)
- The angle formed by the slope to 1850 and the fifty year trend from the inflection point. This again works best with a flat "handle".
- The inflection point angle weighted by the inflection point index.
Here are the results, comparing MBH 98 and 99 to the cherry picked top 100 HSI pseudoproxies from M&M05:

The twelve point mean is the average of the 12 pseudoproxies used by McInyre (and Wegman) in various illustrations M&M's results. MBH98 PC1 is the first principle component of the reconstruction of 1450-1400 temperatures from MBH98.
As can be seen, MBH98 and 99 are statistically distinguishable from even the cherry picked top 1% of pseudoproxies, with differences in index values never less than 2 standard deviations above the mean, and for one index nearly 10 standard deviations above the mean. MBH98 PC1 does not perform as well, but still can be statistically distinguished from the cherry picked top 1% in 3 out of the five tests. (The Inflection point vHSI shows MBH98 PC1 to be just over two standard deviations above the mean.)
This is still a work in progress. I think I need to improve my vHSIs by making comparisons with the instrumental record rather than the calibration period, and a combination of angle based and standard deviation based vHSI would probably be superior. Further, I should make comparisons with the first principle component of the North American Tree Ring data base.
Never the less, even at this stage the results show that you can devise variant Hockey Stick Indexes that are better able to determine a hockey stick shape, and that if you use those vHSIs MBH98 and 99 stand out as easily statistically distinguishable from PC1s generated from red noise using short centered PCA. Further, those vHSIs are demonstrably superior to that of M&M05 in that at least none of them will mistake a straight line for a hockey stick (except the pure inversion method, which is why it was not shown ;)) So not only did M&M05 use a test with no statistical power, without validating the test; but alternative tests exist which would have refuted their thesis.
The take home is that the first part of M&M05 is simply scientific garbage. It has no scientific merit whatsoever.
When I get around to it, I am going to see if I can develop even better vHSIs, but probably will wait at least till I have a copy of the NOAMER PC1, and ideally until I (or a colaborator) can generate a full set of pseudoproxies without the cherry picks for statistical comparisons. (Help with either would be appreciated.)
- Athabasca Glacier: a tragic vanishing act
Tom Curtis at 19:14 PM on 27 August, 2014A small addition to my preceeding post.
One of the people who has pushed the idea that the finds show the pass to have been warmer in the past is Steve McIntyre, who, did so based on German news reports in 2005.
Meanwhile, scientific papers had this to say:
"During the hot summer of 2003, reduction of an ice field in the Swiss Alps (Schnidejoch) uncovered spectacular archaeological hunting gear, fur, leather and woollen clothing and tools from four distinct windows of time: Neolithic Age (4900 to 4450 cal. yr BP), early Bronze Age (4100-3650 cal. yr BP), Roman Age (1st-3rd century AD), and Medieval times (8-9th century AD and 14-15th century AD). Transalpine routes connecting northern Italy with the northern Alps during these slots is consistent with late Holocene maximum glacier retreat. The age cohorts of the artefacts are separated which is indicative of glacier advances when the route was difficult and not used for transit. The preservation of Neolithic leather indicates permanent ice cover at that site from ca. 4900 cal. yr BP until AD 2003, implying that the ice cover was smaller in 2003 than at any time during the last 5000 years. Current glacier retreat is unprecedented since at least that time. This is highly significant regarding the interpretation of the recent warming and the rapid loss of ice in the Alps."
(My emphasis)
Note that the dating discrepancy between my account above in the abstract quoted in this paper was due to a redating of the oldest remains after this 2007 paper was published.
- Air pollution and climate change could mean 50% more people going hungry by 2050, new study finds
Ashton at 14:38 PM on 10 August, 2014Michael Sweet. Tom Curtis @14 has replied to your condemnation of Steve McIntyre in what can only be described as a very gracious post. You suggest
"Ashton, perhaps you could copy this data to Climate Audit and tell us his reply".
Tom Curtis has done exactly that and has entered into a fairly extensive dialogue with Steve McIntyre that you might like to read. It does appear at the moment to be an unfinished dialogue.
- Air pollution and climate change could mean 50% more people going hungry by 2050, new study finds
Tom Curtis at 09:03 AM on 10 August, 2014michael sweet @9, I cannot accept the thanks, and must revise my condemnation of McIntyre who did look up the relevant data. I have expressed my apology to him at Climate Audit, and will do so again here. McIntyre in fact looked up both the 2008 and 2012 reports from the FAO, and discusses primarilly the change in estimates between them, due in part to a revised methodology in 2012. That change along with changes in estimates of population, population height and dietary energy supply reverse the trend in world hunger from 2002-2007 as previously reported in FAO reports. The turn around is a net change of 53 million between 2011 and 2012, with a further 22 million change between the 2008 and 2011 reports. The change consists primarilly in an increase in estimated hunger in 2002, but with a decline by 35 million in estimated hunger in 2007. Both figures were further revised upwards in 2013, by 38 million for 2002 and and 8 million in 2007 in the 2013 report, while the 2012 figures were revised down by 25 million. (All years are approximate because the FAO does not report for single years, and changes the range of years reported from report to report).
McIntyre did lead of his article with the discrepancy with the 2013 report, which is not something for which the IPCC can be blamed. He also compared the world figures (reported by the IPCC) with the undeveloped nation only figures (shown in the graph above). That did not justify Ashton above not mentioning the rest of his article, nor my unaccountable (except for extreme tiredness) failure to notice it on my first read through.
Finally, McIntyre certainly quotes the IPCC out of context. The IPCC wrote:
"Many definitions of food security exist and these have been the subject of much debate. As early as 1992, Maxwell and Smith (1992) reviewed over 180 items discussing concepts and definitions, and more definitions have been formulated since (Defra, 2006). While many earlier definitions centred on food production, more recent definitions highlight access to food, in keeping with the 1996 World Food Summit definition (FAO, 1996) that food security is met when ‘all people, at all times, have physical and economic access to sufficient, safe, and nutritious food to meet their dietary needs and food preferences for an active and healthy life’. World-wide attention on food access was given impetus by the food ‘price spike’ in 2007-08, triggered by a complex set of long- and short-term factors (von Braun and Torero, 2009). FAO’s provisional estimates show that, in 2007, 75 million more people were added to the total number of undernourished relative to 2003–2005 (FAO, 2008); other studies report a lower number (Headey and Fan, 2010). More than enough food is currently produced per capita to feed the global population, yet about 870 million people remained hungry in 2012 (FAO et al., 2012). The questions for this chapter are how far climate and its change affect current food production systems and food security and the extent that they will do so in the future
(Figure 7-1)."(My emphasis)
McIntyre only quotes the two sentences after the bolded section. Most probably, in the context of the entire paragraph, the first sentence that McIntyre quotes, and that he dissects, is intended to illustrate the "impetus" to "World-wide attention on food access". As such, it is an appropriate citation although the sentence containing it is insufficiently clear. It may also be that the IPCC does not accept FAO revisions which are at odds with other data, a fact that may explain the FAO taking time to respond to criticisms of its index in the 2013 report. Notably, the FAO 2013 writes:
"Moreover, given that both the probability distribution f(x) and the threshold level in (1) are associated with the representative individual of the population – that is, a statistical construct corresponding to an individual of average age, sex, stature and physical activity level – they do not represent, respectively, the empirical distribution of per capita food in the population and a threshold level that is meaningful for any actual individual in the
population."(My emphasis)
The underlined sentence indicates that if, in a given nation, the proportion of food eaten by one sector of the population increases, with a consequent decrease for another portion of the population, this will not be reflected as in increase in hunger in the FAO data. That is significant in that there was a sharp increase in food prices in 2007/8 that is likely to have caused such a shift in consumption habits and may have caused a spike in hunger that is not captured by the FAO methodology. However, while I can see this as a possibility, I do not know enough about the subject to know if it was actually the case, ie, whether the wide spread increase in hunger reported at the time was accurate, or the currently revised figures of the FAO are more accurate.
- Air pollution and climate change could mean 50% more people going hungry by 2050, new study finds
michael sweet at 04:13 AM on 10 August, 2014Tom,
Thank you for looking up the data on McIntyre. It is typical for him to produce shoddy reports and claim others have made the mistakes. Will he audit his own report and rewrite it to reflect the actual data available at the time?
Ashton, perhaps you could copy this data to Climate Audit and tell us his reply.
- Air pollution and climate change could mean 50% more people going hungry by 2050, new study finds
Tom Curtis at 00:57 AM on 10 August, 2014Ashton @4, the IPCC wrote (Section 7.1):
"World-wide attention on food access was given impetus by the food ‘price spike’ in 2007-08, triggered by a complex set of long- and short-term factors (von Braun and Torero, 2009). FAO’s provisional estimates show that, in 2007, 75 million more people were added to the total number of undernourished relative to 2003–2005 (FAO, 2008); other studies report a lower number (Headey and Fan, 2010). More than enough food is currently produced per capita to feed the global population, yet about 870 million people remained hungry in 2012 (FAO et al., 2012)."
I cannot find the FAO document referenced for 2008, but was able to find "The State of Food Security in the World 2008", which writes (2nd Key Message):
"High food prices share much of the blame. The most rapid increase in chronic hunger experienced in recent years occurred between 2003–05 and 2007. FAO’s provisional estimates show that, in 2007, 75 million more people were added to the total number of undernourished relative to 2003–05. While several factors are responsible, high food prices are driving millions of people into food insecurity, worsening conditions for many who were already food-insecure, and threatening long-term global food security."
Therefore the 75 million increase cited for 2007 is an accurate report of FAO figures of the time.
The 2012 citation is to the "The State of Food Security in the World 2012", which states (key messages):
"The State of Food Insecurity in the World 2012 presents new estimates of the number and proportion of undernourished people going back to 1990, defined in terms of the distribution of dietary energy supply. With almost 870 million people chronically undernourished in 2010–12, the number of hungry people in the world remains unacceptably high. The vast majority live in developing countries, where about 850 million people, or slightly fewer than 15 per cent of the population, are estimated to be undernourished."
So, again the IPCC accurately cited FAO figures.
Why, then, the evident discrepancy between the IPCC figures and the "The State of Food Security in the World 2013" quoted by McIntyre and shown in Figure 1 of the report (as posted by McIntyre)?
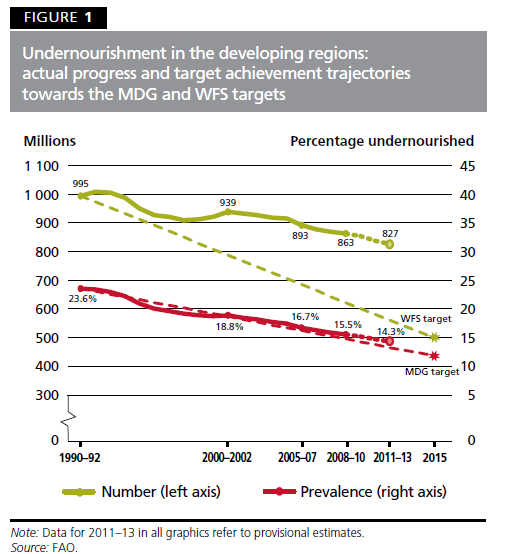
The answer is largely given by showing the equivalent figure from 2012:

If you look at the green line, it is revised upward from a plateau around 900 million in the early twentieth century to show a peak at about 940 million in the later figures. At the same time, the end figures are revised downward. The downward trend McIntyre finds so obvious, therefore, is a result of revision of earlier figures - a revision that had not taken place in the documents to which the IPCC had access. Indeed, even if the IPCC got rid of its policy of looking only at documents available by a certain date (to prevent a process of continuous rewriting and reassessment preventing publication), the revised figures were not published until October 2013, by which time the IPCC report was essentially complete.
There you go, thirty minutes of research and writing time and we find the IPCC mad no errors, but that more recent FAO documents have revised the figures on which the IPCC relied. Too much trouble, apparently, for McIntyre who was content merely to wrongy tarnish the IPCC with shoddy research.
- Air pollution and climate change could mean 50% more people going hungry by 2050, new study finds
Ashton at 19:59 PM on 9 August, 2014Although this may be regarded as heretical, Steve McIntyre at Climate Audit has given a reasoned critique plus the use of appropriate references to show globalyield of most major food crops has steadily increased. The number of under/mal-nourished dropped by 17% between 1990 and 1992 and dropped further from 995 million in 1992 to 827 million in 2013. He notes that there is a significant difference between the IPCC report and the Food and Agricultural Organisation (FAO)of the United Nations with the IPCC reporting an increase of 75 million and the FAO a decrease of 46 million in the global number of the undermourished. The data from the FAO suggest that global undernourishment may not be as severe as previously thought. The URL is www.climateaudit.org
- Brandis confuses right to be heard with right to be taken seriously
Dave123 at 17:25 PM on 7 May, 2014Warren, I'd like to have said I was astonished by your reply, but I found it sadly predictable.
I still believe these are great outcomes but the increasingly outlandish claims of 9m sealevel rise and 6c temp rise by the end of the century and the increasingly absolute belief systems of the AGW lobby (Mann's flawed hockey stick graph, climate gate, It won't snow in London again, the Arctic will be ice free by 2013, etc.etc.) caused me to adopt a contrarian and skeptical view.
As others have noted, the moment you added the "C" to AGW you betrayed a propagandistic stance towards matters. Adding the 'catastrophic' to AGW was simply a branding tactic by a political opposition that had no basis in published work. Your use suggests either you don't know manipulation and propaganda when you see it, or that you are willfully interested in propogating a false meme. Which is it?
Moving on to the hockey stick, I'm not sure what your apparent concession to TonyW means, but in any case you've not made it clear what you think the importance of the hockey stick is. Again, this is a dismissive stance, that isn't about understanding but about something else entirely. To be blunt: do you recognize that Mann's original 1998 work has been replicated and extended by other groups using other proxies and statistical methods? If not, in terms of this debate you're talking about, I and many others here are far more technically competent than you to evaluate the claims and methods: what hope do you have of persuading us? Referring to JoNova? Part of the issue Warren, is that you have to have the technical chops to know when a McIntyre or Nova is simply wrong. If you don't have those skills, like I do, then you can't be a skeptic... you're simply a bystander to something you don't understand.
Moving on then to the disappearance of Artic sea ice in summer, you surely know that one group reported results of 2013-2019. It's one group, reporting a preliminary result, not a consensus opinion and you distort it when you aren't sayig 2016+/- 3 years. It is a perfectly normal and expected part of science for someone to publish a finding of this sort "hey, we tried a new approach and it gave these interesting results". The whole point of this is so that other people can look at the approach, see if they think it is correct. You don't seem to register this part of normal science and instead seem to be taking a legalistic approach of constructing an advocacy case- an approach with no obligation to consider the findings as a whole. So if this is the sort of debate you think is productive, you've probably signed your death warrant as far as being seen as someone who a scientist can have a productive discussion with.
I think the same applies to the "no snow in London" business. AFAIK that was one remark, not published paper, and the modeling results for the UK tend to show the kind of winter England just had. And again it seems that you have a barrister's approach to things- finding one little thing and stripping it of context.
This is what the UK Met office shows these days. Why is it not the story rather than whatever the no snow in London story?
So when you say "increasingly outlandish claims" say for sea level, you ignore the mainstream projections, and take some sort of odd umbrage that outliers in the scientific work exist.
Beyond that you give the appearance of advocating some sort of censorship of worst case assessments. Kerry Emmanual, of MIT (where I got my doctorate) makes a strong case for the importance of including the long tail risks, because leaving them out would be misleading. On my own authority and training (industrial process safety and hazards analysis) I think he's quite right. In my reports to management I certainly included the long tail risks and mitigation strategies.
In toto, I don't think you've provided an example of facts changing your mind, rather you've provided examples of how you get lost in the whole business and can't see the forest from the trees. It certainly doesn't give me any warm feelings on the possibility of rational interchange with the WUWT and JoNova factories, and even further ignores whether these folks or you really matter anyhow.
- Brandis confuses right to be heard with right to be taken seriously
Composer99 at 00:43 AM on 7 May, 2014To elaborate a bit on the characteristics of denialism, and how creationists, climate science deniers, and anti-vaccine activists share them in common, let me provide some examples:
1. Fake or Misleading Experts
Creationism - Ken Ham, Dr Michael Egnor (a neurosurgeon), William Dembski
Anti-Vaccine Activism - Andrew Wakefield, Dr Jay Gordon (*), Dr Vera Scheibner (a micropaleontologist)
Climate Science Denial - Christopher Monckton, Dr Roy Spencer (*), Dr S. Fred Singer (*), Dr Richard Lindzen (*), Ian McIntyre
(*) denotes misleading experts - people with pertinent expertise in the subject (e.g. Dr Jay Gordon is a pediatrician) but who are using their credentials to support or propagate false or misleading information, in the public sphere at least, if not in the literature (e.g. Dr Spencer and the Cornwall Alliance). (Some creationists I have named above might be misleading experts; but I'm not familiar enough with them to say so.)
2. Cherry-Picking & Misrepresentation
Creationism - claims about radiocarbon dating, this article showing distortion of so-called "No Free Lunch" algorithms, claims about the eye, or flagellum, making Charles Darwin out to be a proto-eugenicist, etc.
Anti-Vaccine - Wakefield's (retracted) 1998 Lancet paper (I don't recall seeing that one get trotted out as much since its retraction), some rubbish papers by Laura Hewitson et al (also retracted), claims about various ingredients in vaccines (formaldehyde, aluminium, etc.), the "Fourteen Studies". I could go on - maybe search the vaccine topic thread on Science-Based Medicine for some more examples.
Climate Science Denial - the "pause" in global warming (cherry picking a small portion of the surface temperature record while ignoring the behaviour of 95+% of the climate system), the obsession over outdated papers (Hansen et al 1988 and Mann et al 1999), Anthony Watts' "surface stations project".
3. Logical Fallacies
Creationism - false dichotomy (either their misrepresentation of evolutionary processes must be true, or God/an "Intelligent Designer" did it), ad hominem or similar argument (e.g. accepting evolution leads to the Holocaust, courtesy of Ben Stein).
Anti-Vaccine - ad hominem (what Dr David Gorski calls the "pharma shill gambit"), red herrings (appeals to the issues surrounding thalidomide, Vioxx, or, say, the Tuskegee experiments).
Global Warming Denial - ad hominem (pretty much whenever Al Gore or David Suzuki's names come up), strawman argument ("CAGW"), appeal to popularity (here's a good example, or you could bring up the Orgeon Petition), guilt by association (Donna Laframboise's book about the IPCC).
4. Conspiratorial Ideation
Creationism - In Expelled, Ben Stein alleges that the scientific community conspires to ruin the careers of those who express any doubt in the "scientific orthodoxy of Darwinism" (quotes used to denote sarcasm, not direct quote). Especially religious creationists are liable to discern the influence of Satan or other supernatural forces of wickedness in the widespread acceptance of evolution among biologists.
Anti-Vaccine - One activist, Jake Crosby, is famed for trying to playing "six degrees of separation" to try and tie pro-vaccine advocates to pharmaceutical companies. Conspiracy theories are also called upon to explain why public health departments & researchers would continue to support vaccination programs despite the alleged harms of vaccines.
Global Warming Denial - The allegations that the UEA-CRU hack exposed fraud, or that the subsequent inquiry findings were whitewashing. Any time the claim is made that climate scientists are engaged in a hoax or fraud for the purpose of securing grant money. Any time the claim is made that climate science is part of a wider "eco-fascist", "Marxist", or what-have-you plot to establish despotism.
5. Impossible Expectations/Shifting Goalposts
Creationism - I'm not as well-read on creationist tactics on this front, but I understand that creationists have made a big fuss about lack of certain transitional forms, or even set up impossible expectations for what sort of transitional forms might be found (e.g. the "crocoduck"). The shift to "Intelligent Design" as the primary public vehicle of creationism is a goalpost shift.
Anti-Vaccine - Despite its unethical nature, many anti-vaccine activists call for a double-blind trial of vaccinated and unvaccinated populations. Anti-vaccine activists occasionally demand 100% certainty of the safety or efficacy of vaccines. I have personally had an anti-vaccine commenter demand that science either develop the capacity to predict who would be harmed by vaccines (an impossible expectation at present).
Climate Science Denial - The "quantum" behaviour of denial as recently discussed on Skeptical Science is a perfect example of shifting goalposts. A good example of impossible expectations would be Judith Curry's "Uncertainty Monster", or similar claims that we just need to do more research for a few more years/decades before we can make policy decisions (because it's all so uncertain).
- Cherry picked and misrepresented climate science undermines FiveThirtyEight brand
Andy Skuce at 03:06 AM on 30 March, 2014i recommend that people read the addendum to a recent RealClimate piece, where Stefan Rahmstorf shows how gentlemanly Pielke was in a discussion over the Russian heat wave paper.
Steve McIntyre also claims to be a gentleman over at Climate Audit, at least in a Wildean sense. Judith Curry also talks admiringly about the wave of "gentleman scientists" who doubt the seriousness of climate change.
There seems to be a lot of it about.
- 2014 SkS Weekly Digest #3
Tom Curtis at 14:12 PM on 21 January, 2014Poster:
1) Steve Goddard shows that there is a temperature difference between USHCN v1 and USHCN v2. As both use essentiall the same raw dataset, it follows that the difference is due to come change in adjustments. Steve Goddard then asserts an explanation for the change in adjustments, ie, fraud. He did not survey the literature on the subject. He did not itemize the differences in adjustments between the two. He did not examine the difference between raw and adjusted records at sample sites to identify the reason for the difference. In fact, he presented no evidence whatsoever in support of his hypothesis beyond the original fact it was intended to explain.
As a PhD scientist, you therefore know that he has not supported his opinion in any relevant way. So why are you presenting his opinion as interesting? And given that he has not supported his opinion, pointing out that he has a history of unsupported and ridiculous hypotheses is a relevant rebutal. There is no need to rebut his detailed arguments because he has not made any.2) I find Steve McIntyre's article interesting, in that I once raised with him the issue as to why his "audit" of climate science was so one sided. Why he audited Mann, and Jones, and Briffa, and Marcott etc in such obsessive detail, but never bothered auditing the Salby's, the Morner's, the Easterbrooks, etc. His reponse was that he only auditted things that were likely to make it into the IPCC. His article on Turney, therefore interests me in that it gives the lie to his excuse. Or do you claim that the trapping of the Akademik Shokalskiy in ice is likely to merit a paragraph in the next IPCC report?
- 2014 SkS Weekly Digest #3
Daniel Bailey at 12:59 PM on 21 January, 2014Model data and codes are openly available, and have been for some time:
http://www.realclimate.org/index.php/data-sources/#GCM_code
Note that the Muir Russell Commission was able to do a full global reconstruction from the raw data linked to from the above page, WITHOUT ANY CODE, in a mere 2 days (when asked, they replied "any competent researcher could have done the same).
The Auditors over at McIntyre's Climate Audit have been struggling with their "audit" reconstruction for years now.
- 2014 SkS Weekly Digest #3
scaddenp at 12:45 PM on 21 January, 2014Poster, if someone was wondering about quackery with say a "provocative urine test", as an endocrinologist, would you suggest someone looks up anonymous blogs with Doctor Data funding it; or look up material by written by endocrinologist with a long publishing record and reporting on a consensus position?
As to McIntyre, he has a long record of being long on innuendo and short of actually publishing much which he is quite capable of doing. He writes well and impresses with his even tone. However, you might like to look at this example of manipulating the message. Perhaps if he spent more time on science than on reading other people's email, then he might accord more respect. It would be wonderful if he used his "auditing" skills on the bunkum put out by pseudo-skeptics but casting aspersions on working scientists is more his thing.
- 2014 SkS Weekly Digest #3
Poster at 11:28 AM on 21 January, 2014The comments made here do not surprise. (-snip-). I am surprised that anyone who has supervised graduate students has not learned that some people are not worth reading", I had never heard of Steve Goddard or Real Science until yesterday, had absolutely no knowledge of him or his blog so had no idea whether or not he was worth reading. If you're not immersed in a particular topic (and mine is steroid endocrinology not climate science) you don't know the credibility of a writer until you've read his/her work and has sought comment from those that are familiar with that work. I've done that here but on balance, excepting of course Rob Painting @2, I rather wish I hadn't as no one really likes to be insulted and the oblect of condescension.
That said, and in the context of this blog as I've seen something, I should say something, I've just read an interessting article on the Chris Turney expedition to the Antarctic (tinyurl.com/l7jmgz5) by Steve McIntyre at Climate. I've read a lot of stuff from him and find his explanations are generally clear, seemingly unbiased and credible. But what are the view of the experts? Is he also considered a charlatan at SkepticalScience?
- Why is Antarctic sea ice growing?
scaddenp at 06:29 AM on 18 December, 2013Besides papers pointed to above, I would also add the indirect evidence of ice-loss from both GRACE and altimetry. Steig et al 2009 and the O'Donnell et al 2010 (co-author one S McIntyre) show positive warming from weather stations on the coast, so I wonder about your source for coastal weather stations showing no warming? I would also note the tropospheric trends from Screen and Symonds 2012.
However, for the matter of sea ice, it is the SST data that provides the interesting question.
- Double Standard on Internal Variability
CBDunkerson at 20:10 PM on 27 October, 2013And this is the problem... there is a segment of the population for whom complete nonsense is automatically held to be 'good science' if it states what they want to believe. There are still many people who think, 'McIntyre proved that PCA always produces a hockey stick shape'.
Similarly, people otherwise capable of basic reasoning somehow lose the ability to understand the simplest concepts of statistical analysis (e.g. 15 year trends in lower atmospheric warming a few years apart give radically different results, ergo these trends are obviously too short to be indicative of the long term impact) when there is any 'refutation' at all... no matter how meaningless.
Too much credit is given to the few skeptics capable of performing actual scientific analysis... because none of their science supports the nonsense they spread. The fact that Pielke senior, Curry, Lindzen, Christy, Spencer, Muller, and various others have conducted actual scientific research with valid methodologies and repeatable results does not excuse the fact that they have also made blatantly false statements to advance various beliefs which they cannot substantiate scientifically. After someone at the LA Times said that they don't print letters from climate 'skeptics' containing false information various other papers stated their policies. The Denver Post stated that the matter is still in doubt and it would be "editorial arrogance" to dismiss the views of "properly credentialed experts" like Spencer and Curry. The quotations from these two are particularly galling because Spencer's is outright false and Curry's deliberately misleading;
http://www.denverpost.com/carroll/ci_24333316/carroll-one-truth-global-warming
The fact that these sometimes scientists have not been sufficiently called out and denounced for their false claims means that they will continue to be given equal (or greater) time by many segments of the press and provides cover for the Tisdale's and Watts's to push climate denial into the realm of fantasy and nonsense.
- Scientists tried to 'hide the decline' in global temperature
scaddenp at 11:12 AM on 27 October, 2013Ironbark, if your impression of climategate emails is based on solely on emails as reported by the misinformation crew, then you are missing some interesting information - like how the misinformation/disinformation sites manipulate you. You might want to check out about:
Selective editing of the emails to cast them in a different light
and strangely omitted emails that provide context. The links allow you to check blog posts against the emails so you can see that there is no further wool being pulled over your eyes.
How do feel about being manipulated like this?
- Why Curry, McIntyre, and Co. are Still Wrong about IPCC Climate Model Accuracy
Tom Curtis at 20:35 PM on 16 October, 2013SASM @165, unfortunately, I do not think you understand my position. In particular, I was not criticizing your choice of baseline on the basis that it makes the observations look cool. On the contrary, a 1990 baseline makes the observations look warm. The emphasis on that point is so that my allies pick up on the fact. Intuitively, we would expect a 1990 baseline to cause the observations to look cool, for 1990 is a local high point in the observations. However, that is not the case, for though the observations are warm, the ensemble mean is warmer still relative to adjacent years. Thus, if anything, a 1990 baseline is favourable to a defence of the validity of models.
But it is still wrong.
It is wrong, basically, because you have to analyze the data as you motivated me to do to know whether it is favourable, unfavourable or neutral with regard to any position. The only way to avoid that necessity is to use a long (thirty year) baseline so that the baseline is robust with respect to time period used. Ideally, we should use the long baseline that minimizes the Root Mean Squared Error (RMSE) between the observation and the ensemble mean. By doing so, we ensure that any discrepancy between observations and ensemble are real, ie, are not artifacts of an ill chosen baseline.
The impact of short baselines is shown by KR's graph @164. The UAH temperature record is far more sensitive to ENSO fluctations than any surface record. As a result, the inclusion of the strong El Nino of 1983 in a short baseline period artificially displaces the UAH record downwards with respect to HadCRUT4 (and both HadCRUT4 and UAH downward with respect to the ensemble mean).
The crux is this: Spencer (and you and McIntyre) have created graphs to illustrate the relationship between observations and models. Yet all of you have adopted non-standard conventions, the effect of which is to show a greater disparity than actually exists. This is achieved by three different methods in the three cases (and I have only discussed Spencer's method so far), but is the case none-the-less. Now, to the extent that you intend an honest comparison, you would avoid any method that might accidentally result in showing a greater disparity (if that is what you are trying to demonstrate). Short term baselining is a method that will have that effect. When it is adopted to compare data with known large differences in variance (as, for example, HadCRUT4 and UAH) it is scientific malpractice. It is, not to put to fine a point on it, the sort of thing I would expect from a person who uses a known faked Time magazine cover to establish a rhetorical point, and who refuses to take it down, issue a correction or acknowledge the fault when corrected by others.
I expect better of you than of Spencer. I expect you to at least acknowledge that the use of short baselines is bad practise, and should not be done for purposes of illustration nor in attempting to establish whether or not the observations have fallen outside the predicted range.
- Why Curry, McIntyre, and Co. are Still Wrong about IPCC Climate Model Accuracy
StealthAircraftSoftwareModeler at 01:37 AM on 16 October, 2013Tom Curtis @159: Thanks for the quality posts. If we’re ever in the same town I’d like to buy you a beer or three. I might disagree with you on a few things, but I do appreciate your cogent and respectful posts.
You have drawn another nice chart. I think all of the charts discussed, including your current one, the one I’ve drawn @117, the one drawn by Spencer (http://www.drroyspencer.com/2013/10/maybe-that-ipcc-95-certainty-was-correct-after-all/), McIntyre’s (http://climateaudit.org/2013/10/08/fixing-the-facts-2/) and the two at the top of this page are all basically the same. They show model projections and the temperature data. Dana asserts that IPCC AR5 Figure 1.4 draft (his left chart at the top) was a mistake or has errors, but is now clear to me that it does not have any errors. The draft version (Dana’s left chart) from the IPCC matches the final draft version (Dana’s right chart), it’s just that the IPCC’s final version is zoomed out and harder to see.
This thread has discussed that initial conditions and boundary conditions are important, and using trend lines is important, but I disagree. Plotting model projection lines along with temperature data (not trend lines) much the way I have done, Spencer has done, McIntyre has done, is completely reasonable and meaningful. After all, this is the way the IPCC has drawn the chart in its final draft version (Dana’s right chart).
No matter how you slice it, the global temperature data is running at the very bottom of model projections. I think that falsification of model projections is near. If it temperature continues not warm for another 15 years as theorized by Wyatt’s and Curry’s Stadium Wave paper (http://www.news.gatech.edu/2013/10/10/%E2%80%98stadium-waves%E2%80%99-could-explain-lull-global-warming) then it will be obvious that climate models are inaccurate and falsified.
- Why Curry, McIntyre, and Co. are Still Wrong about IPCC Climate Model Accuracy
KR at 23:51 PM on 7 October, 2013Tom Curtis - Very clear reply to SAM, thank you.
Cynicus - As Tom Curtis pointed out, McIntyre is only using the HadCRUT4 data, which is notably missing polar areas with higher temperature trends. A comparison between global model trends and not-global observations is inaccurate unless the model data is masked to the same extent - and I see no sign that McIntyre has done so.
McIntyre has not shown the real distributions over the model runs, de-emphasized natural variability, compared masked observations with unmasked models, on and on and on. He has not made his case. Far from his claims - Observations continue to validate the models.
- Why Curry, McIntyre, and Co. are Still Wrong about IPCC Climate Model Accuracy
Tom Curtis at 22:45 PM on 7 October, 2013Cynicus @84a, how has he fudged it? Let me count the ways:
1) To start with, only 42 models were used to explore the RCP 4.5 scenario. With 13 named models in the box plot, that leaves 29 singletons. In turn that means that there are only 80 model runs by those 13 models, or an average of 6.15 model runs each. If your thinking it's a bit of a statistical stretch doing a box plot on just six data points, you are right. It is worse than that, for while some models such as the CSIRO Mk3 have all of 10 runs, others such as the CESM-CAM5 have only 3 runs. The CESM-CAM5 still gets its own little box plot, with median, 25th and 75th percentiles, and the 90% range whiskers all of its own, and all of just three runs. That is a bit of a joke statistically. In fact, even the CSIRO Mk 3, with its box plot and whiskers based of 8 runs, plus two outliers (I'm cracking up here) is essentially meaningless statistically. McIntyre had too few samples to make any statistically meaningful claims about individual models, and he knew it. More importantly, the restricted range of the 90% range reflects only the very few samples rather than being a real indication of the variability to be expected from the model.
That means the only meaningful statistic in the entire figure is the box plot coloured gold on the right, ie, the full ensemble.
2) McIntyre compares with only HadCRUT4. HadCRUT4 excludes some of the fastest warming regions in the world. Most notably the Arctic, but also large sections of north Africa, the middle east and areas north of India. Curiously those later areas are where most of the 19 nations that set new national temperaturerecords in 2010 are located. Therefore we know that HadCRUT4 understates the actual trend in GMST, although we don't know exactly be how much. (GISS, in constrast, may either overstate or understate it.) Therefore, absent the use of a HadCRUT4 mask (almost impossible to set up on the KNMI explorer), we know the HadCRUT4 record understates the trend in that period. A reasonable estimate of how much it understates it by is 0.1 C/decade.
3) As can be seen in the graph @69 above, using a 1979 start point introduces a significant negative trend to observed temperatures due to ENSO fluctuation. This is exagerated in the HadCRUT4 record because it includes most areas affected by ENSO, but excludes many areas that are not. Absent this effect, the observed record would be about 0.1 C higher.
If we ignore the nonsense about doing box plots for models with just three samples, the comparison is interesting. There is nothing wrong with making such comparisons, provided you are aware, and make your readers aware, of potentially misleading aspects of the comparison (as in points (2) and (3) above). Further, even using GISTEMP, or an ENSO adjusted GISTEMP, it is likely the observed trend would still have fallen between the 75th and 90th percentile of model trends. The CMIP5 models do run hot relative to observations. Just not as hot, perhaps, as is suggested by the comparisons with HadCRUT4 (unless it is ENSO adjusted, and the models have a HadCRUT4 mask applied).
- Why Curry, McIntyre, and Co. are Still Wrong about IPCC Climate Model Accuracy
cynicus at 20:48 PM on 7 October, 2013In an earlier post McIntyre als showed a box-plot from 1979-2013 that suggest that the trend in the AR5 models run significantly 'hotter' than the observed temperature trend (HADCRUT4) over the same period.
The box-plot:
I notice this boxplot don't include the uncertainty in the HADCRUT4 trend, which included (using the SkS trendcalculator) shows that the uncertainties overlap (0.158 ±0.044 °C/decade (2σ)), thus may in fact be the same trend afterall. Is there more to critique? Thanks.
- Why Curry, McIntyre, and Co. are Still Wrong about IPCC Climate Model Accuracy
Klapper at 12:04 PM on 7 October, 2013@Tom Curtis #72:
You pre-empted my next post somewhat since I was going to agree the 1990-1992 to 2006/now trends didn't prove much other than the models overcool during major volcanic episodes and we should instead focus on McIntyre's 1979 to 2013 model vs observations analysis. Since you've basically done the analysis from 1975 showing the same thing as McIntyre we can skip the argument of whether the models run too hot or not.
Now we can discuss the significance of the models running too hot. I think the models run too hot since they have tuned their feedbacks to radiative forcing during only the warm phase of ocean cycles. (-snip-).
(-snip-).
I'll leave the discussion of Figure 1.4, the politics and personalities of global warming to others (for today anyway).
- 2013 SkS Weekly Digest #40
Jim Eager at 10:25 AM on 7 October, 2013First, the difference between what the models predicted and observed temperatures is not "huge", as observed global mean temperature has been well within the projected range of the model ensembles. Try reading the approriate post: skepticalscience.com/curry-mcintyre-resist-ipcc-model-accuracy.html
Second, that observed global mean temperature has been in the lower portion of the projected range of the model ensembles has been due to natural variability, e.g. 1) a string of neutral or relatively strong la nina years and the total absence of a strong el nino year, and 2) an unusually deep and long solar minimum and unusually weak solar max. - Why Curry, McIntyre, and Co. are Still Wrong about IPCC Climate Model Accuracy
Albatross at 09:08 AM on 7 October, 2013Klapper,
You admit then that your posts are essentially off topic, especially those referring to McIntyre's blog posts. Let us focus on the actual post above.
1) Do you agree that Curry's claims quoted above were incorrect for the reasons stated?
2) Do you agree that the initial problem with the draft figure 1.4 for AR5 has now been corrected?
3) Do you agree that McIntyre's and Mckitrick's accusations of foul play regarding figure 1.4 are incorrect?
We'll take it from there. Right now I have to be somewhere for the evening with friends and family.
- Why Curry, McIntyre, and Co. are Still Wrong about IPCC Climate Model Accuracy
Klapper at 08:28 AM on 7 October, 2013@Albatross #60:
"...But that rate is for CMIP3 not CMIP5..."
I checked my work on the CMIP5 SAT warming from 1990 to mid 2013 for the model ensemble for the RPC45 scenario and the rate is 0.29C/decade. The data I downloaded the first pass were the "One run per model tas rpc45". I also checked the "all runs per model tas rpc45" but the number is the same at 0.29C/decade. Of course 2013 is not done yet and I wanted to compare apples to apples so my comment references the mid year since both CMIP5 and HadCRUT4 are available monthly.
I think CMIP3 is for 4AR not TAR as you suggest. My point in #36 was to check the most recent data (5AR) against what Tamino had done for FAR, SAR and TAR. As for your comment on "...Then one should be using a common baseline.." that is not applicable to the comparison of linear regression trends which only compare the rate of change not the absolute averages.
Both you and Rob Honeycutt have confused my references to McIntyre's work as something to do with his recent post on the 1990 baseline issue. My references to McIntyre relate to his earlier "2 minutes to midnight" post and the analysis comparing CMIP5 model experiments to the observational trend. If you think there is something wrong with his comparison of 1979 to 2013 trends, models to observations, then what is it?
- Why Curry, McIntyre, and Co. are Still Wrong about IPCC Climate Model Accuracy
Albatross at 07:17 AM on 7 October, 2013Just a point of clarification. Of course, my reference to the baseline is with respect to McIntyre's and McKitrick's confusion about the draft figure 1.4 in AR5.
Hey that reminds me, since you are such a fan of Steve and Ross, maybe you could ask them who leaked the draft report, and if they do who that person was. Thanks.
- Why Curry, McIntyre, and Co. are Still Wrong about IPCC Climate Model Accuracy
Albatross at 07:11 AM on 7 October, 2013Klapper @36,
Following your posts is like playing a game of find the pea under the thimble. Talk about obfuscation ;)
You agree though that the observations lie within the envelope of possible model outcomes. Good. So I'm not sure why you wish to keep arguing moot points.
That said, there is obviously something wrong with your calculated trend in your post. The maximum rate of warming for TAR for 1990-2012 comes in at near 0.29C/decade. But that rate is for CMIP3 not CMIP5. Anyhow, your rate is clearly way too high. If one's calculation is an outlier it is time to consider that your result is the one that is most likely in error. You also say you have calculated the rate through 2013, a little odd given that the year is not done yet ;)
Regardless, you and McIntyre are not evaluating the model output correctly. First, and foremost you should be only comparing those gridpoints at which one has both observations and model output. Then one should be using a common baseline; a term and concept that McIntyre does not appear to understand except when attack scientists Marcott et al., ironically the choice of baseline period was then central to his whole uncertainty argument ;) Also, ideally you evaluate the models when they have been driven using the best estimates of the observed forcings.
Last, but not least, the ensemble mean model estimate can be misleading and is not necessarily the best metric to use for evaluating the models.
Oh well, at least while Steve McIntyre is very busy trying to figure out what a baseline is (allegedly) he is not attacking, smearing and stalking climate scientists :) Small blessings.
- Why Curry, McIntyre, and Co. are Still Wrong about IPCC Climate Model Accuracy
Klapper at 06:34 AM on 7 October, 2013@ Rob Honeycutt #57:
My references to the trends calculated by McIntyre are from his "2 Minutes to Midnight" post, not the one on Figure 1.4. He calculates the SAT warming trend for multiple runs of different CMIP5 models and then all 109 runs and compares them against the actual warming trend in a "box and whiskers" plot. It seems a reasonable approach to comparing the models to observations to me.
- Why Curry, McIntyre, and Co. are Still Wrong about IPCC Climate Model Accuracy
Klapper at 06:30 AM on 7 October, 2013@ Rob Painting #55:
We are not comparing observation trends vs. model trends since 2000 are we? The data since 2000 are only relevent to longer trends starting in 1979 or 1990 if they represent a longer term secular trend in the impact of aerosols. We know from the Solomon et al 2011 paper the impact might be -0.1W/m2. That's not significant for the longer term trends that McIntyre compared where the CO2 forcing was 8 times that magnitude.
If you can make a point there is a long term trend in the background of the impact of aerosols, that the models don't capture, then put if forward. If the background aerosols in the '80s were no different than the last decade, then the net impact on an observations trend spanning the last 30 years is probably nil.
- Why Curry, McIntyre, and Co. are Still Wrong about IPCC Climate Model Accuracy
Rob Honeycutt at 05:30 AM on 7 October, 2013Klapper... The difference here is that McIntyre/Tisdale are doing a lot of hand waving and Tamino is actually testing the claims with analysis.
The point is quite clear that 1990 is an anomolous warm year in the trend. Anyone honestly interpreting the data would look at that simple explanation and conclude that it would be better to use a longer term baseline.
It's just fascinating to me how people like McIntyre and Tisdale will scream at the top of their blogger lungs about tiny nuances in climate science they find objectionable, but they completely ignore when someone shows them missing such simple points.
- Why Curry, McIntyre, and Co. are Still Wrong about IPCC Climate Model Accuracy
michael sweet at 01:53 AM on 7 October, 2013Tamino got a high warming when he cherry picked the start date. Deniers currently pick the strongest El Nino of the 20th century as their start date, obviously as much a cherry pick as Tamino's. It is up to you to provide data to support your cherry pick.
Please provide a citation to your bullshit number of 0.43C/decade. Your claim of 30 years of errors that I previously cited is also bullshit. Provide a peer reviewed reference to this wild claim or withdraw it. Provide a link to McIntyres peer reviewed analysis. The OP shows using peer reviewed data that the IPCC has been accurate, you must provide links that support your wild claims in the face of this peer reviewed data.
When you make claims that are directly contradicted by the peer reviewed data in the OP and you provide no citations you are comparing your unsupported opinion against peer reviewed data. That has no place in a scientific discussion. Although the denier blogs encourage unsupported argumentation, this is a scientific blog. You must provide links to peer reviewed data or you are dealing in bullshit. If you link to a non-peer reviewed blog it will carry no weight in a scientific argument.
- Why Curry, McIntyre, and Co. are Still Wrong about IPCC Climate Model Accuracy
Klapper at 00:06 AM on 7 October, 2013@ michael sweet #50
I'm not sure which Tamino graph you are referring to but the second Tamino graph does not compare observations to the models, which is the point of discussion here. The second Tamino graph compares one observation trend vs a second observation trend.
Taminos choice of a random trend starting in 1992 and going to 2006 (the red trend line) is a very poor one if you want to demonstrate the validity of the model predictions against the observations. His intent was to show a "hot" trend in the observations, hence he started the trend in the Pinatubo global temperature slump.
So he got a very warm 15 year trend in the GISS dataset, 0.29C/decade to be exact. However the SAT trend in the latest model experiments, the CMIP5 ensemble, is even warmer, substantially so at 0.43C/decade over the same period. I think the reason for the extreme warming trend in the models 1992 to 2006 is mostly that they overcool in the episodes of major vulcanism, and in this particular interval, starting as it does in one, the temperatures at the start of the model run are too low accentuating the warming rate.
As for your claim that my numbers are "bullshit", be specific as to which of them are wrong. McIntyres choice of a trend period 1979 to 2013 to compare model trends vs observations should be above reproach since the period is 34 years, above the defined 30 year length needed to capture the climate signal. My analysis of the 1990 to 2013 period using CMIP5 (5AR) was just to compare to the above FAR, SAR, TAR graph of 1990 to now.
- Why Curry, McIntyre, and Co. are Still Wrong about IPCC Climate Model Accuracy
Klapper at 23:20 PM on 6 October, 2013Rob Painting @#50
McIntyre analyzed trends in the models from 1979 to 2013, a period over which the theoretcial forcing from increasing CO2 is about 0.8Wm2. If you believe stratospheric aerosols have played a role in suppressing warming in the observations, then ask yourself: What is the secular trend in aerosols over that period? (if any). Looking at Solomon et al 2011's Mauna Loa charts there is no secular trend in background transmission values from the late 70's to now. If there is no secular trend in background stratospheric aerosols over the analysis comparison period, then that can't be the reason for the difference between models and observations, no matter how strong the effect of aerosols.
The other point is that the observations are less responsive than the models to stratospheric aerosols if we compare the response of the observations to El Chichon and Pinatubo to the models, global SAT-wise. So not only is there no secular trend in background stratospheric aerosols, but they don't seem to have any more leverage over SAT in the real world than the model world.
- Why Curry, McIntyre, and Co. are Still Wrong about IPCC Climate Model Accuracy
Leto at 17:45 PM on 6 October, 2013Stealth@39
I have no dispute with the text of this post, but I agree that the colour bands of the right-hand graphic in the original post are not particularly clear. I suspected that the graph had been truncated to allow the two graphs to be placed side-by-side, and found a more complete version at Climate Audit:
climateaudit.files.wordpress.com/2013/09/figure-1-4-final-models-vs-observations.png
(The CA post has nothing else to commend it, by the way. McIntyre does not seem to understand the need for an appropriate baseline; he does not argue against the new choice of baseline, just skirts around the issue. Search his post for the word 'baseline' and you will not even find it.)
Dana, could the original post please be modified to include the right-most legend of the draft-final version, where the different projection bands are shown without the confusing overlap?
- Why Curry, McIntyre, and Co. are Still Wrong about IPCC Climate Model Accuracy
Klapper at 01:27 AM on 6 October, 2013@ #37 Rob Painting:
The CMIP5 models use actual inputs up until 2005 as far as I know.These model experiments only started 2009 so the RCP runs had no reason not to use actual data up until 2005. There have not been any major volcanoes since Pinatubo so I don't think that is a relevant issue to the "hiatus".
Steve McIntyre graphed some CMIP5 model trends of SAT from 1979 to 2013 with a box plot (against the HadCRUT4 trend over the same period). Considering the lower bound error bar on the box with all model runs (109 in all) barely overlaps the HadCRUT4 trend, it seems the models are biased warm and this is over a period where the main warming took place and the models are using mostly actual inputs for aerosols and CO2.
- Why Curry, McIntyre, and Co. are Still Wrong about IPCC Climate Model Accuracy
Rob Honeycutt at 03:42 AM on 5 October, 2013Bob... Tisdale randomly dismisses Tamino's point, that was clearly accepted by the IPCC as being correct, that it is not proper to baseline on a single anomalous year.
This is exactly the problem with "leaked" versions of a draft paper. Those who are so mentally inclined, like Tisdale, McIntyre and others, are going to divine nafarious intent where there is none.
Tisdale also lacks the capacity to do actual statistical analysis to show his point, something that Tamino is capable of doing and, in fact, did.
- Why Curry, McIntyre, and Co. are Still Wrong about IPCC Climate Model Accuracy
Albatross at 01:14 AM on 5 October, 2013Hi Chris @11,
Well yes of course, but you seem to be missing couple of key points:
1) Generating thes complex graphics takes time and to get it right almost always requires several iterations. To expect otherwise is just not being reasonable.
2) Keeping #1 in mind, note that the draft figure was stolen/leaked (probably by fake skeptic) almost a year before the release of AR5. So it is not surpring that it had a glitch.
The lesson to be learned here Chris is that one simply cannot trust fake skeptics to act in good faith or with good intentions. They will mislead and misinform at every opportunity. As a case in point, ompare for example how statistician Tamino dealt with the situation when it was brought to his attention, compared to say how McKitrick and McIntyre and Curry dealt with the situation.
- Why Curry, McIntyre, and Co. are Still Wrong about IPCC Climate Model Accuracy
Dikran Marsupial at 19:29 PM on 4 October, 2013bouke, it is because the models do a much better job of modelling changes in response to forcings than in terms of absolute temperature (i.e. there are more or less constant offsets in absolute temperature between model runs). For climate change research it is the response to a change in the forcings that is of interest, so the simplest thing to do is to apply the baselining procedure to eliminate these meaningless offsets. Note also that if you want to perform a comparison involving both surface and satelite observations you have to look at the anomalies anyway as there is a big difference between absolute temperature at the surface and in the trophosphere due to the lapse rate.
This is something well known to any climatologist that has worked with model output and is essentially uncontraversial, so it is somewhat surprsing that Curry and McIntyre are making a fuss about it.
- IPCC model global warming projections have done much better than you think
KR at 03:24 AM on 3 October, 2013MarkR - Regarding the McIntyre link and the draft Fig. 1.4 discussed, that figure showed the range of projected model trends +/- observed HadCRUT temperature 2σvariability, not +/- the model variability.
Models are currently running high - and seven years ago, as Tamino points out, they were running low. However, the periods for which they have been high or low with regards to observations are too short for statistical significance.
- IPCC model global warming projections have done much better than you think
MarkR at 01:51 AM on 3 October, 2013Bob @3
I checked through the McIntyre link but can't find the full description of the simulation setup. It appears to be a single run from 1900 onwards, with known forcing data until 2000 and then RCP forcings after.
Generally, GCMs generate their own natural variability, like El Ninos. An individual model might be in La Nina or El Nino or neutral in any one year, but the ensemble average tends to be equivalent to a 'neutral' year. Similarly for other sources of natural variability.
If you match up a single year against the ensemble averge, then you can effectively shift the temperatures by any amount you want, just by artificially selecting your start year.
In the worst cases of the 97/98 El Nino you could shift your temperatures up or down by 0.4 C. That's why baselining is typically done over a longer period over which the natural 'noise' averages closer to zero.
Alternatives would be to initialise the model with the 'real' climate state at the start point, or to only select those models which match the most important 'real' states, but these are time consuming and/or cause you to lose data.
- IPCC model global warming projections have done much better than you think
dana1981 at 00:34 AM on 2 October, 2013Bob @3 - McIntyre adds nothing of value whatsoever. His post is basically "I don't understand why the data shifted up." Ever heard of proper baselining? Just goes to show that Tamino is 10 times the statistician McIntyre is, as Tamino figured this out 10 months ago. Also, if you're confused about the proper baselining, then compare the trends! It's easy for a graph to be visually misleading, but the trends don't lie. I literally see nothing of value in McIntyre's post.
franklefkin @4 - as I noted, the fact that climate models don't accurately predict ocean cycles in the short-term is not particularly relevant. We're not especially concerned about climate change in 2020, we're concerned about climate change in 2050 and beyond.
- IPCC model global warming projections have done much better than you think
KR at 22:56 PM on 1 October, 2013fretslider - Astounding. You make claims of data distortion by linking to a figure that has in fact been airbrushed and reworked to remove critical data.
Even with the incorrect 1990 baselining, the draft figure 1.4 (seen here) includes a light grey region that shows the range of model variations and the uncertainties in temperature measurements, the expected range around model means due to natural variation. Observations are well within those bounds. McIntyre's reworked figure that you point to above lacks the range of model variations, showing only the range of model ensemble means - see denial tactic #2 in the opening post.
That reworked McIntyre figure (along with other 'skeptics' like Patrick Michaels in Forbes, who edited the figure captioning and falsely claimed: "The very large grey zone is irrelevant to the forecasts that were made") is a clear distortion. I would go so far as to say it is a demonstrable lie about the science on McIntyre's part. Don't be fooled.
- Recursive Fury: Facts and misrepresentations
KR at 23:57 PM on 23 September, 2013Phronesis - The majority of the Climate Audit posts on LOG12 that I have read (or rather, endured reading, as they are rather nasty) consist of speculative slander about Lewandowskys motives (for example, posts entitled "Anatomy of the Lewandowsky Scam", "Lewandowsky’s Fake Results", or lines like "... Lewandowsky’s tainted methodology – a methodology that relied on fake data to yield fake results"), claims that the data was trashed by scammed responses (no evidence thereof, mind you), and various conspiracy theories regarding how the surveys were distributed.
In his Trying (Unsuccessfully) to Replicate Lewandowsky post, McIntyre makes several errors that are apparently due to his unfamiliarity with exploratory factor analysis (EFA). These include inappropriate eigenvalue selection (using two factors instead of the one significant eigenvector) and use of the default 'R' language rotation that redistributes variance - useful in PCA, but inappropriate in EFA when you want to attribute those components back to the survey questions. This is discussed at some length by Oberauer and Lewandosky, laying out McIntyre's errors.
McIntyre has a history of poor or missing evaluation of principal component significance, as discussed on RealClimate with respect to the Mann et al papers. That's the original topic where you brought up McIntyre's LOG12 discussion, I'll point out.
I would consider this diversion an Argument from Authority on your part to support McIntyre's claims about the "Hockey Stick", and therefore a red herring WRT that discussion. Expertise in one field doesn't support an argument in another, it's a logical fallacy, and it seems quite clear to me that McIntyre has not demonstrated any expertise in EFA either.
Regardless of this side-track, McIntyre's claims about Mann et al have been solidly refuted, most clearly by Wahl and Ammann 2007.
- Recursive Fury: Facts and misrepresentations
Phronesis at 11:03 AM on 23 September, 2013KR, are you saying there are math errors in his rebuttal of LOG12? Or in some other, climate-related work? If the latter, then your conclusion doesn't follow from your premise. Well, it might be rational to not read his arguments if you thought he was too error-prone, but it wouldn't follow to be unimpressed by his arguments based on math errors from some other work. Bias is a pervasive human challenge, so any anti-skeptic or anti-McIntyre scholar would want to go into this issue with some bias-correction algorithms running, otherwise you won't be able to get a clean take on whether he's right or not.
You seem to know where his posts are already (there are 16?), so I'm not sure what good it would do to link you to them. Maybe I can highlight his key arguments sometime this week. LOG12 should never have been published, and I'm surprised it hasn't been retracted at this point -- either by the authors or by Psych Science. - Recursive Fury: Facts and misrepresentations
KR at 04:57 AM on 23 September, 2013Phronesis - Given McIntyres propensity for basic math errors, I have been entirely unimpressed by any of his various criticisms of LOG12.
Until, however, you link to something in particular by McIntyre (there are at least 16 different McIntyre blog posts on the subject, but quite notably nothing peer-reviewed), you haven't presented any actual arguments in that regard.
- Hockey stick is broken
Phronesis at 16:50 PM on 22 September, 2013Michael and KR, thanks for the correction. I'll read the material you linked. I'm a social scientist so I know PCA – hopefully I'll be able to understand what I'm reading. I didn't find a published refutation of M&M, and the more bloggy stuff I'd seen were ad hominem attacks on McIntyre for not being a climate scientist. I did not take that as a good sign. I will say that if Mann's methods were invalid (I'm not sure if Michael is conceding or disputing this), but the conclusions turned out to be correct, I'd still cross out Mann's paper and only care about the subsequent, valid work (perhaps including Mann's.)
I will say that McIntyre was spot on in his debunking of the recent Psych Science paper on belief in conspiracy theories and AGW skepticism -- there I'm in the comfy surrounds of my own field and expertise. His regression diagnostics were solid. There were hardly any participants in the dataset that fit the advertised effects. The paper should not have been published, and it's the first time I've ever seen a social psychologist (the lead author) say that we shouldn't care about outliers (in response to McIntyre) –- we're all trained contrary to that notion (McIntyre showed that a handful of outliers (5?) drove a huge part of the reported correlations.) Maybe McIntyre's skill with the social psychology paper biased my judgment of what he had done with the Mann paper -- well, it's kind of easy to debunk social psychology papers, which says something about the state of social science.
- Hockey stick is broken
KR at 11:51 AM on 19 September, 2013Phronesis - "McIntyre and McKitrick purported to refute/debunk a specific paper -- the Mann 1998 paper... as far as I can tell, McIntyre and McKitrick were right in their criticism of that particular Mann paper" Unfortunately for your argument, they utterly failed to make their case.
M&M's several papers on the subject have been at the center of numerous peer-reviewed refutations (five of them listed here), with numerous errors and erroneous claims pointed out at RealClimate, including critical failures to apply PCA selection rules to identify significant components; an error that alone invalidates their work. Similar errors in PCA selection (which would have distinguished invalid noise-generated hockey sticks as insignificant) and a rather amazing amount of cherry-picking in their 'red-noise' model are discussed on Deep Climate, notably with an unconventional 'red-noise' model that actually was derived from the proxies (rather than a theoretic red-noise spectra), and therefore included the 'hockey-stick' - no surprise that they found it in their 'noise'.
The M&M critcisms of Mann's work are completely invalid, on various methodological grounds.
Is MBH1998 without flaw? Hardly - it's the initial paper in the field applying PCA and machine learning techniques to multi-proxy climate data, and as such is rather rough around the edges. Their centering method is arguably not the best available, additional proxies and further clarification of then-existing proxies have improved the data, and there are reasonable arguments for different combinatorial and statistical techniques.
But methodological issues with MBH1998 don't invalidate the general conclusions, that recent temperatures are the warmest in the last 1000 years. And many papers, many reconstructions, looking at the issue come to the same conclusions.

At this point I see (IMO) unsupported objections raised against MBH1998 to be a clear identifying marker of someone in climate science denial.
- Hockey stick is broken
michael sweet at 10:47 AM on 19 September, 2013Phronesis,
Are you talking about science or public relations? I will grant you than Mann and McIntyre disagreed about how to do the analysis. Mann thinks he was correct and McIntyre thinks Mann was incorrect. This issue has been resolved by collecting more data and redoing the analysis in a way that everyone agrees is correct. When that was done it was found that Mann was correct in his interpretation of the data. How does the noise that McIntyre continues to make relate to the data proving that Mann was correct all along? When extensive reanalysis and massive amounts of new data confirm the original finding that means Mann was right and McIntyre was incorrect all along.
- Hockey stick is broken
Phronesis at 10:02 AM on 19 September, 2013Hi all. The framing of this page is erroneous. The "skeptic argument" and "what the science says" do not refer to the same issue.
McIntyre and McKitrick purported to refute/debunk a specific paper -- the Mann 1998 paper. That is all. Their debunking (if it was truly a debunking, which it appears to be) stands. It's not refuted by all the other, later research that reaches similar conlcusions as Mann.
If the point here is to say that the hockey-stick-is-bogus argument is wrong because of all the other evidence, that's fine. But as far as I can tell, McIntyre and McKitrick were right in their criticism of that particular Mann paper, on various methodological grounds.
- An accurately informed public is necessary for climate policy
Rob Honeycutt at 07:48 AM on 30 July, 2013This is yet another denier tactic coming from Barry. They create impossible barriers of perfection for climate scientists and never expect anything close to the same from their own side.
Barry, this website is brimming with outrageous examples of "skeptics" propagating any number of completely ludicris claims. Where is your incredulity over them?
I'm waiting for a wide range of corrections from Pielke, Spencer, Christy, Watts, Goddard, Bastardi, Carter, Taylor, McKitrick, McIntyre, Easterbrook, Kappenberger, Scafetta, Humlum, and a long list of others.
Please let me know when these guys make their corrections and I'll gladly personally lobby John for a correction on the president's tweet.
- Charles Krauthammer's flat-earther global warming folly
citizenschallenge at 10:34 AM on 14 July, 2013Upon reflection I found my lead-in lacking. Here's the revised:
================
"There is simply no keeping up with the manmade - global warming disinformation campaign that steadfastly flies in the face of all objective appraisals of the evidence -
Why, in light of all this evidence, does the Republican power-politic global warming denial machine keep churning out distortions, lies and plain old crazy making?
By Republican power-politic global warming denial machine I'm referring to the likes of the Marshall Institute, Heartland Institute, SPPI, Murdoch media machine, Morano, Watts, McIntyre, et al. Peddlers of transparent science fiction.
What I find most disheartening is that at the heart of this endless flow of calculatedly deceptive stories is the fact that this is exactly what the Republican general public and politicians expect to hear. {...}"
~ ~ ~ ~ ~ ~ ~
I've also hot links names and claims to further information.
;- }
- Imbers et al. Test Human-Caused Global Warming Detection
scaddenp at 08:15 AM on 5 June, 2013Stealth - if you are going to wallow in likes of Watts or McIntyre, then I hope you will try to ensure that you opinions are formed on the basis of published science and not misrepresentation of science. When you are presented with conflicted information, what method are you going to use evaluate truth here?
- Imbers et al. Test Human-Caused Global Warming Detection
StealthAircraftSoftwareModeler at 23:25 PM on 4 June, 2013Okay, there's a lot of information here that I would like to take a closer look, and it will take a little bit to go through it. This post and thread is exactly what I have been wondering about, which is specifically trying to address and measure how much warming is due to AGW. I’ve done a lot of general internet research over the last year or two and have been on this site, Real Climate, Anthony Watts’ site, Roy Spencer, Steve McIntyre among other sites trying to gather information and fuse it together into what I think it a coherent picture. I expect that mentioning some of these names on this site might be offensive, so I apologize in advance.
My general philosophy is that I believe none of what I hear and only half of what I see. My background is dual BS in Physics and Computer Science with 30+ years in software development and modeling, most all of it related to stealth aircraft -- real time software systems operating in real world environments to support pilot decision making process. It requires modeling aircraft, weather, terrain, weapons, sensors, threats and so on. Lots of optimization algorithms to maximize opportunity and minimize risk. It has been a fun and cool job, and very interesting. If I have learned one thing, it is that modeling is always wrong (meaning it is never fully correct under all cases) and that the real world is different than the lab world, which is different than the modeled world, at least for aircraft and radars. I strongly suspect the climate is even more complex than what I have dealt with, which makes me very skeptical that climate scientists have a full grasp on the complexities of the climate. This is not a criticism of climate scientists, it is just hat things are hard and complex. After all, if it was easy, then everyone would agree and there wouldn’t be much debate.
Give me a day or two to wallow in these links and I’ll post some more questions shortly. Thanks for the feedback.
- Hockey stick is broken
Tom Dayton at 22:10 PM on 3 June, 2013There is an awesome new post on RealClimate about tree rings, soundly refuting McIntyre and other critics.
- Real Skepticism About the New Marcott 'Hockey Stick'
Jeffrey Davis at 11:17 AM on 11 April, 2013McIntyre's work is rhetorical rather than scientific. Hence the innuendoes and sarcasm.
- Real Skepticism About the New Marcott 'Hockey Stick'
Rob Honeycutt at 10:41 AM on 11 April, 2013Tom @ 21... "Such errors provide "skeptics" an opportunity to point to a mistake..."
You know, it seems to me, that's something that can never end. Science is iterative. It's never perfect. There is always something more to understand, always a better and more accurate way to look at things.
I keep getting the sense that the "skeptics" prey on this essential element of the scientific process in order to try and undermine it. Any real skeptic would look at a paper like Marcott and find ways that improve it by being skeptical. McIntyre and his ilk do the same thing, but in order to try to tear down other scientists and their work.
- Real Skepticism About the New Marcott 'Hockey Stick'
scaddenp at 10:38 AM on 11 April, 2013The point isnt whether McIntyre is a competent statician or not. It's what he does with it. Mostly what he has done is to draw attention aware from the main points of the paper to a sideshow. However the main point of the article is that the statistics were used simply to give people a reason to dismiss the paper whereas Tamino took the criticism on board and explored the effect and what it would do for the conclusions. Tamino's stuff advances science and could be worth publishing. McIntyre? All you seem to get sniping from sidelines, innuendo about improprietary and nothing published since M&M. I'd say put up or shut up.
- Real Skepticism About the New Marcott 'Hockey Stick'
KR at 10:25 AM on 11 April, 2013Ray - I've read through a number of the McIntyre discussions on Marcott, and (personal opinion only) have found them to be a mix of cherry-picks and arguments in detail while ignoring the larger picture. With language like "Marcottian uptricks upticks" and the like, McIntyre appears to be taking more an ideological approach than a scientific one.
I've also seen numerous statistical mistakes made by McIntyre, such as not knowing how to judge principal component weighting or deal with normalization (such as incorrectly selecting significant components, giving unsupported results), both in his attacks on Mann et al and Lewandowsky et al - I have not been impressed.
Your mileage may vary, but I don't find his work a useful contribution.
- Real Skepticism About the New Marcott 'Hockey Stick'
Ray at 09:58 AM on 11 April, 2013KR
There are a couple of current pieces on Climate Audit looking in some detail at the proxies used in the Marcott paper and making some comparisons between these and other similar proxcies. The language used isn't hysterical and the conclusions drawn don't seem overly comtentious. McIntyre, whatever his shortcomings, perceived or otherwise, is a competent statistician and there are points made, which, to me at least, give a wider perspective on the pros and cons of the various proxies that used in climate science.
- Real Skepticism About the New Marcott 'Hockey Stick'
KR at 09:25 AM on 11 April, 2013Tom Curtis - And as already discussed, we have sufficient proxy evidence (completely aside from the Marcott reconstruction and statistics) indicating the 8.2 Ka event and the drop in global temperatures then, an excursion lasting only a few centuries. As I noted here, there is no such support (nor physical mechanism) for any upward spike in temperatures during the Holocene of the nature and scale seen in current warming.
You certainly do have a point re: Marcott and the 8.2 Ka event - I had not carefully considered the timeline in previous remarks - but there's no evidence of 0.9 C warming spikes during the Holocene.
That's from the full body of evidence - completely aside from the Marcott et al time resolution, there is no indication of such a spike in proxy data that shows the 8.2 event. Hence arguments based upon "a spike might have been missed" are inconsistent with that body of evidence. And claims about such spikes are IMO the result of arguing about only one paper, when there is a great deal more data available contradicting such claims.
[ Not to mention that current warming will not be a short 'spike' - thousands of years will be required to draw down the CO2 we've put up in the last 150 years. And therefore claims about Holocene spikes too short to show in Marcott are irrelevant. ]
In that regard I find the 'spike' arguments seen from Watts, McIntyre, and the like to be in essence cherry-picking and red herrings; arguing about one set of data (which has its pluses, minuses, and uncertainties, and which definitely will be discussed/elaborated upon in future work) by making hypothetic claims clearly contradicted by the rest of the information available. I'm rather appalled at the time wasted on this nonsensical side-line.
- Real Skepticism About the New Marcott 'Hockey Stick'
chriskoz at 14:20 PM on 10 April, 2013Some people are trying to credit Steve McIntyre, who apparently first spotted the issues with Marcott 2013 interpretations. In fact, McIntyre's comments inspired Tamino's analysis.
To those allegations, Tamino has an excellent response in his For the Record post. I particularly like this part:
...perhaps if Steve McIntyre had been more careful in explaining himself, more interested in communicating reality than in demeaning the results, and less indulgent of his own sneering, people might refer to him rather than me when mentioning the impact of proxy droupout, and the "dot earth" blog might be referring to his posts rather than mine as "illuminating."
In other words: McIntyre lost a real chance of contributing to paloeclimate science by seeking to confuse and deminor the Marcott 2013 results rather than constructively criticise/explain them. He can blame only himself.
- The two epochs of Marcott and the Wheelchair
CBDunkerson at 01:27 AM on 5 April, 2013Dissident, the link you provide goes to the usual nonsense from Pielke and Lomborg. McIntyre has been pushing the same denials and sadly Revkin continues to give undue credence to the deniers.
Essentially, they are playing the same old 'data resolution' game that they do with every proxy study. The proxies used to generate the data in the Marcott study cannot give us temperature values in each and every year. There are gaps. Thus, it is theoretically possible that during one of those gaps there could have been a massive temperature increase, similar to the one we are currently experiencing, which then immediately reversed course and dropped back down to 'normal' in time for the next available data point. Note that they don't even try to provide an explanation of what could cause such a massive warming spike and then immediate cooling back to the prior temperature... because it is ridiculous. Nothing remotely like that has ever been seen or imagined. Further, they know full well that the warming spike we are currently experiencing will not be quickly reversed... rather, the temperature will rocket up and then stay there.
This boils down to one of the most common fictions of the deceivers... 'we do not know everything, therefor we are free to continue believing things we do know to be false'. We don't know exactly what the temperatures were in the 'gaps', so we can pretend that massive brief warming spikes happen all the time for no apparent reason and the current warming will quickly reverse... even though we know from basic physics that it won't.
- The two epochs of Marcott and the Wheelchair
Philip Shehan at 15:45 PM on 3 April, 2013An insight into how Anthony Watts regards discussion of this question in his latest installlment:
http://wattsupwiththat.com/2013/03/31/quote-of-the-week-bad-eggs-in-the-marcott-et-al-omelete-recipe/#comment-1262484
Here is his response to a comment of mine:
Anthony Watts says:
April 1, 2013 at 11:22 pm
Ah jeez Shehan, give it up, the Marcott study is toast and your focus minutiae is a waste of everyone’s time . Stop defending the indefensible and get your head out of your posterior so you can see the mess they created. Start by reading Ross McKitrick’s essay on the main page.
And here are my responses (the second is yet to be posted):
Philip Shehan says:
April 2, 2013 at 2:33 pm
Mr Watts. Well pardon me for focussing on “minutae”. So much easier to make a general smear without examining the “minutae” The accusations against Marcott were based on the “minutae”, and I have examined them. That’s what scientists do. That’s what science is about. If you can’t hack having the claims in your articles examined, don’t put them up.
REPLY: Oh I can hack it, I just find your hacks tiresome and pointless- Anthony
Mr Watts, This section contains complaints by Pielke and commentators of some specific points Marcott’s thesis and the Science article he coauthored. These complaints and alleged inconsistencies are used to claim that Marcott and others are guilty of fraud, misconduct deceit lying etc etc.
I recognize that there are many commentators who think that comments should be confined to unexamined cheering agreement, mutual backslapping and rounds of “Boo Hiss Marcott Sucks and Shehan too LOL.”
I take the attitude that on what is billed as The World’s Best Science Blog”, there are actually some here who have the interest, scientific understanding and or intellectual ability to actually examine these claims in a scientific manner.
I know from experience that if I don’t go into “minutae” I have to keep coming back to correct misinterpretation or plain pigheaded stupidity and explain things in further detail.
For example. I pointed out that contrary to the rumour started by one of McIntyre’s readers and accepted without examination and repeated everywhere as established fact, Marcott’s thesis contains seven graphs with an uptick. I also pointed out that McIntyre’s puzzlement at the differences in the two graphs is in plain sight for anyone who wished to spend more than a few seconds looking at it.
I then get asked for a link. I provide it, but knowing people will still not read it before hitting the keyboard, nor after (ferd berple take note), I briefly quote from the thesis to explain what the graphs are showing. This is not pointless, but for those who are to stupid , lazy or ignorant to engage in a truly scientific debate and who do not want their prejudices challenged it may well be tiresome.
If people wish to critically examine my assessment of the evidence, they are welcome to do so with a clear reasoned argument with enough “minutae” to establish their case. Politely. That is how real scientific discussion is supposed to work
- The two epochs of Marcott and the Wheelchair
Tom Curtis at 10:21 AM on 28 March, 2013Jos Hagelaars @15, I will accept your word that you were aware of the uncertainties, and presumably lack of robustness, of the uptick at the end of the Marcott graph. The question then becomes, why did you not communicate those uncertainties and lack of robustness? Given that there are serious issues about the robustness of the reconstruction over the last few centuries, why is that issue never canvassed in your article? Why is the word "robust" not even mentioned?
In your article you write:
"The temperature reconstruction ends mid-20th century, so the rapid temperature rise since 1850 is clearly visible in the graphs presented in their study. And what do we see? Again something that looks like a hockey stick as in the graph from Mann et al 2008."
"[S]omething that looks [as much] like a hockey stick as in the graph from Mann et al 2008." Really?
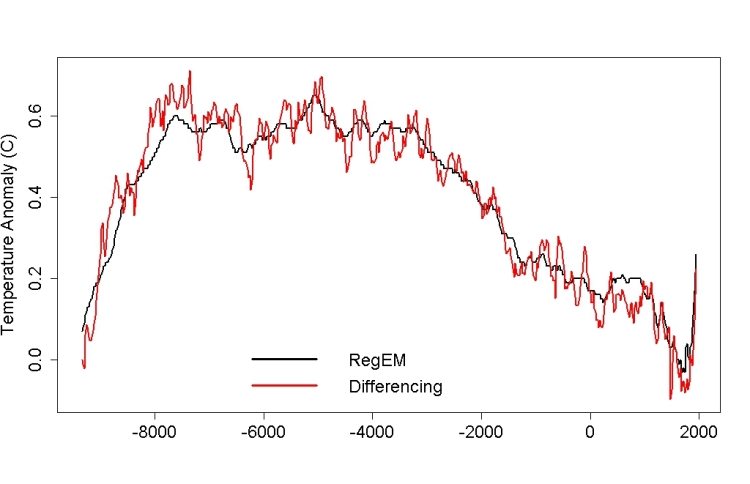
(Source)
Everything beyond the uptick visible in the RegEM reconstruction is an artifact of the drop out of proxies with time. Therefore the hockey stick like appearance of the graph that you are focussing on is an illusion - an artifact of a poor statistical technique.
As it happens the mean uptick in the resconstruction using the method of differences and simple averaging only reaches an anomaly value relative to 1961-90 of -0.04 C. (That is not clear from Tamino's graph, as he uses a different baseline.) That lies outside the lower range of the 2 sigma error margin of the Standard 5x5 method shown in the main graph. The mean uptick using original published ages for the proxies is only -0.1 C relative to 1961-90, or 2.5 Standard Deviations below the uptick actually shown. That is probably the best estimate of the mean temperature from 1930-1950 using the Marcott proxies, and is a value exceeded by greater than 50% of Holocene temperatures. It compares well with the HadCRUT3v value of approximately -0.06 C for the same period.
Again, this is not an issue of uncertainty, but of robustness. The Marcott et al uncertainty estimates do not capture the effect of averaging without regard to the drop out of proxies. More precisely, the show the influence of the reduced number of proxies, but do not account for the influence of the relative temperatures of the proxies that drop out. That is why Marcott et al indicated the twentieth century temperatures were not robust (ie, that they were likely to change significantly as the result of improved or different methods), rather than that they are uncertain (ie, that improved proxy sets are likely to narrow the estimate within the current estimated uncertainty range).
This can be seen with the table of values and 1 sigma uncertainties for the different methods tried in Marcott et al:
Method
1940 Anomaly
(Degrees C)
1 sigma
(Degrees C)
Standard 5x5 0.6 0.28 Standard 30x30 0.42 0.16 Standard 10 lat 0.52 0.25 Standard 0.28 0.23 RegEM 0.02 0.63 RegEM5x5 0.05 0.13 Jack30 0.65 0.34 Jack50 0.60 0.40 The values which all estimates overlap within 2 Sigma is 0.1-0.31, well above the probable values for the period. Further, only half of the methods (Standard, RegEM, RegEM 5x5, and Jack50) have 2 sigma uncertainty ranges that overlap the probable values.
Further, it is not true that the "After the year 1850, the influence of man-made emissions is clearly visible in Marcott's figure". First, this is not true because the rise in temperature to 1940 is primarilly (though not exclusively) due to natural causes. Second, it is not true because the rise to 1940 is well within the range of variability demonstrated by Mann et al 2008's reconstruction over the preceding 2000 years. Third, it is not true because even the start of the rise is not a robust feature of the analysis carried out by Marcott et al., as seen in Fig 1 C of the paper:
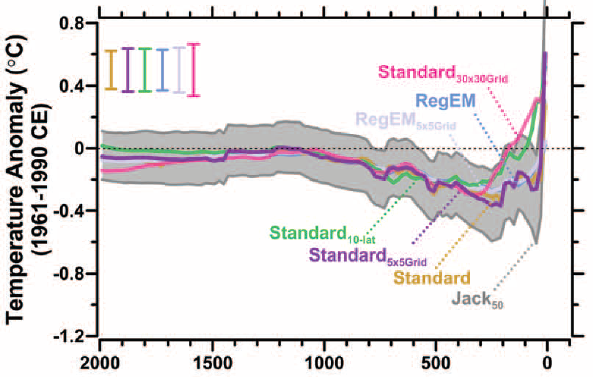
In that figure, depending on which of several plausible methods you use, the rise starts as early as 1650. That is because the rise in those methods is primarilly an artifact of the drop out of proxies, and hence cannot be used to determine the timing of the real rise.
Using the differencing method, a better estimate can be obtained, but then the rise starts 1750 or 1800 depending on whether you use original published ages or Marcott's redating of the proxies. (See the fourth figure in my post @8.)
Finally, although you did quote some of the passage I quoted from Marcott et al, you did not explain the reasoning behind the quote. You did not show how the analysis by Marcott et al allowed them to reach their conclusions.
This is crucial. By leaving people with the impression that Marcott's conclusion was based on the spurious spike, you also leave them vulnerable to believing McIntyre has refuted Marcott when all he has done is quibbled about some fringe issues. More generally, by not showing the why of the reasoning, you have left people reliant on authority, or there own ability to interpret Marcott et al (which is not the clearest paper when it comes to describing methodology).
I do not know you or your blog. You may write for scientifically trained or technically minded people who can be rellied on to look up the paper for themselves, and examine the ins and outs of reasoning. Skeptical Science, however, is aimed at the general audience. In principle, most blogs should be readable and understandable by a person with only ten years of schooling, and a moderate facility with science. For those readers, in cross posting, the basics of Marcott's reasoning and the pitfalls in his method should have been explained.
The still need to be, in an addendum to the post.
- The two epochs of Marcott and the Wheelchair
Tom Curtis at 11:38 AM on 27 March, 2013The post above refers to the "...he rapid temperature rise since 1850 ..." that "...is clearly visible in the graphs ...". The problem is that most of that rapid rise is an artifact rather than a valid reconstruction. This is clear if you look at the supplemental data, which shows a "reconstructed" temperature of 0.6 C above the 1961-1990 average in 1940. That is, it shows a temperature approximately 0.1 C higher than the 2000-2009 average in 1940. You can see this if you have a close look at Fig 1 A of Marcot et al:

(Note that the Mann08/HadCRUT splice is NH temperatures only, and shows a 0.2 C greater increase than the global temperatures).
The majority of this artifact is the result of the drop out of colder proxies in the 19th and 20th centuries, as explained with typical clarity by Tamino. He uses a method of differences to eliminate the artifact:
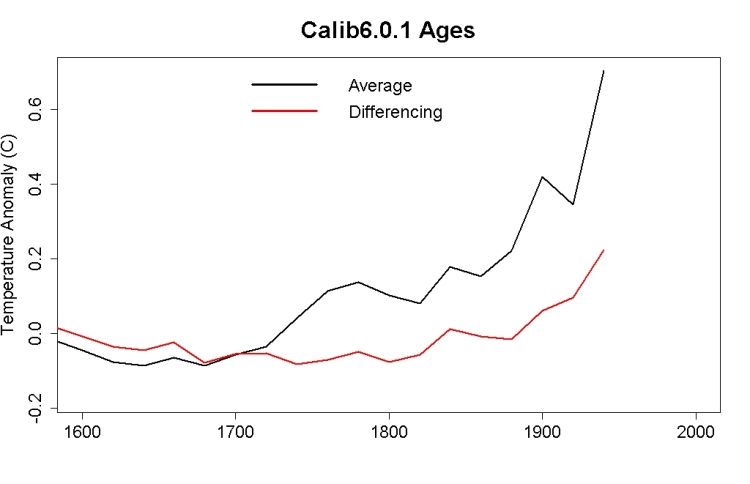
He also shows that the differenced method and the RegEm method (used as a robustness check in Marcott el al) show very similar results, and hence results consistent with the modern temperature record:
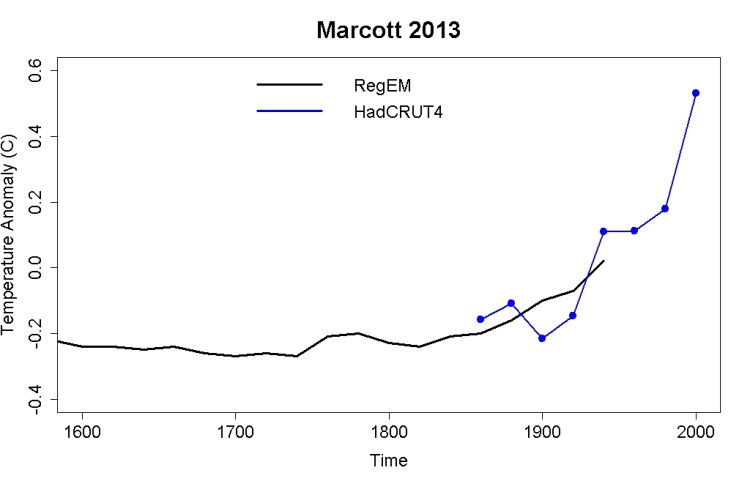
(Source)
I note that Steve McIntyre is suggesting that the redating of some proxies by Marcott et al is also a major factor in the uptick. I think he has made a sound case that Marcott's redating of some of the proxies is not jus a consequence of the use of the Calib6.0.1 calibration of C14 dates (which is justified), but also of some mistaken assumptions about the relationships of core tops to the actual sea floor for some cores. Specifically, Marcott et al appear to believe that the core tap is the sea floor, whereas (apparently) in fact the upper most sections of the core are often lost, presumably due to being less compacted and hence unable to withstand the mechanical stresses from being cored. Craig Loehle goes so far as to suggest this is grounds for withdrawing the paper.
What neither McIntyre nor Loehle appear to discuss is the difference it makes:
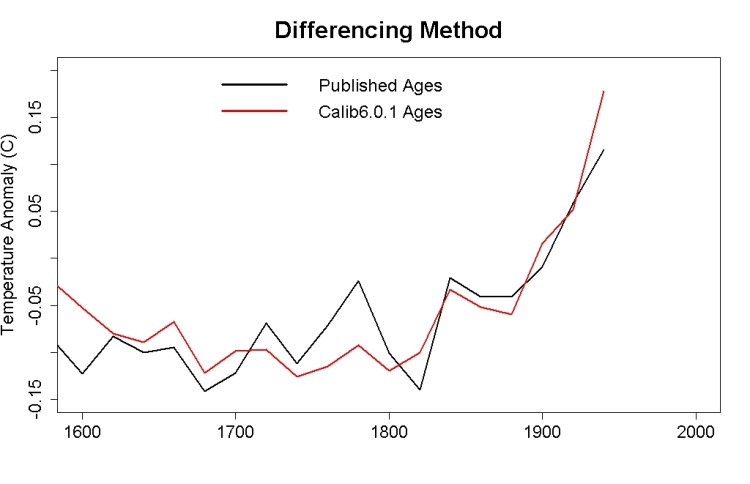
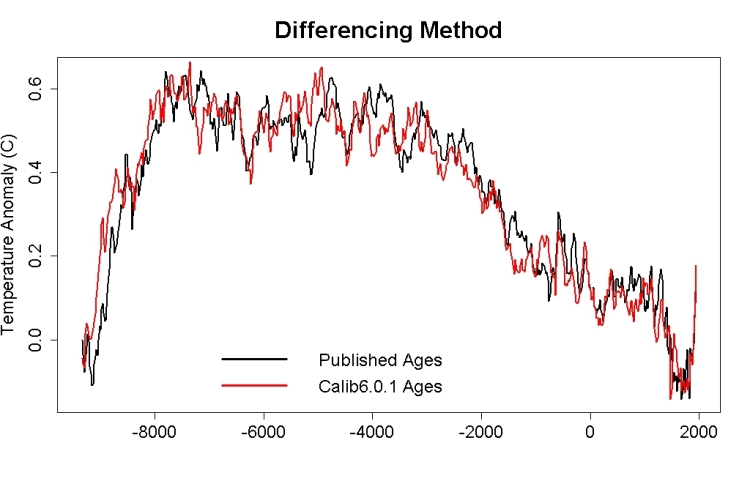
(Source)
As can be seen, the difference is negligible. This apparent error surely requires no more than a corrigendum. I do not expect that to be recognized at Climate Audit, however, where the focus is always on one sidedly nitpicking errors (even those that don't exist), rather than on actually discovering facts about the world.
Very importantly, the comparison between modern (2000-2009) temperatures and Holocene temperatures is not based on the uptick, which Marcott et al described as not robust. Rather, they are based on the HadCRUT3 instrument record for 2000-2009 which is compared statistically to the probability distribution of Holocene temperatures are reconstructed in Marcott et al. Thus, the most important graph in Marcott et al is not Figure 1 B (the figure normally shown, and shown above), but Figure 3, which shows the comparison:

Marcott et al comment:
"Our results indicate that global mean temperature for the decade 2000–2009 (34) has not yet exceeded the warmest temperatures of the early Holocene (5000 to 10,000 yr B.P.). These temperatures are, however, warmer than 82% of the Holocene distribution as represented by the Standard5×5 stack, or 72% after making plausible corrections for inherent smoothing of the high frequencies in the stack (6) (Fig. 3). In contrast, the decadal mean global temperature of the early 20th century (1900–1909) was cooler than >95% of the Holocene distribution under both the Standard5×5 and high-frequency corrected scenarios. Global temperature, therefore, has risen from near the coldest to the warmest levels of the Holocene within the past century, reversing the long-term cooling trend that began ~5000 yr B.P. Climate models project that temperatures are likely to exceed the full distribution of Holocene warmth by 2100 for all versions of the temperature stack(35) (Fig. 3), regardless of the greenhouse gas emission scenario considered (excluding the year 2000 constant composition scenario, which has already been exceeded). By 2100, global average temperatures will probably be 5 to 12 standard deviations above the Holocene temperature mean for the A1B scenario (35) based on our Standard5×5 plus high-frequency addition stack (Fig. 3)."
(My emphasis.)
I note that when JosHag published this post on his own blog, the uptick in the Marcott reconstruction had not been discussed significantly, so it is understandable that he did not pick up the problem. That is no longer the case, and an addendum clarrifying the issue should be added to the post (as not all readers will read as far as my comment).
- Recursive Fury: Facts and misrepresentations
geoffchambers at 01:57 AM on 27 March, 2013Tom Curtis comment 90
You misundertand my position, and therefore misrepresent it. I’d ignore it because it’s not very interesting for others, except that you seem to be asking the moderators to snip me; so I’d better defend myself.
No. I don’t deliberately contradict myself. I have consistently expressed the idea that anonymous on-line surveys like the one on which LOG12 is based are inherently useless for any enquiry more complicated than “do you like/dislike this article?” If you want to find out what someone thinks, believes or feels, the best way is to chat to them. A street interview is a second best, a telephone interview a poor third, and so on.
My reactions to the conspiracy questions are much like many of the readers of the blogs where the survey was publicised. “Don’t know about that”, “Perhaps yes, perhaps not” and so on. I might very well, give different responses on different occasions, just as I might give different answers as to who I’d vote for or my favourite colour. I’ve sometimes expressed that jokingly in comments about Prince Philip killing Lady Di, etc. I tried to make the point seriously once at Climate Audit, that Steve McIntyre was not justified in removing two “scammed” responses. You can’t arbitrarily decide that liars or cunning bastards should be removed from a survey - it takes all sorts. It would be like doing a survey about petty crime and eliminating a respondent because he nicked your tape recorder.
You will note that in my comment 38 replying to Albatross, I don’t deny the reality of the theory of anthropogenic climate change or anthropogenic global warming. I’m therefore a warmist, and not a denier, according to the criteria of the questionnaire in LOG12. The fact that I disagree fervently with everything that Skeptical Science stands for is not a reflection on my state of mind, but on the complexity of a political programme designed to subvert science in the interest of an ideology. You’re not going to get to the bottom of that by asking if people agree or disagree with anything.
- Recursive Fury: Facts and misrepresentations
Tom Curtis at 19:26 PM on 24 March, 2013BaerbelW @57, the blogs contacted first by Lewandowsky (and hence described as misinformation sites by Brad) are:
- Skeptical Science (posted by tweet only, Aug 27th, 2010)
- Climate Asylum (posted Aug 28th, 2010)
- Open Mind (posted on Aug 28th, 2010)
- Deltoid (posted on Aug 29th, 2010)
- Global Warming: Man or Myth? (posted Aug 29th, 2010)
- A Few Things Ill Considered (posted Aug 29th, 2010)
- Hot Topic (posted Aug 30th, 2010)
- Climate Change Task Force (posted as an addendum to a July 17th post, presumably in late August, 2010)
(The dates are the times the surveys were posted.)
The blogs contacted second, and hence defined by Brad as "science defending" are:
- Steve McIntyre Climate Audit
- Dr Roger Pielke Jr (he replied to the initial contact)
- Mr Marc Morano (of Climatedepot; he replied to the initial contact)
- Dr Roy Spencer (no reply)
- Mr Robert Ferguson (of the Science and Public Policy Institute, no reply)
He has also specified that WUWT, Jonova and Biship Hill as "good examples of pro-science sites". The list speaks for itself and demolishes any claim he makes to be "defending science" or to accept AGW.
- Recursive Fury: Facts and misrepresentations
geoffchambers at 08:17 AM on 23 March, 2013This is the post I've been trying to put up at Frontiers...
To the editors, Frontiers in Personality Science:
In table 3 of this paper, I am mentioned by name and identified as having been the first to have mentioned in public Recursive Conspiracist Hypothesis number 4 - namely that Sceptic blogs were only contacted after a delay. This hypothesis is quite true, as Professor Lewandowsky has admitted. Nonetheless, the fact of having been the first to make this accusation leads to me being accused of exhibiting the following symtoms of conspiracist ideation:
nefarious intent, nihilistic skepticism, “must be wrong”; “no accident”, and unreflexive counterfactual thinking. From the definitions of these criteria given in the paper I extract the following:
Nefarious Intent: “... A corollary of the first criterion is the pervasive self-perception and self-presentation among conspiracy theorists as the victims of organized persecution. The theorist typically considers herself, at least tacitly, to be the brave antagonist of the nefarious intentions of the conspiracy; that is, the victim is also a potential hero.”
Nihilistic Skepticism: “The conspiracy theorist refuses to believe anything that does not fit into the conspiracy theory. Thus, nothing is at it seems, and all evidence points to hidden agendas or some other meaning that only the conspiracy theorist is aware of.”
“Must be Wrong”: “The underlying lack of trust and exaggerated suspicion contribute to a cognitive pattern whereby specific hypotheses may be abandoned when they become unsustainable, but those corrections do not impinge on the overall abstraction that 'something must be wrong' and the 'official' account must be based on deception.”
“No Accident”: “To the conspiracy theorist, nothing happens by accident ... Thus, small random events are woven into a conspiracy narrative and reinterpreted as indisputable evidence for the theory.”
Unreflexive Counterfactual Thinking: “Contrary evidence is often interpreted as evidence for a conspiracy [...] the stronger the evidence against a conspiracy, the more the conspirators must want people to believe their version of events.”
These definitions clearly identify me as being irrational and paranoid, and are therefore defamatory. I therefore request you to withdraw this paper.
I note further that , in the section on hypothesis (4) (“Skeptic" blogs contacted after delay) in which I am named, only one piece of evidence is produced, and that is a quote from Lucia Lindgren. If you don’t withdraw the paper, you might at least correct it and replace my name with that of Ms Lindgren.
However, that won’t absolve the authors of having defamed me. If we turn to hypothesis (3) “Presentation of intermediate data”, we see that the person accused of having been the first to pronounce it is Steve McIntyre. Despite the fact that this hypothesis also turned out to be true, it leads him to being accused of exhibiting the same irrational and paranoid tendencies as me, (except for “No Accident”). The link provided
http://www.shapingtomorrowsworld.org/ccc2.html#22
leads to a comment by Dr McIntyre (comment 8) to an article by Professor Lewandowsky. However, Dr McIntyre’s comment is not about the presentation of intermediate data, but about four entirely different subjects. The reference to the presentation of intermediate data is in two previous comments by me to the same article (comments 3 and 6). In Comment 5, a commenter notes that I had already made the same point in a comment at SkepticalScience, a blog run by second author John Cook, which for some reason was not included among the blogs analysed, despite being one of the “Principal web sites involved in blogosphere's response to the publication of LOG12” (title of table 2).
One reason for not considering SkepticalScience, despite the fact that this blog is widely regarded as one of the leading blogs commenting on climate scepticism, can perhaps be found in the paper, where, under the heading of “Potential Limitations”, it is explained why the content analysis of blogs was entrusted to authors Cook and Marriott:
“Two of the present authors also contributed to LOG12, and the present analysis may therefore be biased by a potential conflict of interest. This possibility cannot be ruled out [...]. [B]ecause data collection (via internet search) was conducted by two authors who were not involved in analysis or report of LOG12, the resulting “raw" data - available in the online supplementary material - cannot reflect a conflict of interest involving the LOG12 authors.”
It might have been wise to indicate that:
1) the two authors whose data collection “cannot reflect a conflict of interest” both run blogs which concentrate on countering the views of sceptics (SkepticalScience and WatchingtheDeniers)
2) John Cook of Skeptical Science is coauthor with first author Stephan Lewandowsky of “Debunking Skepticism”; and
3)SkepticalScience was the scene of some of the most lively debates about (LOG12) and of at least one of the first occurrences of a conspiracist hypothesis.
I therefore suggest that, in the interest of accuracy, the authors replace the name of Dr McIntyre with mine, (since I do believe that my comment at Skeptical Science was the first to raise this hypothesis, the truth of which has been confirmed by Professor Lewandowsky) and my name with that of Lucia Lindgren.
I haven’t looked at the attributions of earliest mention to the other hypotheses mentioned in table 3. However, I noticed that a quote attributed to me is false, and it wouldn’t surprise me if there are other errors.
Finally, I would like to point out that by the time Cook and Marriott began their content analysis (August 28), the paper (LOG12) had already been the subject of numerous comments on blogs for at least five weeks, beginning with:
http://www.guardian.co.uk/environment/blog/2012/jul/27/climate-sceptics-conspiracy-theorists
19 July 2012 (400+ comments)
http://www.guardian.co.uk/environment/blog/2012/jul/27/climate-sceptics-conspiracy-theorists
29 July 2012 (1300+ comments)
http://bishophill.squarespace.com/discussion/post/1904675
30 July 2012 (70 comments)
http://manicbeancounter.com/2012/07/30/lewandowsky-et-al-2012-motivated-rejection-of-science-part-1/ http://manicbeancounter.com/2012/07/30/lewandowsky-et-al-2012-motivated-rejection-of-science-part-2/
30 July 2012
http://talkingclimate.org/are-climate-sceptics-more-likely-to-be-conspiracy-theorists/.
August 2 2012
The claim to have identified the earliest occurrences of the conspiracist ideation starting on 28 August is therefore moot.
I therefore respectfully suggest that the wisest course might be to withdraw this paper.
- Recursive Fury: Facts and misrepresentations
Ray at 20:27 PM on 22 March, 2013To suggest, even by association rather than directly, in the supplementary data that Professor Betts, a lead author of the IPCC and head of Climate Impacts at the UK Met Office espouses conspiracy theory makes one wonder if any other of those who the paper claims "espouse conspiracy theory" are not "deniers" but proponents of CAGW. Professor Betts in his tweets on the matter states the suggestion he is "espousing conspiracy theory, that's just crazy" and "Lewandowsky et al are clearly deluded". Naturally I assume you regret this incident as it does rather put "egg on the face". Perhaps more significantly, Professor Betts, who is manifestly not a "denier" posted on Bishop Hill a site more anti- than pro-CAGW and asks this question "The thing I don't understand is, why didn't they (Lewandowsky et al) just make a post on sceptic blogs themselves, rather than approaching blog owners". He then refers to Steve Mcintyre at Climate Audit as "Moderating with a very light touch" and states "I doubt Steve McIntyre would have removed such an unsolicited post" These comments clearly show that a) although he is a well respected climate scientist he is not averse to reading and posting on anti-warmist sites and b) he regards these two sites as being vety lightly moderated.
(-snip-)
- Recursive Fury: Facts and misrepresentations
Barry Woods at 20:25 PM on 22 March, 2013I was fascinated to find one of my comments was included in the Recursive Fury paper's Supplementary data, alongside such exalted company as comments/articles by Prof Richard Betts (Met Office- Head of Climate Impact, IPCC AR4, AR5 lead author), Prof Judith Curry, and Paul Matthews (Reader of Mathematics Nottingham Uni)
but I was concerned to find that my comment included appears to be quote mined and not displayed in full, 'quote mined' is how I perceive it, let me explain carefully.
ie when I tracked down the link (I could not cut and paste it, some tech probs from PDF) I found that my FULL comment had not been included/quoted... just this:
“someone has looked at the data. and the conclusions and title of the paper are utterly fraudlent. ie 45 out of 48 those that reject climate science REJECT the moon landing conspiracy theory” – Barry Woods
LOG12 heading/Tilte:
NASA faked the moon landing|Therefore (Climate) Science is a Hoax:
An Anatomy of the Motivated Rejection of Science
the url provided in the supplementary data didn’t work for some reason (tech issue), so I had had a search for my comment and found that just 2 sentences had been used from a much longer comment.
Why did the papers 'raw data' exclude my very next sentence? where I describe how some of the conclusions made (and title) of the LOG12 paper, is actually rected by its own data!
"Looking at the data, those that most strongly ‘reject’ climate science, ALSO strongly reject ALL the conspiracy theories…" - Barry Woods
MY full comment is show below, which backs up my statement, whilst linking to an analysis of Lewandowsky’s actual data for LOG12, a link which contains survey data, so anybody can check for themselves
Barry Woods (Comment #102532)
September 2nd, 2012 at 3:53 amsomeone has looked at the data. and the conclusions and title of the paper are utterly fraudlent. ie 45 out of 48 those that reject climate science REJECT the moon landing conspiracy theory
Looking at the data, those that most strongly ‘reject’ climate science, ALSO strongly reject ALL the conspiracy theories…
extract below-
http://manicbeancounter.com/2012/09/01/lewandowsky-et-al-2012-motivated-rejection-of-science-part-3-data-analysis-of-the-conspiracy-theory-element/
So what of the conspiracy theory that most the moon landings were faked? The one in the title 'NASA faked the moon landing:Therefore (Climate) Science is a Hoax: An Anatomy of the Motivated Rejection of Science'
45 out of 48 of those who dogmatically reject climate science, also dogmatically emphatically reject the conspiracy theory. The two who score 4 are rogue results.
In fact, the response is pretty emphatic in every group. Consider the abstract.
We additionally show that endorsement of a cluster of conspiracy theories (e.g., that the CIA killed Martin-Luther King or that NASA faked the moon landing) predicts rejection of climate science as well as the rejection of other scientific findings, above and beyond endorsement of laissez-faire free markets.
Let me be quite clear. The title of the paper makes a false claim from authors with an agenda of silencing opponents. It is entirely without any proper evidence.
The other eleven results are below
well worth a look at the pivot tables in the above link"
that was my full comment, link:
thus this full comment which linked to LOG 12 survey data, and fully backed up my concern that the title of LOG12 was not supported by the survey data (in fact, those that most strongly – as you say ‘rejected the science’ in fact STRONGLY rejected the conspiracy theories), making the title of the paper, problematic. and perceived by many, hence the criticism, that the paper was as deliberately and incorrectly provocative..
NASA faked the moon landing|Therefore (Climate) Science is a Hoax: An Anatomy of the Motivated Rejection of Science - Lewandowsky et al
If you may recall from Skeptical Science and Shaping Tomorrows World comments by SkS regular Tom Curtis, he also had similar concerns (full comment, my bold):
"Sou @42, the direction of causation conspiracy theorist -> AGW "skeptic" correctly represents the findings of the paper. The use of "therefore" in the title, however, indicates that that is supposed to be a logical inference. That is not supported by the paper, and is not reflective of the reasoning of any person I am aware of, or (I believe) any real person.
It is very difficult to believe that the title is anything other than a deliberate attempt to be offensive so as to draw attention to a paper of poor quality, but which is thought to be useful for "messaging" in the climate wars. Steve McIntyre has incorrectly attempted to infer a moral condemnation of Lewandowsky from certain of my comments (now corrected). Let me leave no-one in any doubt. In choosing the title of his paper, Lewandowsky not only acted unscientifically, but immorally as well. It was a despicable act. - Tom Curtislink Shaping tomorrow world blog here
http://www.shapingtomorrowsworld.org/news.php?p=2&t=397&&n=166#1460
I await the final publication of LOG12 with interest, as it would be of course by far the best course of action, to respond formally to a journal any concerns or issues with LOG12, than by comment on blogs. Unfortunately that is all that I and others could do, despite the paper having wide media attention, yet it is still (not quite?) published. thus LOG12' many critics are not yet able (many of whom, whose blog comment/concerns that the Recursive Fury paper is about), to actually formally respond to the journal Psychological Science.
Personally, I do not see how LOG12, can be published with this title..
NASA faked the moon landing|Therefore (Climate) Science is a Hoax:
An Anatomy of the Motivated Rejection of Science
yet if the title were to change, the Recursvive Fury paper would be about, with criticisms about, a unpublished (in the journal) version of the LOG12 paper. This would make the publication, and of the Recursive Fury paper, in its current form problematic aswell.
Please add my full comment to the suplementary data, as I think you misrepresent a name identifiable person comments.
Additionally can you advice me of the ethics considerations and approvals for the Recursive Fury paper.
More than 100 comments found. Only the most recent 100 have been displayed.
More than 100 comments found. Only the most recent 100 have been displayed.


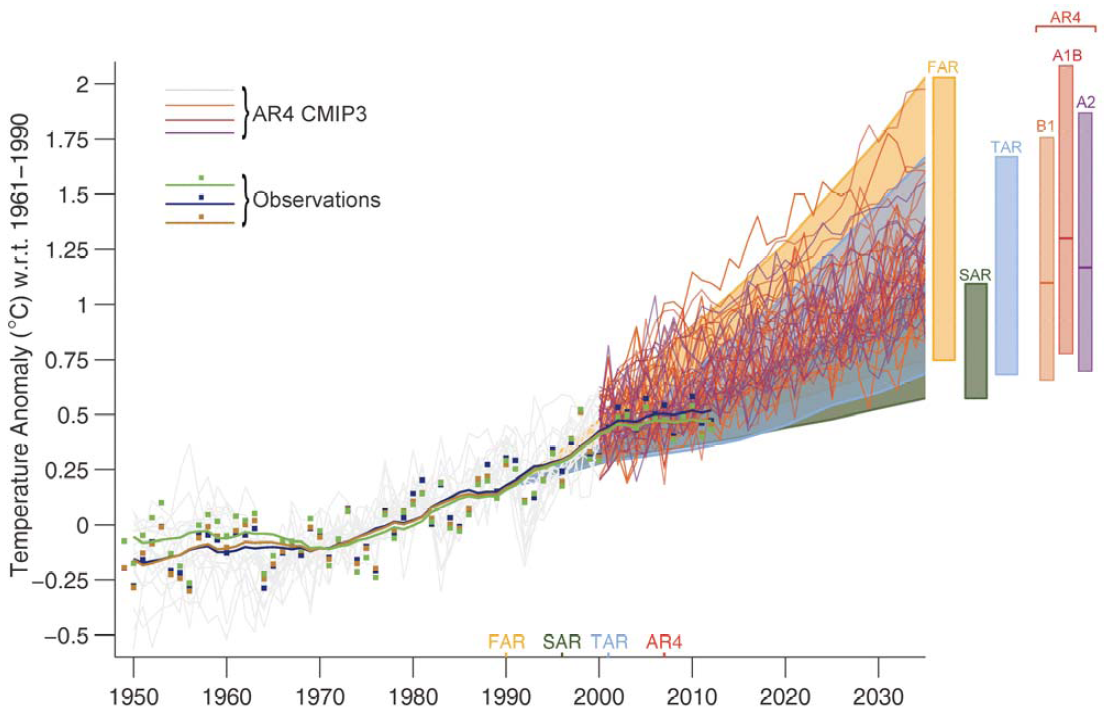
THE ESCALATOR

(free to republish)