


 Arguments
Software
Resources
Comments
The Consensus Project
Translations
About
Support
Arguments
Software
Resources
Comments
The Consensus Project
Translations
About
Support
![]()
![]()
![]()
![]()
![]()
![]()
![]()
![]()
![]()
![]()


![]()


Latest Posts
- Skeptical Science New Research for Week #17 2024
- Water is at the heart of farmers’ struggle to survive in Benin
- At a glance - The difference between weather and climate
- India makes a big bet on electric buses
- 2024 SkS Weekly Climate Change & Global Warming News Roundup #16
- EGU2024 - An intense week of joining sessions virtually
- Skeptical Science New Research for Week #16 2024
- How extreme was the Earth's temperature in 2023
- At a glance - Is the science settled?
- What is Mexico doing about climate change?
- 2024 SkS Weekly Climate Change & Global Warming News Roundup #15
- Fact Brief - Did global warming stop in 1998?
- Skeptical Science New Research for Week #15 2024
- EGU2024 - Picking and chosing sessions to attend virtually
- At a glance - The Pacific Decadal Oscillation (PDO) is not causing global warming
- Climate Adam: Is Global Warming Speeding Up?
- 2024 SkS Weekly Climate Change & Global Warming News Roundup #14
- Gigafact and Skeptical Science collaborate to create fact briefs
- Skeptical Science New Research for Week #14 2024
- How can I make my retirement plan climate-friendly?
- At a glance - Global warming and the El Niño Southern Oscillation
- A data scientist’s case for ‘cautious optimism’ about climate change
- 2024 SkS Weekly Climate Change & Global Warming News Roundup #13
- Skeptical Science New Research for Week #13 2024
- You can start applying for the American Climate Corps next month
- At a glance - Human fingerprints on climate change rule out natural cycles
- Want clean electricity? These are the overlooked elected officials who get to decide.
- 2024 SkS Weekly Climate Change & Global Warming News Roundup #12
- Climate - the Movie: a hot mess of (c)old myths!
- Skeptical Science New Research for Week #12 2024
Comment Search Results
Search for ole humlum
Comments matching the search ole humlum:
- Solar Cycle Length proves its the sun
Hans Petter Jacobsen at 06:10 AM on 23 February, 2021Jan-Erik Solheim, Kjell Stordahl and Ole Humlum (SSH) published their papers 'Solar Activity and Svalbard Temperatures' and 'The long sunspot cycle 23 predicts a significant temperature decrease in cycle 24' early in 2012. According to SSH, their Solar Cycle Model can, based on the length of a solar cycle, predict the mean temperature in the next solar cycle for some northern regions. Later the same year I programmed their Solar Cycle Model. I got the same results as they did with their implementation of the model. When the model was run with temperature series for the northern region up to and including solar cycle 23, the results satisfied the statistical test used by SSH. A closer examination with hindcasting (backtesting) revealed that the model predicted the temperatures well until the mid-1970s, but not thereafter. I wrote about this in December 2012 here at Skeptical Science in the blog post 'Solar Cycle Model fails to predict the recent warming'.
In their papers, SSH made some specific predictions for temperatures in solar cycle 24, which had just started in 2012. In 2014 I discussed the Solar Cycle Model with the lead author Solheim on a Norwegian discussion forum. He stressed that we have to wait till solar cycle 24 has ended before we can evaluate the model's predictions for that cycle. Now it has ended. The temperatures in solar cycle 24 were higher than in the previous cycle, not colder as predicted by SSH. See more details in comment 22 in the blog post I wrote here at SkS.
- Solar Cycle Model fails to predict the recent warming
Hans Petter Jacobsen at 23:53 PM on 20 February, 2021When I wrote this blog post in December 2012, the temperatures measured so far in solar cycle 24 were much higher than SSH (Jan-Erik Solheim, Kjell Stordahl and Ole Humlum) predicted with their solar cycle model in [1] and [2]. In 2014, I wrote about the failure of their model on a Norwegian discussion forum. Solheim, the lead author of the two articles, participated in the discussion afterwards. He defended his model. He stressed that we have to wait till solar cycle 24 has ended before we can evaluate the model's predictions for that cycle. It ended in November 2019, so now we have the answer. The average temperatures in solar cycle 24 became much higher than SSH predicted with their model.
In [1], SSH predicted that the average temperature on Svalbard in solar cycle 24 would be between 1.5 and 5.5°C colder than it was in solar cycle 23. According to the Norwegian Meteorological Institute, the average temperature at Svalbard Airport Longyearbyen increased by 1.7°C from solar cycle 23 to 24. According to Berkeley Earth, it increased by 1.0°C at a location inland, not far from Longyearbyen.
In [2], SSH predicted that the average temperature in a northern region including Iceland and Norway would drop by at least 1°C from solar cycle 23 to 24. According to Berkeley Earth it rose by 0.3°C on Iceland and by 0.7°C in Norway including Svalbard.
Figure 1 in the blog post shows how the HadCRUT3 temperatures in the Northern Hemisphere fit with the predictions of the solar cycle model. Then solar cycle 24 had just started, and the blue star for solar cycle 24 showed the temperatures measured so far in that cycle. Now the blue star can be replaced with a blue circle showing the average temperature in solar cycle 24. That is done in the Updated Figure 1.

Updated Figure 1: The observed and the predicted mean temperatures in solar cycles up to and including cycle 24.
The original Figure 1 used the HadCRUT3 temperatures in the Northern Hemisphere, just as SSH did in [2]. Met Office has replaced the HadCRUT3 temperatures with the HadCRUT4 temperatures. The Updated Figure 1 therefore uses the the HadCRUT4 temperatures in the Northern Hemisphere.
The Updated Figure 1 shows the same for the northern hemisphere as the examples do for Svalbard, Iceland and Norway. The temperatures in Solar Cycle 24 became much higher than they were in the previous cycle. Not colder as predicted by SSH.
See the blog post Solar Cycle Model failed totally when predicting colder temperatures for more information and more plots.
The lead author Jan-Erik Solheim and his two co-authors are members of the Scientific Advisory Board in an organization run by climate deniers in Norway. Some months ago Solheim wrote on their web site (in Norwegian) that solar cycle 25 has started. He did not mention his failed predictions for solar cycle 24. On the contrary, he wrote about the connection between solar activity and the climate, about the little ice age caused by low solar activity, and that it will be exciting to see if low solar activity in this century will cause a colder climate. He has obviously not learned from his failed predictions for solar cycle 24.
References
1. Solar Activity and Svalbard Temperatures
Jan-Erik Solheim, Kjell Stordahl and Ole Humlum.
2. The long sunspot cycle 23 predicts a significant temperature decrease in cycle 24
Jan-Erik Solheim, Kjell Stordahl and Ole Humlum.
- CO2 increase is natural, not human-caused
Feneley at 22:16 PM on 6 January, 2019The arguments presented are helpful and fairly comprehensive, but I was surprised the author, dana1981, did not address what, in my view, is the most important scientific publication on this issue: “The phase relation between atmospheric carbon dioxide and global temperature” by Ole Humlum, Kjell Stordahl and Jan-Erik Solheim in Global and Planetary Change 100: 51-69, 2013. These authors showed, using published temperature time series from multiple sources and global CO2 and anthropogenic CO2 data that, for the years 1980 to 2011:
1. There was a good temporal correlation between global CO2 and ocean temp, land temp, global temp and lower troposphere temp BUT the global CO2 FOLLOWED the ocean temp, then the land temp, then the lower troposphere temp, in that order, with lags of 9-12 months.
2. In contrast, there was poor temporal correlation between anthropogenic CO2 emissions and both global CO2 and temperature.
3. While anthropogenic CO2 was emitted overwhelmingly from the northern hemisphere, the time sequence of ocean temperature variation commenced in the Southern Hemisphere, reasonably close to the equator, then spread north and south to the poles, always preceding the global CO2 time sequence.
These carefully determined temporal sequences and correlations, based squarely on the published temperature and CO2 data, clearly indicate a causal sequence in which global temperature changes PRECEDE global CO2 changes by 9-12 months, commencing with changes in the ocean surface temperature, then the land temperature, then the lower troposphere temperature. These observations are the complete OPPOSITE of what should be expected if anthropogenic CO2 emissions were driving both the global CO2 levels and then causing a secondary increase in temperatures.
So, while I appreciate the energy balance and other arguments advanced above, causality requires a demonstrated temporal sequence of changes that the data I describe here simply do not support. I would be very interested in your explanation for these observations.
- Temp record is unreliable
MA Rodger at 19:42 PM on 26 July, 2017Mike Evershed @427.
For anyone who takes the time to examine Humlum's work, it is evident the man is a prolific source of nonsense and that he does not take any rebuttal seriously because he doesn't care. Note his Figure 3 on the web-page providing your primary quote - it is addressed in this SkS rebuttal here but in response Figure 3 has not been properly corrected by Humlum. Rather, now we find his Figure 3 is simply "not showing the post Little Ice Age temperature increase."
The logic of the Humlum quote you present @422 is making three assertions. Firstly that it is difficult to create "a meaningful global average temperature" and while the word "meaningful" is a bit odd, it is correct to say that it is not a trivial task to create a global surface temperature record. But, as shown in the links @423Response, this work has been done.
Secondly, Humlum references Essex et al (2006). Yet Humlum does not set out in any way what it is in this paper he is referring to. He says it is "an interesting discussion of the whole concept of calculating an average global temperature" and that "a re-read of Essex et al. 2006 might be worthwhile." The reference by Humlum is thus nonsense.
Thirdly, Humlum argues that OHC is a better measure of global temperature which all would agree is true.
So, stripped of its nonsense, Humlum's quote is not supporting your suggestion that there is "some uncertainty around the long term rate of the warming," that is uncertainty beyond that declared within the work that created them.
- Why the Republican Party's climate policy obstruction is indefensible
scaddenp at 06:45 AM on 9 July, 2017Climate4You is Ole Humlum's misinformation organ.
- Just who are these 300 'scientists' telling Trump to burn the climate?
Nick Palmer at 00:31 AM on 2 March, 2017I thought I'd see how many of the usual suspects were in it. Interestingly, I didn't find Christy or Peiser in there...
ABDUSSAMATOV, Habibullo Ismailovich
ANDERSON, Charles R
BALL, Tim
BARTLETT, David
BASTARDI, Joseph
BELL, Larry S
BOEHMER-CHRISTIANSEN, Sonja A
BRIGGS William M.
D'ALEO, Joseph S.
DOUGLASS JR.
DYSON, Freeman
EASTERBROOK, Donald J.
EVANS, David M. W.
HAPPER, William
HUMLUM, Ole
IDSO, Craig
LEGATES, David R.
LINDZEN, Richard
MANUEL, Oliver K.
MISKOLCZI, Ferenc Mark
MOCKTON, Christopher
MOORE, Patrick
MORNER, Nils-Axel
MOTL, Lubos
SCHMITT, Harrison H.
SINGER, Fred S.
SOON, Willie
SPENCER, Roy W.
WHITEHEAD, David - The oceans are warming so fast, they keep breaking scientists' charts
Esop at 06:06 AM on 23 January, 2015The interesting thing is that over the fast 5 or so years, the deniers have willingly painted themselves into a corner by forecasting anything from mild to dramatic cooling. I can't count the number of times that I asked deniers back in 11/12/13 what their explanation would be when 2014 or 15 would break the record. The answer was always the same: It is cooling.
Back in 2011 or 2012, Norways #1 newspaper ran an article that contained an interview with top ''skeptic'' Ole Humlum, regurgitating the same old denialist mantras, with the mandatory predictions of rapid cooling due to record low solar activity in the coming years, negative PDO and the other usual suspects. I emailed the journalist (and got a response) and told her to do a follow up interview with Humlum & co in 2014 or 15, when the record would likely be broken. I' m not holding my breath, though, even though she might start thinking when the very confident prediction of a layman beat the predictions of her assembled her hand picked panel of ''experts'' (Humlum and (AGW ''skeptic'') solar physicists).
With leading denialists having for years predicted rapid cooling due to natural drivers, but what we instead have seen is more warming, will this wake up at least some of the ''skeptics''? Of course not the paid, pro level guys who know perfectly well what they are doing, but will some of the useful idiots now slowly start to wake up, and what will the implications be?
Will they turn quiet, or will they stand their ground and keep on denying, or will they turn against those that have fooled them for so long?
- CO2 lags temperature
MA Rodger at 06:40 AM on 26 February, 2014An interesting collection of denialist writing being linked @430 (Shaviv, Scarfetta & Solheim-Stordahl-Humlum). I'm not sure what we are supposed to make of them.
The different ilk of "It's the sun wot done it" messages are together rather contradictory. Shaviv's the one who tries to demonstrate ocean heating has an 11-year cycle, good ole Scarfetta fits global temperature to pretty-much every pulse-beat in the solar system with the one exception of the 11-year solar cycle, and the not-to-be-outdone Humlum in that linked paper fits Svalbard temperatures to the duration of the previous solar cycle.
And the other puzzle is - What has this collection of tosh got to do with the subject of CO2 lagging temperature? Anybody any ideas? - New study by Skeptical Science author finds 100% of atmospheric CO2 rise is man-made
Eyal Morag at 15:34 PM on 8 June, 2013Real Climate - On Humlum et al.
Humlum find a connection between ENSO and CO2 But don't understand his findings. C. D. Keeling and R. Revelle find and understand this connection at 1985.
El Nino’s effect on CO2 causes confusion about CO2′s role for climate change
Rasmus E. Benestad - Real Climate 11 September 2012
Anyway the same level of logic can find that temp don't connect to CO2 since every year from October to January the CO2 is rising while temp is falling. Just ignore the 1st & 2nd order of CO2 and temp rising.
- New study by Skeptical Science author finds 100% of atmospheric CO2 rise is man-made
CBDunkerson at 22:05 PM on 7 June, 2013Mark, while the publication of your analysis is a wonderful response, I have to look at this Humlum paper and others like it with a growing sense of dread. It seems to me as if 'alternative realities' are creeping into science just as they have into politics, journalism, law, economics, and other formerly respectable fields.
How could this Humlum paper have gotten through peer review? Why would Global and Planetary Change publish it? How can the universities that employee the authors not be embarrassed to be associated with this?
I always thought that science was largely resistant to falsification because bad results would inevitably be uncovered and damage the credibility of all involved. Yet we seem to be seeing a lot of clearly wrong analysis getting published and no particular fallout when it is uncovered. Indeed, I doubt the denialsphere will stop praising Humlum in light of your findings... rather they will continue to accept his as valid and reject yours... creating two different views of reality. A situation I view with horror.
Obviously, there has always been fringe 'science' and from time to time it has gotten published... but am I wrong in believing that things have changed in that we are now seeing it actively celebrated and promoted even in the face of proof to the contrary? I fear a future in which publishing bad science can be a path to greater carreer success. Rupert Murdoch's News Corporation routinely puts out false propaganda in the guise of journalims... and is beloved for it. Radical ideologues routinely get appointed to the highest courts despite rulings bearing no resemblance to legal precedent or justice. Raving lunatics frequently get elected to high political office. The whole world is suffering from the guidance of economists who promoted austerity during a massive global recession.
If this kind of madness takes hold in the sciences we are truly doomed.
- Temp record is unreliable
Dikran Marsupial at 00:52 AM on 8 February, 2013Kevin, climate4you is run by Ole Humlum, who has written a number of deeply flawed papers on climate science, so pointing out that the plot originates from climate4you rather than WUWT does not make it any more authoritative. This doesn't mean that the plot is incorrect, but it is good cause to be skeptical.
- Ridley, Murdoch, and Lomborg Attempt to Greenwash Global Warming
Kevin C at 02:18 AM on 19 January, 2013
Terranova: You are certainly thinking along the right lines. There is a long literature on the relationship between El Nino and/or temperature and CO2 uptake, e.g. Barcastow 1976. The rate of CO2 change in the atmosphere lags the temperature change, showing that temperature or El Nino are driving the effect.
This has fooled some skeptics who haven't read this literature (e.g. Humlum) into thinking that temperature is causing CO2 emission, when in fact the emissions have been more steady and the rate of uptake has varied. - Solar Cycle Model fails to predict the recent warming
MA Rodger at 00:50 AM on 20 December, 2012
These two papers by Solheima Stordahlb & Humlum are classics of the genre - nonsense presented to look like scientific argument. The graph-fest presented in The long sunspot cycle 23 predicts a significant temperature decrease in cycle 24 was the first to be written although the last to be published (allowing both papers to reference each other).
As yet, the authors haven't quite perfected their style. In this first paper they are quite insistant that just "looking at" their graph of sun cycle lengths "tells us that we can expect several long cycles in the next decades" which their analysis says is indicative of very low NH temperatures.
What is remarkable by its absence in these two papers is intelligent comment about the temperature records since Sun Cycle 23 ended. These are the ones that will contribute to the low average temperatures they are predicting for Sun Cycle 24.
The nearest they get to such a comment is in their second paper Solar Activity and Svalbard Temperatures where they suggest a small drop in Winter temperatures in 2009 &10 may point the way to their predicted freeze up. Yet this 2009/10 Winter record is hardily even a straw to grab onto.
These jokers are predicting Svalbard temperatures will drop "from −4.2°C in SC23 to −7.8°C, with a 95% confidence interval [−5.8 to −9.6]°C in SC24." This is their grand finding, the whole reason for the paper. And why not? Svalbard's annual and winter mean temperatures "are completely described by the PSCL-model" that they created.
To achieve this lower annual mean, given the 2009-2011 mean at −3.76°C is even higher than the mean for SC23 (also noting the all-time record high for winter 2011-12) and also given the last 12 months could be taken as a reasonable value for the 2012 mean temperature (−1.87°C which would be the second highest annual mean on record), then the average over the remaining years of Sun Cycle 24 to achieve the temperature drop forecast by our trickster trio would have to be −10.4°C, with a 95% confidence interval [−7.6 to −13.2]°C.
If you bear in mind the coldest single year on record for Svalbard (from 1912) is −10.4°C, never mind "even less likely," can we really take these jokers seriously? - How to Solve the Climate Problem: a Step-by-Step Guide
M Tucker at 03:07 AM on 14 September, 2012
Depending on “media” is the huge shortcoming of the educational approach. The average reporter, either print, TV or even NPR (here in America), has, for the most part, the same shortfall in science education as Americans in general. Even those reporters who have graduated from prestigious universities are not qualified to investigate science issues. We do have some very good science reporters who have studied science and who regularly report on scientific issues but they are definitely not mainstream. They appear in science magazines or occasionally are printed in newspapers. Even NPR only has one program a week, two hours only, that is not available on all public radio stations and if available they may only run one of the two hour segments. The last time I heard an interview on one of my local public radio stations with Michael Mann a disappointingly large fraction of the callers were parroting the same old denier hogwash we have all heard for years. Michael Mann did a good job of defending the science but the host had little to add and his questions revealed a clear misunderstanding of the science. If he had read “Dire Predictions” the important bits did not sink in.
Also we are still dealing with scientists who actually have positions in climate science at universities who reject the scientific consensus. Christy immediately comes to mind. So reporters do not need to use someone like Watts to present the opposing view they can get Dr. John Christy Director of the Earth System Science Center at the University of Alabama. That sounds pretty impressive to someone, even the reporter, who is not familiar with the debunking of Christy’s opinions. Then we have people like Humlum who manage to get worthless papers published in respected science publications.
I listened to a report on NPR today, by a seasoned reporter, who managed to completely miss an opportunity to educate the listeners on a critical piece of the story. I was dumfounded. I will not go into the whole thing but simple important information can be completely overlooked by both the reporter and her editors when reporting on science or, in this instance, health and nutrition.
I have no good solution for this other than depending on actual qualified educators and increasing the science requirements in public schools. After all, not everyone will continue with schooling past high school. - Murry Salby's Correlation Conundrum
Doug Bostrom at 03:46 AM on 13 September, 2012
An excellent comment at RC by Christoffer Bugge Harder, pointing out the failure by Humlum et al. to account for carbon isotope ratios and C02 uptake in the ocean that can only be termed as blatant disagreement with their hypothesis.
Comment is here.
Harder's final suggestion applies to a number of scientists who have compromised themselves over AGW. The scientific community as a whole could be of better assistance to the public in evaluating outlandish claims. Crank or liar? Sometimes choices funnel down uncomfortably tight; charitable instincts suggest the former as opposed to the latter. - CO2 lags temperature
Rob Painting at 20:43 PM on 31 August, 2012
David Sanger - this is much easier if you understand that the oceans are Earth's main heat reservoir. Arguably the greatest climatic effect greenhouse gases exert is that they trap more heat in the ocean.
During La Nina the oceans accumulate more energy - as heat is buried in the sub-surface ocean, and during El Nino this heat wells to the surface and is smeared across the central and eastern equatorial Pacific. Due to these characteristics, and the surface air-sea exchange of heat, the Earth is cooler-than-average during La Nina, and warmer-than-average during El Nino.
But there's more to the story, there are two large competing effects on carbon exchange during ENSO. In a La Nina phase upwelling of acidified deep water along the western coast of North & South America out-gasses CO2 to the atmosphere. But this is more than compensated by the wetter-than-average rainfall which falls over the continents and particularly the tropical river basins of the world. More rainfall over such a vast land area generally means more plant growth and a draw down of atmospheric CO2.
During El Nino the much of the continental land surfaces are drier-than-average. This is because the upwelled heat on the Pacific equatorial ocean surface draws moisture away from the continents, and rainfall is focused over the ocean. CO2 out-gassing may shut off, but again this is more than compensated for by land vegetation. As drought sets in on the continents, vegetation dies and CO2 is released back to the atmosphere. Warming air temperatures also elevate respiration which, again, releases more CO2 back to the atmosphere.
These natural short-term CO2 fluxes dwarf human fossil fuels emissions, but unlike fossil fuel pollution they do not increase incrementally year after year.
It is, of course, more complicated than that. For example the distribution of rainfall is vitally important, but that is the general picture. Armed with that knowledge you can now under see that Humlum & co aren't telling us something we don't already know. They just lack understanding of the physical mechanisms which drive this and, allied to ideological bias, therefore come to conclusions unsupported by the evidence.
As for large volcanic eruptions - they can reduce atmospheric CO2 because they stimulate enhanced plant growth on a global scale. This is accomplished by the volcanic aerosols high in the stratosphere increasing light-scattering which more readily penetrates the leaf canopy. In the absence of other limiting factors, more sunlight equals more growth and hence draw down of atmospheric CO2. You can see this in the graph you presented - after the Mt Pinatubo eruption (1991) even the El Nino of 1991-92 saw a decline in atmospheric CO2 - the opposite of the normal response. - CO2 lags temperature
skywatcher at 14:38 PM on 31 August, 2012
David, all that graphic shows is that detrended air temperature, which is mostly ENSO and occasional volcanic influences, is related to detrended CO2 with the annual cycle removed too. So there is a relationship betweent he variability of both graphs, no surprise there. It says absolutely nothing about what is causing the overall rise in either one, though clearly the skeptics would want you to believe that ocean temperature rise is causing CO2 rise.
They ignore many things:
1: what is causing ocean temperature to rise?
2: why is ocean pH decreasing, if CO2 is being released from the oceans (which should cause pH to rise)?
3: Where is all our CO2 going? We release ~30GT per year, yet annual CO2 rise is only half that. [the truth is that it is going into the oceans, acidifying them.]
4: As linked above, the chemical signature of the CO2 is that from FF-derived carbon, shown by several independent lines of evidence.
So lots of suspension of disbelief required before you can accept the Humlum paper. In fact, I suspect I'll find the suspension of disbelief when watching The Hobbit later this year a whole lot easier! - Solar Cycle Length proves its the sun
scaddenp at 06:16 AM on 30 March, 2012
tompinlb - there is absolutely no doubt that the climate responds to changes in solar activity and that solar has been major influence in the past. The problem with the solar explanation for current warming is that the solar signal is more or less flat, unlike the past. Solar proponents ask us to believe that a warming comparable with holecene climatic optimum in NH is happening in both hemispheres but without the same solar signal. The signal is consistant with GHG forcings and completely out of scale to other mechanisms. Furthermore, there is the problem of explaining why the measured increase in GHG forcing somehow is not involved in the warming. Do you have a problem with the instruments doing the measurements?
The idea that actual temperatures have "increasing diverged" from IPCC models is just denialist posturing. Some detail can be found here. Furthermore the Rahmstorf and Foster paper reveals the signal more clearly when natural variation is removed. While the natural variation estimates are indeed curve-fitting, the scale of change in the natural forcing considered (temperature diff compared to change in energy), is believable from physics point of view (unlike humlum's effort). - New research from last week 10/2012
Flakmeister at 10:02 AM on 15 March, 2012
JE Solheim as in
http://junkscience.com/2012/03/14/solheim-the-long-sunspot-cycle-23-predicts-a-significant-temperature-decrease-in-cycle-24/
and yes that Humlum... Ole! Ole!
Seems I just got my self banned from junkscience for having the temerity to rip apart (using facts nicely, I might add!) every posting on oil/energy over the past few days...
I guess you are not allowed to respond to Milloy calling Obama a Marxist...
And saying Inhofe is a hypocrite for not adhering to Isiah might not of helped...
;-) - New research from last week 10/2012
KR at 07:43 AM on 15 March, 2012
Flakmeister - Which paper, which Solheim? Note that there is a JE Solheim who frequently works with Dr. O. Humlum, whose papers have been roundly criticized and refuted. - Is there a case against human caused global warming in the peer-reviewed literature? Part 1
skywatcher at 08:34 AM on 10 November, 2011
Chris Shaker, Ole Humlum's been publishing for a great many years, often not specifically on climate, or specifically skeptical of it. If the article is not explicitly negative or doubtful of human-caused global warming, it's not icluded, so nearly all Humlum's papers don't count for this purpose.
Recently he's become prominent in Norway as a skeptic, and regrettably he seems to have dropped his previously excellent science standards along the way. Humlum's most recent paper probably does count for the list; sadly it's a tragic case of regional curve-fitting climastrology that has little basis in science. That fits nicely with the list above. - Is there a case against human caused global warming in the peer-reviewed literature? Part 1
cjshaker at 08:15 AM on 10 November, 2011
How sure are you that this list is accurate?
Just looking at Dr. Ole Humlum. He is listed as having 0 peer reviewed papers which cast doubt on the AGW hypothesis.
Found a list of his peer reviewed papers. He has 86 of them, according to this reference:
http://www.climate4you.com/Text/BIBLIOGRAPHY%20OLE%20HUMLUM.pdf
I find something that looks like 'CO2 hypothesis' in several of them.
Chris Shaker - Crux of a Core, Part 3... Dr. Ole Humlum
KR at 03:09 AM on 5 October, 2011
citizenschallenge - That site, and Ole Humlum in general, have been discussed here. Search on "Humlum", which will take you to here, here, or here.
Ole Humlum has repeatedly focused on the GISP2 core (a local record), leaving out or incorrectly matching the recent instrumental record, cherry-picking short time frames, and in general making a hash of the data to support his "it's not happening" points.
Rob Honeycutt's Crux of a Core series addresses this topic quite thoroughly. - Are you a genuine skeptic or a climate denier?
KR at 01:33 AM on 2 June, 2011
J. Bob - I thought some of the data on the climate4you site looked familiar. It's run by Ole Humlum.
See the two threads on Humlum's previous work here and here. His data is heavily cherry-picked to present a particular point of view, which is exceedingly poor science.
As you yourself have noted, it's worthwhile to consider the presenter and the quality of their scientific endeavors. Sites like climate4you, jonova, co2science, WUWT, ClimateRealists, ClimateAudit, and the like are much less credible as a result - their past work (to put it somewhat politely) stinks. - There's no correlation between CO2 and temperature
Tom Curtis at 23:55 PM on 16 May, 2011
michaelkourlas @6:
First, as Dr Humlum knows very well, the temperature record of any single site makes a very poor proxy for global temperature. Any such site will always show far more variability than a true global temperature because other locations across the globe will not warm or cool synchronously with the first location. This is easily seen in the following graph of several proxies for temperatures at individual locations during the holocene:

As you can see, the individual temperature proxies are all over the place, and the GISP2 record (light blue), which shows four of the five highest peaks, is probably the most variable amongst them.
Of course, as you can also see, if you take an average of the individual records there is very little remaining variability, compared to that of GISP2 alone. Indeed, taking a multiple proxy mean shows global temperature variability to be confined to a 1 degree C range, not the 2 degree C range Dr Humlum would have you believe.
The multi-proxy mean is not the best reconstruction. This is so because it treats individual site specific reconstructions as of the same value as multi-proxy regional reconstructions; and also because of the eight reconstructions used in this case, only two are from the tropics (33% of the Earth's surface), only two from the Southern Hemisphere extra-tropics, in both cases from Antarctica, and the other four are from the Northern Hemisphere extra-tropics. Without this Northern Hemisphere bias, it is likely the reconstruction would show even less variability.
As can be seen from the diagram below, Dr Humlum chose to compound the misleading choice of a very variable single site proxy by using global mean temperatures (which because they are a global average have low variability relative to single sites) to represent the modern era. In this way the false impression is created that modern global temperature temperature change is much less than past episodes, whereas modern global temperature are at levels rarely if ever exceeded in the Holocene.
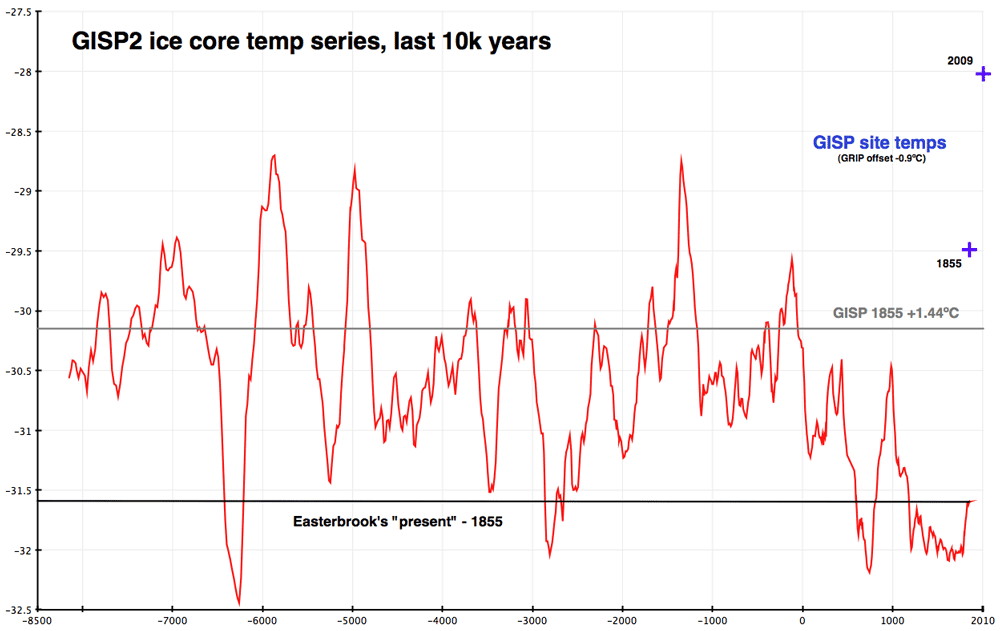
Second, the range of CO2 levels over the Holocene as shown by the Epica core is just 20 ppm. A increase of CO2 from 260 to 280 ppm will result in an increased forcing of just , and a temperature increase of just 0.4 Watts/m^2, and a temperature increase of just 0.32 degrees C. That is significant enough, and may well be why the Holocene has not slid into another glacial, unlike the previous inter-glacials. But it is certainly not enough to swamp the many forms of natural forcing, being of a similar magnitude to changes in solar forcings over the last two thousand years, and smaller than changes to volcanic forcings.
So, to summarize, variation in Holocene temperature is much smaller than Dr Humlum purports it to be, and CO2 variation is sufficiently small for non-CO2 forcings to be the primary drivers of temperature in the Holocene. Dr Humlum knows this. I wonder why he does not mention it? - Crux of a Core, Part 3... Dr. Ole Humlum
Bjarne Mikael Torkveen at 05:46 AM on 2 April, 2011
Being a Norwegian citizen, I know how the Norwegian climate deniers operate. Ole Humlum is a climate denier in the true meaning of the term. He is not as flexible as Rob Honeycutt might think. Don't be fooled by his "charm", Rob. He likes to spread confusion and misrepresentations. His favourite arguments are: "Global warming stopped in 2000", "it's the sun" and "it's cosmic rays". As the majority of the audience on this site speaks English, I can only supply a limited amount of articles featuring Humlum, but here's one: "Another Unfortunate Truth – Global Warming Stopped" - CO2 effect is saturated
Norman at 17:28 PM on 11 November, 2010
#57 scaddenp
The person who runs Climate4you, has a lot of peer-reviewed publications. - It hasn't warmed since 1998
michaelkourlas at 13:52 PM on 26 January, 2010Look at this link for information on global warming stagnation since 2002: LINK The site is run by Ole Humlum, Professor of Physical Geography at the Department of Geosciences, University of Oslo. He says that "all five global temperature estimates presently show stagnation, at least since 2002. There has been no increase in global air temperature since 1998, which was affected by the oceanographic El Niño event. This does not exclude the possibility that global temperatures will begin to increase again later. On the other hand, it also remain a possibility that Earth just now is passing a temperature peak, and that global temperatures will begin to decrease within the coming 5-10 years. Only time will show which of these possibilities is the correct."
- Empirical evidence that humans are causing global warming
Robbo the Yobbo at 09:44 AM on 20 October, 2009
Steve,
The conclusions depend a great deal on whether you use monthly or annual averages. I always use monthly data because the annual data averages out the interesting peaks.
Compare the 2 at Professor Ole Humlum's page.
http://www.climate4you.com/ - polar temperature page.
So really you are absolutely right about Arctic temperature - but everything needs to be seen in the appropriate context.
The difference is a small example of claim and counter claim in a highly polarised debate - or non debate depending on your perspective. Are the differences scientifically meaningful? The answer to that is no.
‘Over most of the past century, the Arctic Oscillation alternated between its positive and negative phases. Starting in the 1970s, however, the oscillation has tended to stay in the positive phase, causing lower than normal arctic air pressure and higher than normal temperatures in much of the United States and northern Eurasia.’
http://nsidc.org/arcticmet/patterns/arctic_oscillation.html
Yes I know I said that eyeballing was OK – but you need more context.
These are very complex issues - you can’t do a quick Google and cheery pick items that seem to support some sort point or other. But look carefully at your Arctic temperature graph – the peak in the 1940’s is the result of multidecadal modulation of temperature in the Arctic.
I am morally constrained from gambling with you on this – I think it is a sucker bet.
Cheers
Robert - How do we know CO2 is causing warming?
Robbo the Yobbo at 13:11 PM on 11 October, 2009
I will add a couple of additional sources that address decadal climate variation – by Dr Syun Akasofu and Professor Ole Humlum.
http://wattsupwiththat.com/2009/03/20/dr-syun-akasofu-on-ipccs-forecast-accuracy/
- a reasonable summary
http://www.iarc.uaf.edu/people/indiv/iarc_all_staff.php?photo=sakasofu
- home page of Dr Akasofu
http://www.climate4you.com/
- home page for Prof. Humlum
The planet isn’t currently warming and the IPCC is a political stuff up rather than a credible scientific oganisation. - Climate time lag
Robbo the Yobbo at 13:18 PM on 16 July, 2009
Let’s have another quick look at clouds. There is a lot of useful data on Professor Ole Humlum’s homepage at: http://www.climate4you.com
There are records of clouds from 1985. They show declining cloud cover to the turn of the century and increasing thereafter.
Goode et al 2009 (can be found on the bibliography page of Project Earthshine – show this as albedo changes of a decrease in Earth albedo of 1% (additional shortwave of 3.5 W/m2) and an increase after 1999 of 0.75 % (less shortwave at the surface of 2 W/m2).
High and low cloud in the climatically important equatorial zone declined to 1998 and increased thereafter.
While the causes are not clear, it seems clear that 1998 marked a transition in biological, oceanographic and climate systems. Transitions occur in the instrumental and proxy records on a 50 year cycle – and it is interesting to consider a heliospheric /cloud connection. It may be that the cycle is a mode of internal dynamic variability that result in cloud changes. - Climate time lag
Robbo the Yobbo at 10:14 AM on 14 July, 2009
Do cloud affect climate? Without a doubt. The ISCCP-FD reconstruction shows decling cloud cover to 1998 and increasing cloud cover since.
This can be seen on Professor Ole Humlum's website. A great source for up to date climate data.
http://www.climate4you.com/ClimateAndClouds.htm
In the climatically important equatorial zone. Both high and low cloud cover decreased to 1998 and have increased since then explaining some of the global heat trends - particularly the perplexing mystery of the lost heat since 1998.
I also note an updated sea level graph on the ocean page graph showing a decline in annual sea level since 1998. And before anyone quibbles - check the ocean heat storage in Figure 2 above. Now I am confused - it is based on the (gold standard)University of Colorado data but looks entirely different because it averages the 10 day readings over a year.
I am now wondering whether this has something to do with the hydrological cycle. A global increase in water vapour and rainfall - driven by higher sea surface temperature after the mid 1970's. A problem for Ron (lateron - for those unfamiliar with Australian colloquialism - Blind Freddy has offered to lead a seminar).
Ah complexity - thy name is climate science.
Is there a connection of cloud with the 11 year solar cycle? All I know is that clouds have changed and that there is a long term correlation of cosmogenic isotopes and global temperature.
If clouds change back around 2024, I will be surer of a cloud cover and a cosmic connection to the Pacific Decadal Oscillation and multi-decadal ENSO modulation. I am pretty sure there are 50, 1500 and 100,000 year (approximately) climate cycles.


THE ESCALATOR

(free to republish)