


 Arguments


Was 1934 the hottest year on record?
What the science says...
| Select a level... |
 Basic
Basic
|
 Intermediate
| |||
|
1934 used to be the hottest year on record in the USA. However, the USA only comprises 2% of the globe. What about the other 98%? According to NOAA temperature records, as of 2024, the hottest years on record globally were 2016 and then 2023, the latter year's temperature smashing the record by a wide margin. |
|||||
Climate Myth...
1934 - hottest year on record
Steve McIntyre noticed a strange discontinuity in US temperature data, occurring around January 2000. McIntyre notified NASA which acknowledged the problem as an 'oversight' that would be fixed in the next data refresh. As a result, "The warmest year on US record is now 1934. 1998 (long trumpeted by the media as record-breaking) moves to second place." (Daily Tech).
At a glance
Let's not shy away from the fact that in the contiguous United States, the year 1934 was particularly warm. It was among a cluster of years marked by the notorious droughts known as the 'Dust Bowl' years, during which huge dust-storms were frequent and did great damage to the soils of the Prairies.
But how significant is 1934 in the bigger, global picture? Let's take a look.
The background to this tale involves the NASA GISS temperature dataset. In August 2007, blogger Steven MacIntryre noticed a series of sudden temperature leaps in that dataset. They had occurred early in the year 2000, leading some to speculate that the Y2K computer bug must have been behind them.
NASA investigated. The data used for the NASA GISS record are from the National Oceanic and Atmospheric Administration (NOAA). NOAA had adjusted the data to filter out spurious excess warming. Sources of such biases are well-known. They include time of observation, non-ideal siting of weather-stations, relocation of them and urban heat island effects.
The specific error was nothing to do with Y2K. It was simply that, from January 2000, NASA were mistakenly using unadjusted data, so all those spurious anomalies were still in there and it looked warmer than it should.
Nobody's perfect and that includes scientists, but science is a self-correcting process. Errors that do occur are corrected when found. Correcting this specific error meant that some six years of temperature data had to be adjusted downwards. That meant that the order of the warmest years was also affected and after adjustment, 1934 and its Dust Bowl heat once again stood out prominently.
That's what happened back then, in a nutshell. Now to look at 1934 in context, with the added benefit of another 17 years of hindsight, of course.
Firstly, the corrected temperature record covered only the Lower 48 - the states of the USA excluding Alaska and Hawaii - where 1934 was indeed a very hot year. Zooming out of the USA - making up around 2% of the world's surface - to the whole globe, however, shows that 1934 was in fact a rather chilly year. In order to understand what's happening to global temperatures, the whole globe - the other 98% - also needs to be considered, year in year out.
Secondly, it may have been possible to attempt crudely dressing-up 1934 as another 'final nail' in the 'global warming coffin' in 2007, but no longer. If you now look at the global league-table of warmest years, the ten hottest of them have occurred since 2010, with 2023 being just the latest record-breaker.
The year 1934 was a very warm one in the United States. No-one disputes that. In fact, it's meteorologically quite interesting. The Dust Bowl years are thought to have been at least partly human-caused - by poor agricultural land-management. But the way temperatures have gone now, 1934 is merely of local, historic importance: a curio to look back at from time to time - and a warning to look after your topsoil!
Please use this form to provide feedback about this new "At a glance" section. Read a more technical version below or dig deeper via the tabs above!
Further details
In the NASA GISS temperature dataset, for the period 2000-2006, unadjusted NOAA records were erroneously included, thereby incorporating sources of bias making the record warmer than it should have been. This error was spotted by blogger Steve McIntyre in August 2007 and after investigation it was corrected by NASA. But the error immediately got people talking in certain quarters, with a particular focus on one year: 1934.
The year 1934 was a very hot year in the United States: in 2017, it still ranked sixth behind 2012, 2016, 2015, 2006, and 1998. It was in fact part of a series of hot dry years that are referred to as the time of the Dust Bowl. This severe crisis of historic proportions was caused by a combination of natural factors, especially severe drought, and human-made ones. In particular, it was the widespread failure to apply farming methods appropriate to dry elevated plains, such as ways to prevent wind erosion, that made a bad situation worse. Nature did the rest.
Natural topsoil is a precious resource indeed and they managed to lose much of it in a series of huge dust-storms. Strong winds are not uncommon over the Great and High Plains and land use has to be designed with resilience to them born in mind. The drought occurred in three main waves that took place in 1934, 1936, and 1939–1940. Some regions of the High Plains experienced drought conditions for as long as eight years.
As bad as the Dust Bowl years were, global warming takes into account temperatures over the entire planet, including the oceans. In any case, the land area of the U.S. Lower 48 accounts for only 2% of Earth's total surface area. Despite the U.S. sweltering in 1934, that year was not especially hot over the rest of the planet, as you can see on the 1934 map in fig. 1 (below). Globally, 1934 temperatures were actually cooler than average for the 20th century.
1934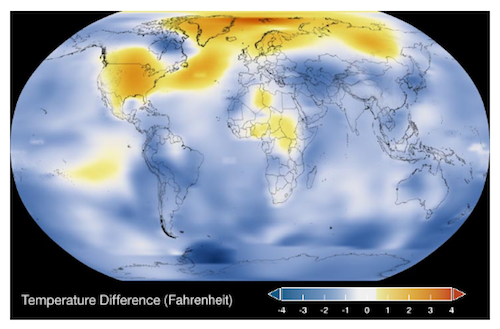
2022
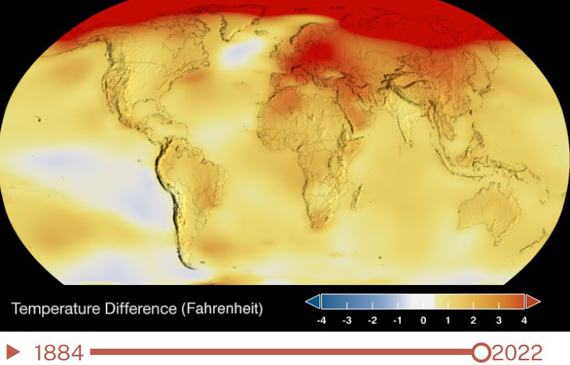
Figure 1. Global temperature maps for 1934 (top) and 2022 (bottom). Source NASA.
Science deniers pointing at 1934 as 'proof' that recent hot years are not that unusual are wrong, for several reasons. Apart from anything else, science does not set out to prove things: it presents evidence and develops hypotheses to explain things. That aside, the key sin here was the choosing of a single warm year (1934) in a single country (USA Lower 48) to make a talking-point about a phenomenon that is global in its nature and reach. That is an obvious example of the fallacy of 'cherry-picking' - waving around a single fact that supports a dubious claim and thereby ignoring the rest of the data (i.e. the rest of the world - fig. 2). It's essential to step back and look at the bigger picture at all times. Anyone failing to do that by cherry-picking out single years in single places is not behaving in a scientific manner.
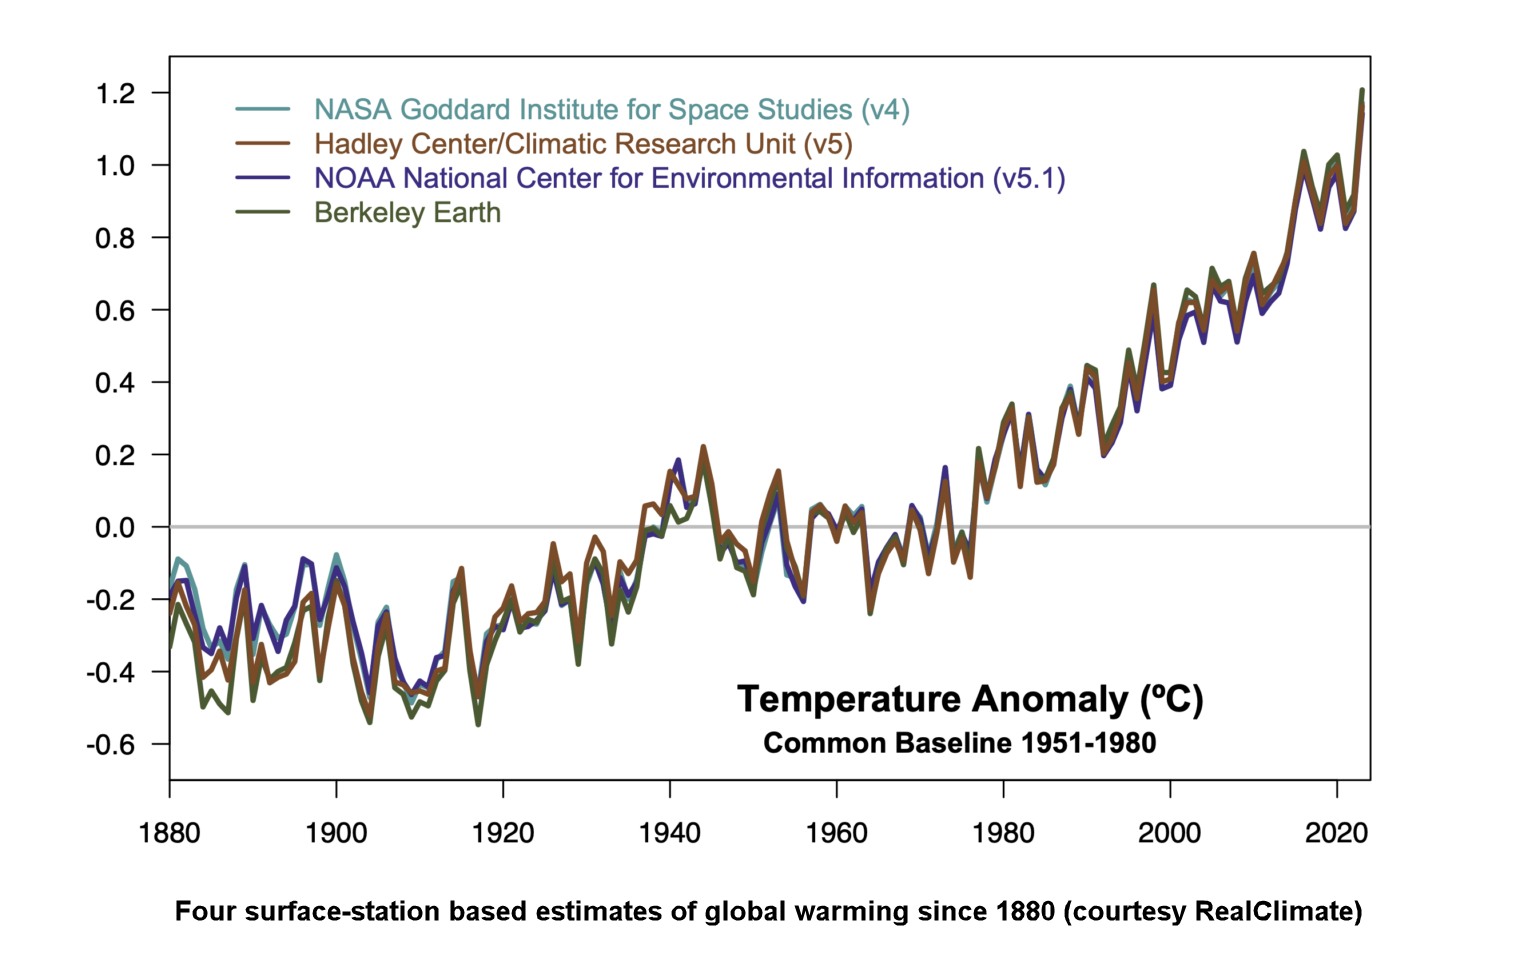
Figure 2: Multiple independent global surface temperature products show a very coherent pattern of temperature change over the 1880-2023 period. While there is overlap in the weather station inputs and ocean data, the methods for correcting for missing data, inhomogeneities, spatial sampling etc. are independent. Graphic: Realclimate.
Regional and year-to-year temperature variations will always occur. Our climate is noisy like that. The reason we are so worried about climate change is not because of a single extreme in one place on one date. It's the long-term average trend, over the entire world. That trend shows an undeniable increase in global surface temperatures and global ocean temperatures. As of the time of writing (May 2024), the years 2023, 2016, 2020 and 2019 are the hottest on record. So far.
This rapid global heating is dramatically altering the planet we live on and we don't have a spare. If there's one thing 1934 should always remind us about, though, it is the consequences of not looking after our home. That's what the history books will recall about the 1930s on the prairie-lands.
Last updated on 9 June 2024 by John Mason. View Archives


LTO - If you are so concerned regarding the infill for certain regions in 1934 (an argument I find quite thin; the correlation strengths for those infills are well tested and established), then by all means simply compare the sampled areas in 1934 directly with the identical areas in 2016 - ignore the regions of increased coverage. And you will find, as per the OP, that 1934 was warm in a few regions such as the US, but overall the globe wasn't particularly warm (perhaps 0.1C below the 20th century average), and that the last few years are running perhaps 1C above the 20th century average, both in the subset well sampled in 1934 and in the world as a whole.
In short, the climate myth claiming that 1934 was a hot year, and thus attempting to refute general temperature assessments, is both wrong and a bad idea, scientifically speaking.
Given that, just what is your complaint about the OP?
LTO - I looked back through your previous comments in your thread, and found your posting of a thesis by a John McLean, which somehow argues that HadCRUT is wholly unreliable. Is this the same John McLean who in 2011 stated (oh, so incorrectly) that temps were about to return to 1956 levels?
If so, I would humbly point out that he's not a good reference due to past demonstrated errors. His temperature predictions are among the worst I'm aware of.
And here's a discussion of that thesis at 'And Then There's Physics', which points out that the thesis was completed under the direction of two well known climate deniers.
The science in that thesis is lousy, and it's not. a. good. source.
LTO - I agree it would be better if we had side-by-side chart of error-bars, but again, the chart is valid for the purpose. Even with double the estimated error, the essential picture of differences between 1934 and now is unchanged - it is fit for purpose.
As it is, as far as aware from the papers, a "map" of error estimates does not exist. The validation and error estimation methods instead work by latitude-range and sometimes ocean (eg the error bars for north atlantic are less than for north pacific).
KR @102 and @103 ,
you may not have considered the matter: but this thread contains a modicum of internal evidence that Dr McLean and poster LTO have a possible coincidence of identities. Not conclusive of course, for the patterns of thinking are hardly rare in the deniosphere.
[PS] No cyber-stalking. Speculations like this are extremely unhelpful and very unlikely.
I will note that the Cowtan and Way temperature series includes gridded uncertainty measures, for measurements, coverage, etc.
Site here
Moderator @105 , my apologies for speculating on the coincidences.
KR @106 , thank you very much for that Cowtan & Way link. I have usually regarded the so-called "tropospheric" UAH/RSS satellite data as having minimal usefulness in regard to planetary surface temperatures ~ but Cowtan & Way point out that the loose correlation of satellite & surface, can be quite helpful when infilling by kriging or other interpolation methods. Presumably the modern infilling would provide some indirect support for the infilling of the circa 1934 records.
Eclectic - I think Hansen and Lebedeff 1987 really answered the basic infill question, testing temperature correlations and showing that they hold to over 1200km. The gridding in HadCRUT is rather crude, and C&W style kriging is far more accurate, but even the earliest HadCRUT data presents global data worth looking at.
LTO - If you have anything more solid than repeatedly disproven denier articles, or rather paranoid papers that claim any interesting work (ie, anything that hasn't been done to death before) is likely falsified (note: I'm referring to text since deleted by moderators from your post here), which indicates actual problems with infilling using temperature anomaly correlations, by all means point it out.
Barring that, your objections seem IMO to be an Argument from Incredulity.
Looking at the basic chart, it appears that a cooling trend was occurring at the star of the twentieth century. Is there any data showing the beginning of the nineteenth century to compare where that cooling trend started? The chart leads me to question at very quick glance if the globe doesn't just constantly fluctuate in temperature on a doublerise rate meaning that once the average temperature breaks +2 (if I'm reading the degrees right) then it will slowly start dropping until it breaks the -1 and starts warming again.. which based off the flow and consistent rise in your chart would lead me to speculate that the next cooling trend could in fact start around 2030 whether humans do anything to fight global warming or not, meaning that if they do start now "science" will get to claim that they single handedly "fixed" global warming within 10 years..
Map @109 , the chart at Figure 2. shows a very strong warming from about 1975. In the early part of that century, there were some colder years around 1910 ~ but no strong trend 1880 - 1930.
I think you would need to do some careful statistical analysis, to demonstrate a trend there. AFAICT, there's nothing much. Taking a wider swathe of data, pre-1910 , shows a gradual & slight warming trend from mid-Nineteenth Century, but it's rather weak. There are of course fluctuations, from clusters of large volcanic eruptions, or from slight variations in solar output or from El Nino events. All part of the natural random variations . . . plus possibly (and dubiously) some multidecadal oceanic overturning currents (but these are only very slight in their effects ~ if they exist at all, and are not simply figments of imagination as humans indulge their tendency to see "shapes & patterns" in random data points).
Map, I suspect you are "seeing" trends that don't exist.
Weather tends to vary around the cyclic seasonal changes, because it is small-scale fluctuations against a global (hemispheric) background . . . but climate change requires major alteration in global-level gain (or loss) of heat energy over a sustained period of time.
The important point with climate, is that climate does not change unless something causes it to change. That's why the often-seen idea that our modern period of warmth is just a "rebound" from the Little Ice Age . . . is a complete nonsense.
Map , if you wish to step back and look at temperatures of the entire Holocene period, then it becomes apparent that the world has been in a gentle cooling trend for roughly 5,000 years ~ which would have continued (owing to the Milankovitch orbital change) but for the modern strong warming from AGW. The LIA and Medieval Warm Period were only very slight alterations of the underlying cooling trend. But that long term cooling trend has been so gradual as to be invisible on the scale of a few decades or a few centuries.
Your "2030 speculation" is baseless. Even the idea of a possible Grand Solar Minimum is (if it were to occur) something that would be swamped by the ongoing warming effect of rising Greenhouse Gasses.
Map,This: "one-third to one-half of the warming—about 15 degrees Fahrenheit—occurred in about 10 years." Requires citation. Where does it come from?
Over the past million years, the 100,000 years cycle has been the most consistently present in the record. Not entirely clear but it sounds like you may be referring to the Mid-Pleistocene transition
Comment 111 was in response to a comment by Map that is now no longer visible in the thread. ????
[DB] The comment in question was removed for being a Gish Gallop collection of off-topic and grandiose claims. Thank you, for attempting to answer it.
Philippe ~ yes, sorry about that effort on your part.
Our good commenter "Map" was perhaps referring to the local regional temperature changes shown in Greenland's GISP2 ice core during the transient fluctuations of the Younger Dryas . . . and he was trying to imply that they were global climate changes "inexplicable by mainstream climate science". My first thought was that he might have been a newbie, grossly uninformed on the topic . . . though there was a wiff of sly science-denialist argumentativeness in his wording. And the latter case has become more evident (only much less sly! ) .
I am sure I am not telling you anything new in all this, Philippe. I just wished to put it on the record, for later readers who come along.
I was not trying to imply, I am imploring. How is one supposed to learn when a question is deleted as "gosh gallop"? The quote that I had posted was listed in a few diffent sources that I have looked at. I do believe eclectic is correct that they were mostly in reference to Greenland's ice core analysis, however they are still prevelant in this discussion as they refer to a previous time of global warming because excess co2 was found in the core samples with an unknown source of why the co2 was that high. How is that not relevant to today's global warming if we are again seeing a rise in temperature due to co2? Why should that question be dismissed? What caused the rise in co2 to balance out 20000 years ago and slow the global warming back then without humans?
Map:
Accepted science is that total heating since the last ice age is about 4C (7F) over about 20,000 years. In your deleted comment you make the unsupported claim "one-third to one-half of the warming—about 15 degrees Fahrenheit—occurred in about 10 years." That would be a total of 30-45 F obviously grossly too much heating. Since your unsupported claim is completely contrary to science is was deleted. You could link to where you heard this deliberate falsehood and we could explain why that site is misleading you.
In additioin, this thread is about the hot year 1934 in the USA (worldwide it was not an especially hot year). Your comment about ice ages is off topic.
I suggest you read a thread about ice core temperatures. The graph of ice core data looks like this:
Note the time scale on the bottom is in hundred thousands of years. Here is the most recent data going back to the last ice age:
There is no jump in temperatures over any 10 year period as you describe. You are reading material from people who are deliberately misleading you.
The data come from this SkS post: CO2 lags temperature.
You should note that we have already increased temperature over 1C and are heading for 4C. 4C colder means a kilometer of ice over New York. What will the changes be from increasing temperature 4C??
[DB] Reduced 2nd image width
Map:
If you want to continue to discuss ice age temperatures I suggest you post on the CO2 lags temperature thread. The moderators will delete posts here about the ice age since it is off topic.
For the record, the "one-third to one-half of the warming—about 15 degrees Fahrenheit—occurred in about 10 years." quote mentioned @111/112 originated at NASA's Earth Observatory back in 2006.
MAP and MA Rodger,
I have responded to your posts here where it is on topic.
Thank you Michael Sweet ~ that would be a better thread.
To finish up here :- in defense of commenter "Map" , I must say that his [now deleted] phrasing was a little clumsy: <" ... it took nearly 10,000 years for the Earth to totally emerge from the last ice age and warm to today's balmy climate, one-third to one-half of the warming--about 15 degrees Fahrenheit--occurred in about 10 years. "> [unquote] . . . but could reasonably be taken as meaning around 5 to 7.5 degreesF.
OTOH, the actual global warming into the Holocene was close to half of the 15F ~ so that should have alerted Map to the strong possibility that he had misinformed himself.
And as for a large slice of that temperature rise to occur - globally - in about 10 years . . . well, that would require an absolutely colossal influx of heat energy to occur. The sort of heat influx provided by a gigantic asteroid strike : far exceeding the wimpy little asteroid strike which which finished off the dinosaurs. Not to mention the subsequent plunge into Nuclear Winter. All of which, would definitely have shown up in the GISP2 ice core record. (Along with the concurrent extinction of all higher lifeforms on Earth !! )
I shall ponder, and likely make a post on the other thread (CO2 Lags Temp).
My original question had started closer to the topic but as I receive a response to that the questions naturally shifted, as most research does. The reason i chose this page to ask these questions is because the article above specifically attacks cherry picking of time and place, much like how my questioning had turned to other data that could be consider cherry picked by mainstream climate science. The problem I have had in my breif research is that all the papers I've read want to force the finished puzzle on you without examing the pieces, and when I research the pieces the information tends to lead to multiple outcomes that support and contradict the basis of global warming.
[JH] If you continue to make unsubstantiated global statements they will be summarily deleted because they violate this site's Comments Policy — specifically the "no sloganeering" provision. You will also forfeit your privilege of posting on comments on this site.
Please note that posting comments here at SkS is a privilege, not a right. This privilege can and will be rescinded if the posting individual continues to treat adherence to the Comments Policy as optional, rather than the mandatory condition of participating in this online forum.
Moderating this site is a tiresome chore, particularly when commentators repeatedly submit offensive, off-topic posts or intentionally misleading comments and graphics or simply make things up. We really appreciate people's cooperation in abiding by the
strong>Comments Policy, which is largely responsible for the quality of this site.
Finally, please understand that moderation policies are not open for discussion. If you find yourself incapable of abiding by these common set of rules that everyone else observes, then a change of venues is in the offing.
Please take the time to review the policy and ensure future comments are in full compliance with it. Thanks for your understanding and compliance in this matter, as no further warnings shall be given.
Map , you are being mysterious.
<" multiple outcomes that support and contradict the basis of global warming ">
This needs some explaining from you! It doesn't fit in with the general mainstream science of climate. The world's scientists have spent a great deal of time & effort (over many decades indeed) and have produced a coherent description of the physics of it all. The science is demonstrated in many thousands of scientific papers published in respected peer-reviewed journals.
They are pretty much unanimous in their findings. Yes, there are a few "contrarian" papers ~ but all of these show major faults ( e.g. Lindzen's Iris Hypothesis; Svensmark's and Shaviv's Cosmic Rays Hypothesis; Salby's Ocean-outgassing of CO2 Hypothesis ).
In short, Map, the evidence is wholly one-sided. There is no valid alternative.
Map, I think you are playing a joke. (But why do you bother?)
[JH} Notwithstanding his crocodile tears, Map's own words tell us that he is not posting comments on this site with an open mind and in good faith.
Michael sweet and ma Rodger, thank you for addressing my questions rather than attacking my wording. As I have found that I cannot continue conversations on this website without moving from topic to topic and Everytime my line of questions change slightly someone chooses to attack my wording just because I am trying to view the pieces to address the whole picture I have decided to abandon the discussion and not educate myself in this area as the "smart people" in the room haven't the ability to portray their thoughts to someone smarter than themselves that just isn't studied in the area he is questioning.
[JH] Argumentative nonsense stuck though.
Please note: the basic version of this rebuttal was updated on June 9, 2024 and now includes an "at a glance“ section at the top. To learn more about these updates and how you can help with evaluating their effectiveness, please check out the accompanying blog post @ https://sks.to/at-a-glance
One aspect of hot records versus cold is that in a warming planet we expect to see more high temperature records set than cold.
Anecdotal information for sure, but I saw recently that Las Vegas has not set a daily cold temperature record for 25 years. It sure has set a lot of record daily highs since then.
Even Fox News has reported on this (first Google hit).
https://www.foxweather.com/weather-news/25-years-las-vegas-low-temperature-record