Climate Science Glossary

Term Lookup

Enter a term in the search box to find its definition.

Settings

Use the controls in the far right panel to increase or decrease the number of terms automatically displayed (or to completely turn that feature off).

Term Lookup

Settings


All IPCC definitions taken from Climate Change 2007: The Physical Science Basis. Working Group I Contribution to the Fourth Assessment Report of the Intergovernmental Panel on Climate Change, Annex I, Glossary, pp. 941-954. Cambridge University Press.

Home Arguments Software Resources Comments The Consensus Project Translations About Support

Twitter Facebook YouTube Mastodon MeWe

RSS Posts RSS Comments Email Subscribe


Climate's changed before
It's the sun
It's not bad
There is no consensus
It's cooling
Models are unreliable
Temp record is unreliable
Animals and plants can adapt
It hasn't warmed since 1998
Antarctica is gaining ice
View All Arguments...


Username
Password
New? Register here
Forgot your password?

Latest Posts

Archives

The Day After McLean

Posted on 29 March 2011 by dana1981

John McLean is a climate data analyst (but apparently not a very good one, as we'll see in this post) and member of the Australian Climate Science Coalition.  He's a global warming "skeptic" who has co-authored a few peer-reviewed studies, including most notably being the lead author on McLean et al. (2009), which grossly overstates the influence of the El Niño Southern Oscillation (ENSO) on global temperatures.  As John Cook has previously discussed, the McLean et al. attempt to blame global warming on ENSO suffered from a serious divergence problem.

Now McLean is continuing his exaggeration of the influence of natural oceanic cycles on global temperatures with a rather stunning prediction:

"it is likely that 2011 will be the coolest year since 1956 or even earlier"

When I read this prediction, I was floored (Skeptical Science authors can attest to the fact that my initial reaction included some colorful language).  It's hard to overstate the magnitude of this prediction.  As the saying goes, a picture is worth a thousand words:

McLean is batshit insane

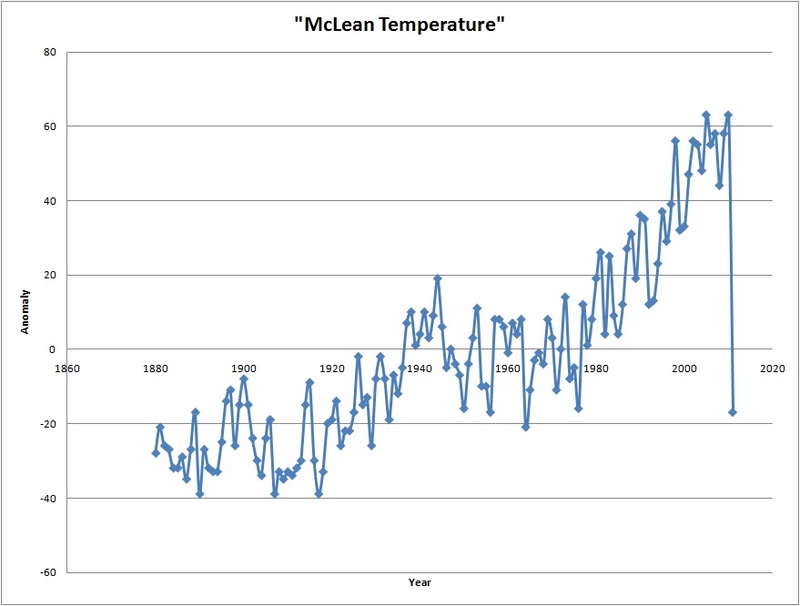
Figure 1: NASA GISS land-ocean anomalies, in hundredths of a degree Celsius (courtesy of MartinS)

Now that's a decline!

According to NASA GISS, the average land-ocean global temperature anomaly in 1956 was –0.17°C.  Matching 1956 would require a 0.8°C drop from the average 2010 temperature.  It's true that the current La Niña cycle is a strong one, but it's not that strong!  There was an equally powerful La Niña cycle in the mid-1970s, for example:

ENSO MEI

Figure 2:  Multivariate ENSO index (Source: NOAA)

The largest year-to-year cooling in the mid-1970s was 0.22°C.  The largest year-to-year average land-ocean global temperature change on record is 0.29°C.  McLean is predicting at least a 0.8°C drop in temperatures from 2010 to 2011, which is 2.75 times larger than the previous largest year-to-year temperature change on record.

The first two months of 2011 are in the books, and not surprisingly, McLean's predictions are not looking good.  According to NASA GISS, the average anomaly for January and February 2011 was 0.45°C.  This means to cool to 1956 levels, the average anomaly over the last 10 months of 2011 must reach nearly –0.3°C.  Average global temperatures haven't been that cold for an extended period of time since 1918.

This just goes to show how physically incorrect it is to blame global warming on these oceanic cycles; clearly doing so leads to some very, very wrong conclusions.  However, if anybody would like to wager that McLean's 2011 temperature prediction is correct, there are a number of Skeptical Science authors who would love to take that bet!

0 0

Printable Version  |  Link to this page

Comments

1  2  Next

Comments 1 to 50 out of 61:

  1. For completeness, what are the relevant figures for the NOAA and Hadley series?
    0 0
    Moderator Response: [DB] NOAA data & analysis can be found here. Wood for Trees can be used to plot Hadley, GISS and satellite data directly against each other; a great resource.
  2. Have [snip] ever explained a mechanism for how circulating currents that move heat around the planet, can warm or cool the planet as a whole?
    0 0
  3. You need to comment on McLean's post in a little more detail. I went to the link you provided above, and he says the following. “In June, we predicted global cooling by the end of 2010. In October-February, world temperatures dropped by .5c.” He then shows a graph with a plunging temperature. Obviously, he is getting his temperature data from some strange source. Thus, he will probably say his prediction was correct. Where is he getting his temperature data from?
    0 0
  4. Actually, I give McLean credit on this one... he hasn't just developed an outlandish theory for why AGW will not be a problem. He has shown the courage of his convictions and stated the likely outcome if that theory is correct. Having gone on record with a prediction, especially such an extreme and near term prediction, suggests that he actually believes what he is saying. Which is a bit scary, but preferable to 'skeptics' who make outlandish claims and studiously avoid examining what the implications of those claims would be. Sadly I don't hold alot of hope that McLean will re-examine his pre-conceptions if this prediction fails as badly as it seems to be doing thus far... but the prediction was made and can always be referenced in the future. Which makes it far preferable to nebulous predictions of lesser warming in unspecified amounts due to cosmic rays influencing cloud formation and other such hand waving.
    0 0
  5. P.S. In looking at McLean's site, I see he gets his data from Roy Spencer's site. Spencer shows Feb 2011 temp as -.02, down from a peak of +.5.
    0 0
    Moderator Response:

    [DB] McLean does some of the usual cherry-picks: uses satellite TLT data instead of the longer ground (land+ocean) datasets and places his focus on extremely short periods of time. Here is the whole TLT record:

    He seems to be basing much of his estimates on the Oceanic-cycles-control-global-temperatures meme; more on this is available here, such as this:

  6. Dana, If "it is likely that 2011 will be the coolest year since 1956 or even earlier" is the basis for your analysis, haven't you understated the predicted drop? 1964 was colder than 1956 in the GISTEMP analysis. Also, you have to go back to 1929 to get a colder calendar year than 1964.
    0 0
  7. Given that the satellite data he is referencing doesn't go back that far, McLean likely got the 1956 figure from the ENSO index (fig 2 in the article above) rather than any of the temp records. Of course, using the satellite temp data makes his claim untestable against values prior to 1979... though the likelihood that the annual average will below even that point seems extremely implausible.
    0 0
  8. bibasir - yes, as you discovered, McLean is using UAH data. However, since the satellite record began in 1979, I had to use a surface temperature record to evaluate McLean's comparison to 1956. Djon - the problem is I don't know which data set McLean is using. There may be a surface temperature data set in which 1956 is colder than 1964. This was just a quick and dirty illustration of how bizarre McLean's prediction is, but you may be right and it may even be worse than I discussed.
    0 0
  9. As the redoubtable Albatross shows here, McLean was refuted by Foster et al 2010. The Yooper
    0 0
  10. To boldly predict what no man has predicted before...
    0 0
  11. Daniel - John discussed Forster et al. 2010 in the posts I linked to in the article (toward the beginning).
    0 0
    Moderator Response: [DB] Sorry, Dana. Missed that reference.
  12. Looking at the UAH results; it seems like the coolest year thus far was 1985 at about -0.35 C anomaly. Given that the first two months of 2011 were right around 0 C anomaly that'd mean the remaining ten months would have to average below -0.42 C anomaly in order for 2011 to be the coldest in the UAH record... which would of course be a pre-requisite for claiming that it was the coldest since 1956 even if we (as McLean seems to be doing) ignore the surface temp record. Not as completely implausible as dropping below the 1956 GISS value, but still not going to happen.
    0 0
  13. CBD#12: "the remaining ten months would have to average below -0.42 C anomaly" NOAA predicts ENSO neutral by June. So only 3 months remain for this radical cooling hypothesis to work. How much will you bet that this prediction will be carefully buried by the denialosphere by then?
    0 0
  14. muoncounter at 04:47 AM The JAMSTEC ENSO forecast: "The current strong La Nina has started to weaken and would decay further in following boreal spring and summer seasons. The decaying La Nina would show a Modoki pattern. The cold La Nina condition might rebound in fall and persist up to early 2012." There has been no reason given yet that it cannot repeat the 3 consecutive La-Nina years of the 1970's, or even the early 1900's. For over a year, there have been ever increasing comparisons being made between the evolving conditions and 1974. In addition a -ve IOD will continue for the 2nd half of this year. JAMSTEC are one of the most reliable sources for these predictions, possibly through giving due recognition to the importance of the IO. http://www.jamstec.go.jp/frcgc/research/d1/iod/sintex_f1_forecast.html.var
    0 0
  15. CBD brings up a good point with the fact that the satellite data only goes back to 1979. If McLean is using the UAH temperature data, then he is cherry picking. Why not use the GISS data or NCDC data or HadCRUT data, or whatever data set he used to base the 1956 year fantasy off of, as the data for current values? Is it because, conveniently for him, satellite data responds more dramatically to ENSO than ground-based measurements? I also agree that since McLean says "1956 or even earlier," his intent was not "just barely above 1956" but "since that year." He's talking temporally, so the temperature should be even lower than 1956 to account for the 1964 dip.
    0 0
  16. Muoncounter @ 13 - "How much will you bet that this prediction will be carefully buried by the denialosphere by then?" And then carefully exhumed by Sks authors and compared to actual observations. Figure 1 in the post is a pearler!.
    0 0
  17. johnd#14: "There has been no reason given yet that it cannot repeat the 3 consecutive La-Nina years" I take this to mean your money's on McLean? If not, how low do you think the global temperature anomaly for the year will go? "JAMSTEC are one of the most reliable sources for these predictions" Sooo, the computer models they use for their predictions are reliable? But that would mean ... climate modeling can be accurate!
    0 0
  18. It is appropriate to compare Dr. Hansens predictions to see who does better. In this article (on page 5) Dr. Hansen predicts that 2011 will be warm but not record setting. He says that if the El Nina shuts off that 2012 might be a record hot year. Perhaps you could add Hansens prediction to figure one so people can see who does better.
    0 0
  19. I do not understand why "skeptics" posting here insist on going on about the current ENSO. Even if the current event maintains its current intensity (which is doubtful) and persists into the Boreal winter, annual global SATs will be warmer than those in 1956 or 1985, on that I am willing to wager money. "Skeptics" how much are you willing to wager on McLean? Are you really that faithful? As Dana has noted: "According to NASA GISS, the average land-ocean global temperature anomaly in 1956 was –0.17°C. Matching 1956 would require a 0.8°C drop from the average 2010 temperature. It's true that the current La Niña cycle is a strong one, but it's not that strong!" McLean's prediction was bust the very moment he uttered it. What is telling is that "skeptics" here (and elsewhere) continue to refuse to be true skeptics and call McLean et al. on their utter nonsense or to distance themselves from his BS. Instead they choose to use it as an opportunity to float more red herrings and obfuscate. And FWIW, and again it is not really relevant given the known maximum perturbation that La Ninas have on global SATs, IRI (who use multiple sources of dynamical and statistical guidance) are predicting ENSO neutral conditions by early summer, perhaps sooner.
    0 0
  20. muoncounter @17, Sweet :)
    0 0
  21. The prospects for a cool 2011 are melting away. The La Niña is dying: First, see the Australian BOM graphs on NINO indices: ENSO monitoring graphs NINO 3.4 has warmed to -0.47. This is already NEUTRAL territory, as defined by the range -0.5ºC > NINO3.4 < 0.5ºC. The other NINO indices has also warmed, they are currently at: NINO4: -0.34ºC NINO3: -0.32ºC NINO2: +0.26ºC NINO1: +0.24ºC All neutral. The subsurface temperatures are even more indicative. There is a huge volume of anomausly warm water below the weakly cool surface layer, and is spreading eastwards: The Equatorial Upper-Ocean Heat Anomalies are now positive (warm). The warm anomaly is in average +0.4ºC: It seems that is very likely that will will NOT just return to ENSO-neytral condictions in a few months (BOM show neutrality already), but we will enter an El Niño. Seeing the huge volume of subsurface warm water, I suspect that the El Niño will be strong.
    0 0
    Moderator Response: [DB] Fixed image sizes.
  22. To moderator: Sorry for the huge sizes of the images, I don't know how to rescale them.
    0 0
    Moderator Response:

    [DB] If you use this as an example, replacing 1 with the left arrow tag and 2 with the right arrow tag & put your desired URL between the double quotes, you will get a clickable, linked, appropriately-sized inline picture in your comment:

    1a href=""21img width="450" src=""21/a2

  23. Yes, the strength and length of the La Nina cycle is really irrelevant here. The point is that McLean is predicting a 1-year temperature drop nearly 3 times larger than any previous 1-year temperature change over the past 130 years. ENSO simply isn't capable of causing a 0.8°C cooling in 1 year. In fact, it took anthropogenic CO2 emissions nearly 100 years to cause a temperature change that large. The prediction is flat-out nuts.
    0 0
  24. Michael @18, The MetOffice agree with Hansen. They released their official forecast for 2011 in December 2010: "Although La Niña has stabilised, it is still expected to affect global temperature through the coming year. This effect is small compared to the total accrued global warming to date, but it does mean that 2011 is unlikely to be a record year according to the Met Office prediction based on the three main datasets. Nevertheless an anomaly of 0.44 °C is still likely — with the range very likely to be between 0.28 °C and 0.60 °C. The middle of this range would place 2011 among the top 10 warmest years on the record." Also of note, is the UK Met Office's statement that: "Over the years 2000–2010 that the Met Office has issued forecasts of annual global temperature, the mean value of the forecast error is 0.06 °C." Impressive indeed. Now what are McLean's margins of error when predicting global SATs?
    0 0
  25. muoncounter at 06:32 AM, my money is on JAMSTEC, as it has been for some years now. Regarding computer modeling, the operative word is "can". As I often note,all to frequently, there are some who can produce work that is accurate, but many who can't. It depends on how advanced they are in being able to identify what is relevant and what is not. It has been noted elsewhere of the improvements that have occurred in weather forecasts over the decades. As in every endeavor, all players are not moving in lockstep, rather they are moving up a ladder, and the rung the majority occupy now was occupied by someone else a decade ago, and so it will be a decade from now for the rung that someone else now occupies. That reality applies to all fields. The early bird might be the party pooper, but they do get the worms.
    0 0
  26. JohnD, Let us cut to the chase. This post is about McLean's dubious forecast for global SATs in 2011. 1) How much are you willing to wager that McLean's forecast is going to be correct? You said earlier that "my money is on JAMSTEC, as it has been for some years now". That forecast is largely irrelevant, but how about you put money where your mouth is instead of floating red herrings? 2) Or do agree with that McLean's forecast is hogwash?
    0 0
  27. Just to add to the mish-mash of ENSO predictions, here is a reliable prediction going forward with the prediction made at this time last year.
    0 0
  28. johnd #25: "my money is on JAMSTEC" I note you did not specify a temperature for 2011 in your reply, so where the pass line is in this craps game isn't clear. I guess it's always prudent to save some room for a late-innings goalpost shift. "there are some who can produce work that is accurate, but many who can't." Is your standard here that 'accurate' means 'agrees with you' and 'inaccurate' means 'warming'? "The early bird might be the party pooper, but they do get the worms." If by early, you mean predictions made in say, 1988?
    0 0
    Moderator Response: [DB] Fixed date.
  29. Moderator/DB @ 22 - The appropriate HTML code for limited image sizes has vanished from the Comments Policy page, where I have frequently copied it before. Might this be restored? I found it quite helpful. The last time I wanted to post a limited size image I had to go to a previously posted image on an old thread and "view source" to remind myself of the syntax. Not terribly "user friendly". In that regard, it might also be worth showing the hypertext for italics, bold, and underlines on that page, if the moderators consider those helpful for the general posting.
    0 0
    Moderator Response: (DB) Sure, KR, I'll take care of it. Edit: Done.
  30. Just in case, I've saved a copy of that complete page (including images, etc) in a tar.gz file and put a sha256 sum of it on my Wikipedia user page to timestamp it (even if I delete it it'll be available in the history). It's not that I'm not an entirely trusting person or anything...
    0 0
  31. At EIKE "European Intitute for C(K)limate and Energy", a letterbox-Institute and the german spin-off of CFACT, they were offered a little bet after they published the McLean-Paper. The author declined with the message: "Wer wettet, will betrügen!" "Who bets, wants to betray". Very neat. A nonsenical claim and when challenged very cold feet.
    0 0
  32. Hard to qualify the McLean prediction. If he's referring to any of the surface records, it's clearly implausible. If he's referring to satellite LT records, where is he getting 1956 data from? If he's referring just to the ENSO region (becoming quite a stretch here), he's claiming that models indicate la Nina will last "well into autumn" and last until June of the following year, which does not match mean model predictions as others have pointed out. But ENSO values were around record levels recently, which brings up a revealing claim: "Since 1958 there's been a 30% increase in atmospheric carbon dioxide and if this had a major influence on temperature we'd expect to see clear evidence of the temperature continually rising above what the SOI suggests it should be, but this is not happening". So if McLean's ENSO hypothesis is correct, we will indeed see global average temperature drop to near 1956 levels. To give him credit, it's nice to see a contrarian make a falsifiable prediction, one that is a logical extension of his ridiculous hypothesis. I have to give him credit for that. What are we left with? A serious typo? Maybe by "1956" he meant "2008"?
    0 0
  33. Apologies if this is answered somewhere, but what is TLT (response to comment #5)? Lower Troposphere Temperature seems most likely on the face of it, but why isn't that LTT? Thanks
    0 0
    Moderator Response: [muoncounter] See UAH satellite temperatures at wikipedia for additional explanation of these terms.
  34. Susanne - it is temperature of the lower troposphere
    0 0
  35. That link johnd provided above for JAMSTEC was interesting, particularly this part of their forecast: "Southeastern China, southwestern Japan, US and Europe would have warm and dry condition during boreal spring-summer seasons." Following on from the very heavy snowstorms during late winter, warm conditions means there is likely to be significant flooding in the US this spring/summer as the snowpack melts (as per the NOAA assessment). The other question is: how warm is warm? Are we talking heatwave warm? It would be somewhat ironic if the continental US experienced record-setting warm temperatures during one of the cooler years of the last decade, given the focus by some on cooler CONUS temps during one of the hottest years ever recorded last year.
    0 0
  36. Alexandre @10 "To boldly predict what no man has predicted before... " Ahhh...I Love the Smell of Split-Infinitives ine the morning!
    0 0
  37. Susanne @33 The terminolgy used for the temperature products is rather abritrary and historical. I have a discussion of Satellite Temperatures here http://www.skepticalscience.com/Primer-Tropospheric-temperature-measurement-Satellite.html
    0 0
  38. Anyone remember David Archibald's prediction for May 2009? Similarly absurd.
    0 0
  39. wingding, do you have a link to where David Archibald predicted that?
    0 0
    Moderator Response: [DB] I believe a version can be found here.
  40. Pertaining to the moderator response to #12:
    ...replacing 1 with the left arrow tag and 2 with the right arrow tag...
    As an FYI, you can (or should be able to) include a < or > in a post by replacing them with < (meaning "less than") or > ("greater than"). For example, here is your HTML example as you would type it:
    <a href=""><img width="450" src=""></a>
    And here is how it would come out:
    (There's a small chance this won't work, that your post-processor is going to convert everything before showing it... if so just delete this post and ignore it. Also note that you can't exactly use the preview function, because that converts stuff... the preview will look fine, but it will undo your post so your subsequent submit is wrong. To use preview, copy your text before hitting preview, look at the result, but then paste your copied text back in and change that).
    0 0
    Moderator Response: [DB] Thanks; good to know that. When I get the chance, I'll add more tips & hints to the posting tip section here.
  41. Re 39: icecap.us (PDF) David Archibald predicts the May 2009 UAH MSU Global Temperature Result
    0 0
  42. 40 Moderator (Dan), You'll note that when you reposted my post (with your moderator comment) it changed it all... converting every &lt; to a <, and so on... That's equivalent to the "preview" effect I was talking about. You should probably delete my post now (since it's messed up), or else repost it, after fixing it all, which can be a real pain in the &butt;. I do this for a living, so it's not hard for me, but it will probably be pretty tedious and annoying for you. [If you do try to fix it, the way to write &lt; without having it turn into a < is to write it as &amp;lt; ... &amp; is how you generate an ampersand that isn't interpreted as part of an HTML entity. If that confuses you... welcome to the world of web page coding.]
    0 0
  43. There are three (repeated) "skeptical" behaviors here that I find comical. The first is the ridiculous tendency to take some index of any sort and with no understanding of or attribution to an underlying mechanism (often, as is the case with PDO, not really knowing what the index itself represents, because it's just a hodgepodge of readings that signify nothing in particular) to look for some sort of mathematical correlation and to claim that this demonstrates that CO2 can't be a factor, because it wasn't directly, consciously considered in the calculations. Which doesn't mean that it wasn't, but simply that the author's alchemy was sufficiently obscure so that even the author himself couldn't see the connection. The second is the fact that almost all of the indices that skeptics use for this purpose are in fact themselves based on temperature (or some subset of global temperature, such as ENSO and PDO which include sea surface temperatures as part of their values). So what they are doing is saying that (wait for it) temperature correlates to temperature. This is particularly funny since ENSO has the opposite effect that skeptics think, in that La Nina, by "lowering" the measured global temperature, allows the Earth to radiate away less heat than normal, and so accelerates warming. El Nino, while it raises temperature observations, actually helps to cool the planet by radiating away more heat than normal. The last, really funny bit, is that climate is a system with a lot of noise. The variations in observed (not actual) temperatures due to ENSO greatly overwhelm the underlying, true global mean temperature signal, just as the swings in the seasons, or even daily temperature (due to day/night) greatly overwhelm the underlying signal. So it's easy to get graphs to visually look like good correlations because the obvious short-scale features correlate, while the underlying trend is in fact absent. Worse than this, I've seen papers (can't remember them, they aren't worth my time) that argue their case by first removing the long term trend and showing that what remains exactly matches, "proving" their correlation. Ta daaaa! [skeptical scientist blushes and bows here, to rousing applause of smug skeptic admirers] In fact, I've recently scene a magnificently humorous argument surfacing that because temperature changes with the seasons are so great, CO2 can't possibly be having a noticeable effect... it must be overpowered by the seasons. So by that same logic, the seasons can't possibly have a main effect on temperature, because the day night cycle so clearly overwhelms the seasons! Ah, isn't it fun being skeptical?
    0 0
  44. @ Bob I grok you ;) I'll fix it in a bit (hadn't had my second cup of coffee yet when I replied, screwing up your first post). Not a problem now that I see what it's doing. Cheers, The Yooper
    0 0
  45. I had an epiphany. Reading thermometers causes global warming. Here me out. I took a subset of the GISTEMP readings (meaning all of them) to create what I call the Justified Oscillating Known Evaluation index, or JOKE index. Mapping this to the global temperatures measured by UAH, HadCRUT, and RSS, one can see that the correlation is almost exact! There is little difference, if any! The conclusion is clear. Reading temperatures causes climate change. In fact, it is GISS themselves who are causing climate change. If we simply stop studying climate, climate will stop changing! Climate change is in fact anthropogenic, but it has nothing whatsoever to do with CO2 or fossil fuels. The climate scientists aren't perpetrating a hoax, they're actually changing the climate themselves, through the act of taking temperature measurements! All we have to do to stop climate change is to fire all climate scientists! Maybe put them to work doing something useful, like digging more coal out of the ground...
    0 0
  46. Wingding @41, Excellent find! From the links that you sent, Archibald states that: "The combination of a 0.3° response to the current La Nina and the usual 0.3° decline from January to May will result in a 0.6° decline to May 2009 to a result of -0.4° (0.4° below the long term average)." Now in complete contrast with his "prediction", the UAH global lower-troposphere temperature for May 2009 was +0.06 (with respect to the 1980-2010 mean). RSS gave a global anomaly of +0.05 C for May 2009. And 2009 ended up being the second warmest year on record in the GISS data at the time. Archibald was horribly wrong. Just how long are the "skeptics" going to keep trying to perpetuate this myth that we are headed for long-term global cooling?
    0 0
  47. "David Archibald is a Perth, Australia-based scientist operating in the fields of cancer research, oil exploration and climate science. After graduating in science at Queensland University in 1979, Mr Archibald worked in oil exploration in Sydney and then joined the financial industry as a stock analyst. Mr Archibald has been CEO of multiple oil and mineral exploration companies operating in Australia. He has published a number of papers on the solar influence on climate, and is a director of the Lavoisier Society (Lavoisier Group), a group of Australians promoting rational science in public policy." Australian Climate Science Coalition Google Scholar reveals those "papers" are mainly E&E and non-peer-reviewed stuff. Here's one: Solar cycles 24 and 25 and predicted climate response "Based on solar maxima of approximately 50 for solar cycles 24 and 25, a global temperature decline of 1.5°C is predicted to 2020, equating to the experience of the Dalton Minimum." Have fun with that one. Would be fun to see this plot on Dana's graph (the vertical axis would need to be nearly doubled for it to fit), perhaps in a different post that examines Archibald's past predictive powers. I'm trying to figure out where Archibald gets his Dalton Minimum info from. On Wikipedia, the DM page has a similar statement that references "Archibald says" with no link. Pretty sloppy page overall. Dalton Minimum
    0 0
  48. I found a good overview of the problems in Archibald 2006 (Solar cycles 24 and 25 and predicted climate response) here: http://n3xus6.blogspot.com/2007/02/dd.html It turns out Archibald doesn't use global temperature records, but uses a handful of stations with no obvious reason why they were picked. Eg from the paper: "To provide a baseline for projecting temperature to the projected maximum of solar cycle 25 in 2024, data from five, rural, continental US stations with data from 1905 to 2003 was averaged and smoothed" Huh? how did this pass peer review of any kind? And it's not like he's actually trying to predict regional temperatures in the US because he goes on to compare those 5 stations in the continental US with the global satellite record: "The flat profile of the last 20 year period is corroborated by the satellite data over that period, which shows only a very weak rise in the temperature of the lower troposphere." This was published in Energy and Environment by the way. Next time some skeptic tries to sweet talk you into thinking E&E isn't just full of fluff, this paper is a great example otherwise. The paper also cites Friis-Christensen and Lassen 1991, but makes absolutely no citation of Friis-Chistensen and Lassen 1999 which pretty much demolishes the earlier paper. Perhaps McLean is using a similar "trick" as Friss-Christensen and is not using a global temperature record when he states "it is likely that 2011 will be the coolest year since 1956 or even earlier". Is he referring to the US record perhaps?
    0 0
  49. massive error! I meant to say: Perhaps McLean is using a similar "trick" as Archibald NOT Perhaps McLean is using a similar "trick" as Friss-Christensen
    0 0
  50. Even better another later Archibald paper that appeared in E&E introduces with: "detailed work on the 20th century temperature record in relation to solar cycle length was undertaken by Friis-Christensen and Lassen (1991). This original paper was subsequently amended, and their observation of a correlation between solar cycle length and temperature remains valid" Subsequently amended? He must be referring to C&L 1999 right? If so this is the abstract, I don't see Archibald even mention the key point: "It has previously been demonstrated that the mean land air temperature of the Northern hemisphere could adequately be associated with a long-term variation of solar activity as given by the length of the approximately 11- year solar cycle. Adding new temperature data for the 1990’s and expected values for the next sunspot extrema we test whether the solar cycle length model is still adequate. We find that the residuals are now inconsistent with the pure solar model. We conclude that since around 1990 the type of Solar forcing that is described by the solar cycle length model no longer dominates the long-term variation of the Northern hemisphere land air temperature." Archibald 2009 also makes another prediction: "The monthly neutron count is now higher than it has been at any time for the last fifty years. If the month of solar minimum proves to be July 2009, peak neutron count may not be until mid-2010. On this basis, and according to Svensmark and Friis-Christensen’s hypothesis, peak cloudiness, and therefore peak rate of cooling, will be reached in mid-2010." None of this happened.
    0 0

1  2  Next

You need to be logged in to post a comment. Login via the left margin or if you're new, register here.


The Consensus Project Website

THE ESCALATOR

(free to republish)


© Copyright 2024 John Cook
Home | Translations | About Us | Privacy | Contact Us