On the 24th of July, 2012, Murry Salby gave a talk at the Sydney Institute. He makes a large number of claims in the talk, some of which are even true, while some merely misrepresent the science. Of these, one the worst is his discussion of the relative contribution of CO2 (and other long lived greenhouse gases) to the greenhouse effect. Another is his continued misunderstanding of what has caused the modern increase in CO2 concentrations. I will be ignoring these, and other, errors. In this post I focus only on a misrepresentation that cannot be explained by inadequate knowledge, or simple misunderstanding.
Speaking of the relationship between CO2 and temperature in models, Salby says (29:25 - glosses of unusual words included in square brackets):
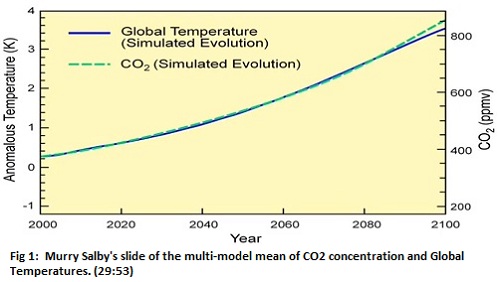
"In blue is the forecast evolution [change over time] of global temperature averaged over two dozen models of the IPCC. It increases monotonically [without reversal], achieving values three and a half degrees warmer by the end of the twenty-first century. The increase in global temperature should correspond to increasing CO2. In fact their correspondence is considerably greater. In green is the forecast evolution of CO2. It too increases, exceeding eight hundred ppmv by the end of the century. Global temperature doesn't just increase with increasing CO2 - it tracks it almost perfectly. In the model world, changes of CO2 and global temperature are isomorphic, they have exactly the same form. Their relationship is so tight, you don't even need a climate model. A fractional increase of CO2 entirely determines the fractional increase in global temperature."

Salby's description of the graph is a little misleading. To start with, the simulated change over time (evolution) of global temperature has no short term negative trends (is monotonic) only because the curve is the mean of "over two dozen models". The course of temperature increase of individual models is certainly not without fluctuations. In the IPCC AR4, all model runs had short term periods with negative trends, some lasting as long as 20 years. Further, the curves also do not have exactly the same shape (are isomorphic). If they did have the same shape, they could be overlaid without any portion of the curves failing to correspond, and the relationship between them would be linear, ie, expressable in the form, y = ax + b.
For simplicity, let's treat the relationship as isomorphic. In that case, the change in global temperature would be a constant fraction of the change in CO2 concentration. In the graph above, the CO2 concentration increases from 375 to 850 ppmv, an increase of 475 ppmv. At the same time, the global temperature anomaly increases by 3.3 degrees C. So , if Salby's claims were accurate, an increase of 10 ppmv of CO2 would result in an increase of 0.069 C in Global Temperature. That is Salby's ratio.
After a while, Salby continues (32:35):
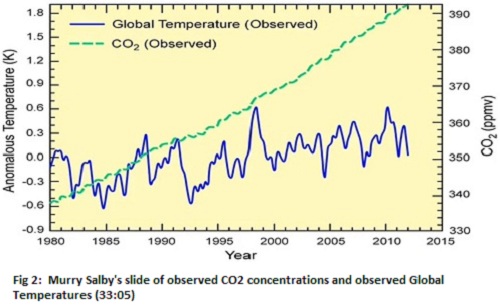
"In blue is the observed record of global temperature from the satellite MSU. In green, the observed record of CO2. The long term evolution of global temperature parallels that of CO2 during the 1980s. It behaves less so during the 1990s, even accounting for the erruption of Pinatubo in 1992. But after the El Nino of 1997, CO2 continued to increase. Global temperature did not. Their divergence over the last decade and a half is now uneqivocal. In the model world gobal temperature tracks CO2 almost perfectly. In the real world, it clearly doesn't."

But there is a problem here. The observed increase in CO2 concentration in the graph is from 338 to 392 ppmv, an increase of just 54 ppmv. Using Salby's ratio, that suggests an increase in global temperature of just 0.38 degrees. If, however, global temperature where to track the CO2 increase shown on the chart, it would need to increase by 2.54 degrees C. Indeed, the satellite record shows a trend in temperature of 0.14 C per decade, for an increase of 0.43 C since the start of the satellite record. In other words, the temperature increase is currently tracking nine percent above the increase predicted by Salby's "isomorphic" relationship.
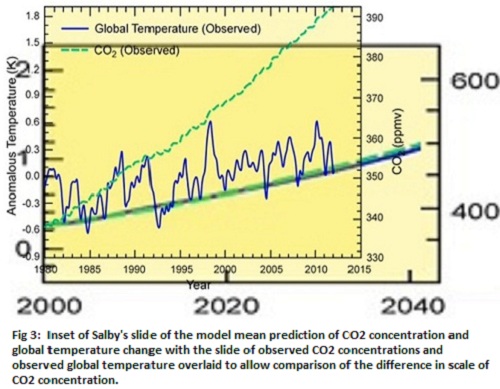
Looking closely, it is not difficult to find the problem. In the first graph, shows a range of 5.2 degrees C and 710 ppmv, a ratio of 136.5 ppmv/ degree C. In contrast, in the second graph, the range is 2.8 degrees C, but only 62 ppmv, a ratio of 22 ppmv/ degree C. The second graph has been rescaled to exagerate the increase in CO2 concentration relative to increase in temperature by 620%. This is clear in Figure 3, which shows the second graph overlaid on an inset of the first graph to allow comparison of the CO2 concentration scales (Temperature and temporal scales, but not position, have been matched.)

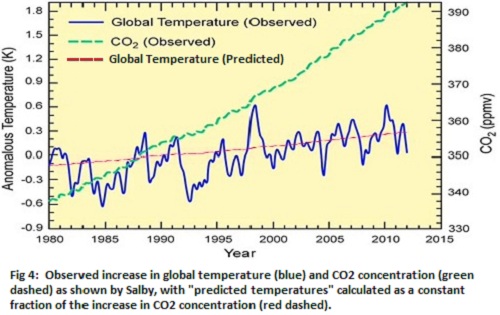
To make an honest prediction based on Salby's graph, we need to divide the vertical axis by 6.2, thereby producing a temperature prediction that is correctly scaled for temperatures in the observed graph. When we do so (in red below), Salby's "unequivocal divergence" evaporates. The divergence in predicted and observed Global Temperatures turns out to be a consequence of Salby's manipulation of the scales on his graphs, not a property of either data or models. His rescaling hides the close relationship between predicted and observed increases in temperature.

I wonder why he did that?
Revised to correct spelling, 21/10/2012
Posted by Tom Curtis on Saturday, 20 October, 2012
 |
The Skeptical Science website by Skeptical Science is licensed under a Creative Commons Attribution 3.0 Unported License. |