Looking at three versions of the global surface temperature record, with their different behaviour over the last decade and a half, it is only natural to wonder 'which is right?'.
To answer this question, we need to know why they differ. And the first place to look is the known sources of bias which impact the different versions of the temperature record.
One source of bias - due to poor observational coverage - has been discussed in our recent paper, although it was reported back in 2009, and it was addressed by NASA as long ago as 1987.
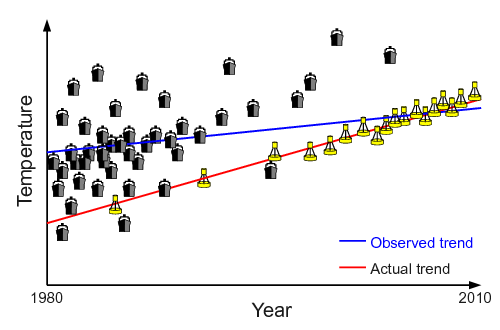
The other source of bias comes from a change in the way sea surface temperatures (SSTs) are measured. In the 1980's most SST observations were from ship engine room water intake sensors, however over the last two decades there has been a shift to using observations from buoys. The ship-based observations are subject to biases which depend on a number of factors including the design of the ship, but are on average slightly warm. As a result the raw observations can provide a misleading trend for short periods spanning the changeover, such as the last 15 years. The problem is illustrated in the Figure 1.

Figure 1: How a transition from ship to buoy measurements can bias temperature trends. This image is illustrative and does not represent the actual trends in observation types, which are more complex.
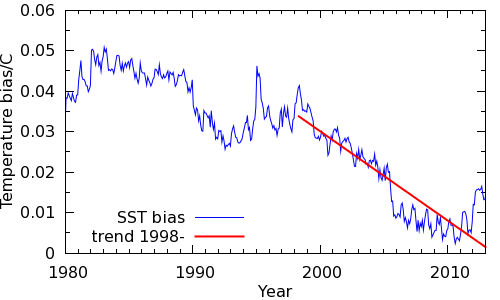
The UK Met Office have developed a very sophisticated analysis to address these biases. The resulting corrections are included in the HadSST3 sea surface temperature record, but these corrections have not yet been applied to the SST records used by NASA or NOAA. The bias in the other versions of the global temperature record due to change in observational platforms can be estimated from the difference between the raw and adjusted HadSST3 data, and is shown in Figure 2.

Figure 2: Impact of SST bias on the global (i.e. land/ocean) temperature record estimated from the HadSST3 data.
We can see that the change in observational methods will tend to suppress temperature trends starting in the mid 1990's and running to the present. Of particular interest is the coverage and SST bias in trends for different start dates, shown in Table 1. The second column gives the bias in the global trend due to coverage. The third gives the bias due to the change in SST observational method.
| Start year | Coverage bias (°C/dec) | SST bias (°C/decade) |
| 1990 | -0.020 | -0.014 |
| 1991 | -0.020 | -0.015 |
| 1992 | -0.027 | -0.016 |
| 1993 | -0.030 | -0.018 |
| 1994 | -0.034 | -0.019 |
| 1995 | -0.036 | -0.021 |
| 1996 | -0.039 | -0.021 |
| 1997 | -0.055 | -0.022 |
| 1998 | -0.058 | -0.022 |
| 1999 | -0.056 | -0.021 |
| 2000 | -0.055 | -0.020 |
| 2001 | -0.057 | -0.020 |
| 2002 | -0.056 | -0.018 |
| 2003 | -0.083 | -0.015 |
| 2004 | -0.081 | -0.011 |
| 2005 | -0.045 | -0.004 |
Table 1: Trend bias by starting date due to coverage and SST bias.
Note that trends starting in 1997 and 1998 are most biased by the change in observational method. The striking thing about this result is that these are the same trends which are most impacted by coverage bias.
Every version of the temperature record is affected by at least one of these sources of bias, as shown in the Table 2.
| Coverage bias | SST bias | |
| Met Office | X | |
| NASA | X | |
| NOAA | X | X |
Table 2: Biases present in the main versions of the temperature record.
We can produce an initial estimate what GISTEMP would look like if it included the HadSST3 bias corrections by taking the difference between the raw and adjusted HadSST3 data, weighting each grid cell by ocean fraction, and applying the resulting shifts to the GISTEMP blended data. The 16 year trends for this data and for the published records are given in Table 3. The corrected GISTEMP trend is very close to the trend for the infilled HadCRUT4 data from Cowtan & Way (2013).
| Dataset | Trend °C/decade |
| HadCRUT4 | 0.046 |
| GISTEMP | 0.080 |
| GISTEMP+SST adj. | 0.103 |
| HadCRUT4 infilled | 0.108 |
| HadCRUT4 hybrid | 0.119 |
Table 3: 16 year temperature trend comparison (1997/01-2012/12).
At the start of the article I asked which existing version of the temperature record was 'right'. If both our paper and the HadSST3 paper are correct (and both are single studies which require replication), then the surprising answer is 'none of them'. All suffer from one or more sources of bias which have been suppressing temperature trends since around 1998, i.e. the start of the purported 'pause' in global warming. We anticipate that the coverage and SST biases account for most of the difference between the different temperature records over recent decades.
This obviously has implications for some papers on recent temperature trends, although the better papers which compare coverage-masked model outputs against HadCRUT4 are largely unaffected. This once again highlights the problem of drawing conclusions from short term trends.
Posted by Kevin C on Friday, 15 November, 2013
 |
The Skeptical Science website by Skeptical Science is licensed under a Creative Commons Attribution 3.0 Unported License. |