Are ice sheet losses overestimated?
What The Science Says:
Wu et al (2010) use a new method to calculate ice sheet mass balance. This method, like all new methods will improve and be revised with time. Although, it does not agree well with most other measurement techniques, Wu et al's (2010) estimate is still at the upper end of IPCC predictions for ice losses and shows extensive land-ice losses from both Antarctica and Greenland.
Climate Myth: Ice Sheet losses are overestimated
"Rapid loss of ice-mass from the glaciers of Greenland and Antarctica are cited as proof positive of global warming's onslaught. The latest measurements involve the use of satellite gravimetry, estimating the mass of terrain beneath by detecting slight changes in gravity as a satellite passes overhead. But gravity measurements of ice-mass loss are complicated by glacial isostatic adjustments—compensation for the rise or fall of the underlying crustal material. A new article in Nature Geoscience describes an innovative approach employed to derive ice-mass changes from GRACE data. The report suggests significantly smaller overall ice-mass losses than previous estimates." (Doug Hoffman)
There has been a significant degree of commentary on various blogs and across the scientific community regarding uncertainties in measuring ice sheet changes in Greenland and Antarctica. The majority of this discussion has been ongoing within the field for years but a recent paper (1Wu et al. 2010, Nature Geoscience) has invigorated the debate amongst not only those within the subfield of glaciology, but also among the general public. Several prominent skeptic websites have already featured stories on Wu et al’s (2010) results, using them as ‘supposed’ confirmation that ice sheet losses are significantly less than previous estimates have concluded.
Background
Wu et al (2010) use a new approach for correcting for glacial isostatic adjustment (GIA) when using data from NASA’s Gravity Recovery (GRACE) twin satellite system over the period of 2002 to 2008. GRACE is a pair of satellites which together measure the changes in mass on the earth’s surface. GRACE has been prominently featured in many recent papers 2, 3, 4, 5, 6, 7, 8, 9 detailing extensive ice losses along coastal Greenland with moderate gains occurring at high altitudes in the interior. GRACE data is extremely sensitive to GIA which is essentially deep solid earth glacial isostatic mantle motions (the earth rebounds after heavy ice has been removed from it) making it necessary for estimations of its magnitude to be made in order to determine regional scale mass balance. Wu et al (2010) use a new method for simultaneously solving for GIA and exchanges of mass globally. They use ocean information from altimetry and tide gauges to constrain oceanic mass changes, GPS data for crustal movements in tectonically sensitive regions and GRACE for direct inferences pertaining to total mass movements. Previous studies have corrected for GIA first and then calculated the mass exchanges but this study does this process at the same time using a least squares minimisation approach including both GRACE and GPS datasets. This method is viewed by the authors as being a step forward in correcting for GIA but it has been acknowledged that this approach is very new and will require further GPS data to better constrain the GIA signal. So is this the final word on ice sheet mass balance status?
A new paper (10Bamber and Riva 2010) uses sea level fingerprints and mass loss estimates from previous studies to outline the sea level fingerprint of global ice losses. During the review stage of that paper, Bamber and Riva were asked why they did not include Wu et al (2010) estimate for Greenland but instead used 11Van den Broeke et al (2009). They responded,
“…the values we use are, we believe, the most appropriate to use and are sufficiently reliable to make key points and conclusions that we make… Because a paper is the most recent does not, necessarily, make it the most reliable or “best” estimate. Different approaches have different advantages and disadvantages… The study by Wu et al is an exciting and novel approach to simultaneously solving for GIA and mass exchange (what they call PDMT). We consider this paper to be an interesting proof of concept for the approach but certainly not the “last word” on the topic… The solution has not been tuned for any one location and the quality of the solution will depend on the quality and spatial density of the data sets that went into it… In Greenland, there are very few GPS sites with sufficiently long record (just 3) that could be used and none in the interior of either Antarctica or Greenland. In the future the GPS networks set up within IPY for both ice sheets will greatly help with solving for GIA in these areas.”
The take home message from what Dr. Bamber and Dr. Riva had in their response was that Wu et al (2010) is an interesting paper that provides a new method of correcting for GIA, however the limitations of the GPS datasets in Antarctica and Greenland should make us view this estimate as a first attempt but THE definitive answer for ice changes. Their response emphasizes that with the high degree of uncertainty in GRACE data and gravimetry as a whole, there will undoubtedly be further revisions of estimates in the future as GIA is better constrained.
To try and further understand the accuracy of Wu et al’s estimate, I contacted coauthor Dr. Erik Ivins from NASA’s Jet Propulsion Laboratory. Dr. Ivins pointed out that the reason Wu et al’s estimate for Greenland was lower than other estimates is that his inverse method for dealing with GIA gave a large counterbalance signature in central Greenland which showed downward mantle motions that lowered his ice loss estimate (Figure 1). Dr. Ivins also noted that the actual existence of this counterbalance signature is still uncertain and that the novelty of the technique is an important consideration when evaluating the results. He also made it clear that this study does not use the standard data sources for estimations of ice sheets such as: (1) in situ ice sheet information (2) altimetric elevation changes (3) ice flux (velocity) measurements (4) ice calving/basal melt estimates or (5) inferences of snow accumulation. Dr. Ivins ends the email saying “Considering both the novelty and globality of the methods used by Wu… I’d be hard pressed to say that his result supports the so-called prominent skeptics.”
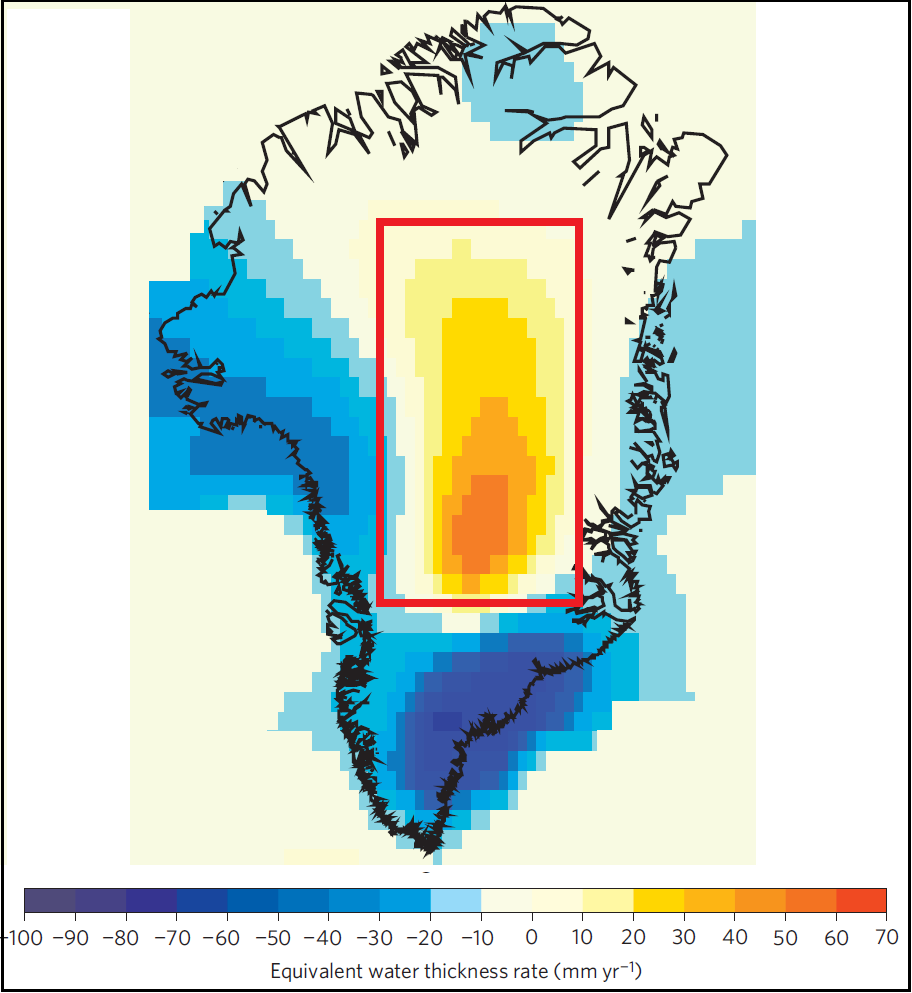
Figure 1: Ice mass changes in Greenland according to Wu et al. 2010, the counterbalance signature is denoted by the red square.
Another even newer study has also been published since Wu et al (2010) which also make ice loss estimates for Greenland. This study (12Sorensen et al. 2010) uses Icesat laser altimeter data from 2003 to 2008 to estimate the mass balance of the Greenland ice sheet to be significantly negative losing 237 ± 25 GT yr-1 over that period. This estimate is over double the estimate of Wu et al (2010) (104 ± 23 GT yr-1) and is also very interesting as they also use a novel approach and test 4 different methods of estimating the mass balance of Greenland from Icesat data. Their estimate of 237 GT yr-1 is using what they felt to be the most accurate method but even the approach that showed the least amount of ice loss (147 Gt yr-1) still showed ice losses significantly greater than Wu et al (2010). The analysis like any other analysis' has its issues but that is why it is important to try and reaffirm these trends using multiple measurement techniques (Figure 4).
This question of the “large counterbalance signature in central Greenland” is one which I find puzzling (see Figure 1) as it is not evident in Sorensen et al’s (2010) paper (Figure 2).
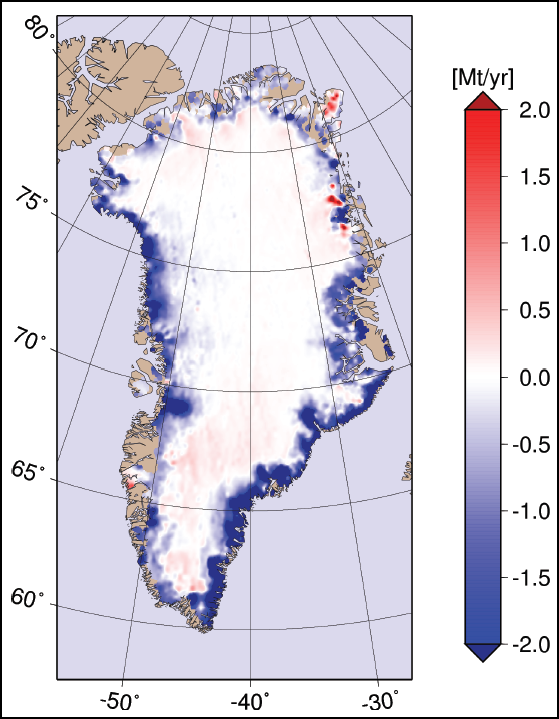
Figure 2: Elevation changes across the Greenland ice sheet based upon Icesat laser altimetry elevation differencing from Sorensen et al. 2010.
Laser altimetry is also sensitive to GIA (though less than Gravimetry) so it is indeed possible that Sorensen et al (2010) perhaps missed this large signature while correcting for GIA, but how can we be sure? One way is to look at data that does not require extensive GIA correction such as Van Den Broeke’s (2009) ice discharge (D) and surface mass balance (SMB) estimates (Figure 3). This analysis compares the incoming precipitation to the outgoing runoff and uses ice velocity measurements across 90% of Greenland to determine if changes in discharge have occurred.
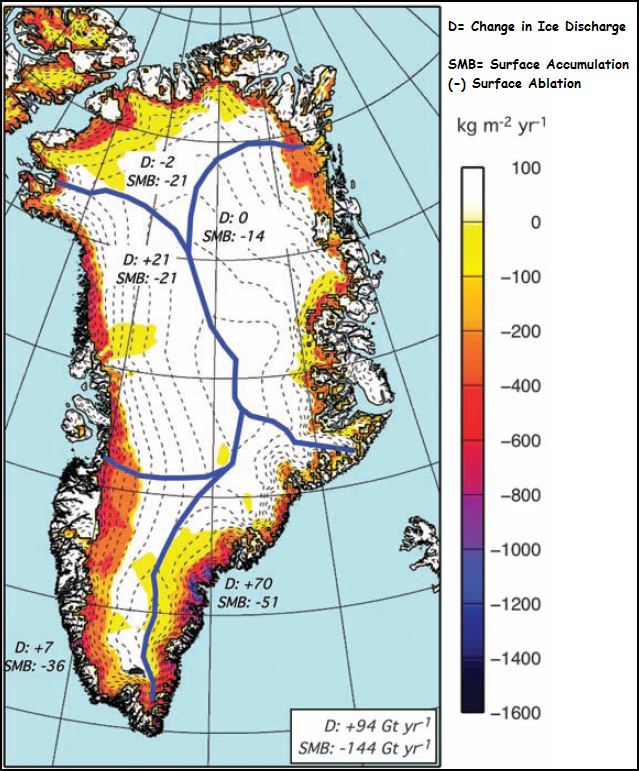
Figure 3: Basin level surface mass balance (SMB) and discharge (D) estimates for the Greenland ice sheet based upon Van Den Broeke et al. 2009 over the period of 2003-2008.
The picture we get from Van Den Broeke’s analysis is that we do not see the dominant accumulation of ice in the center of Greenland that is seen in Wu et al. This is not to say that it is an impossible that this counterbalance signal exists, but it does invoke questions of whether the signal is as strong as in the Wu et al (2010) analysis if other studies’ do not find the same signal using direct measurements of the region rather than a global mass solution.
Wu et al. (in context)
It is important to note that the final word in glaciology should be dependent on agreement among different methods as is the crux of any scientific endeavour (Figure 4). Wu et al (2010) does not agree well with many of the recent mass balance estimates using Interferometric Synthetic Aperture Radar (InSAR), Surface Mass Balance (SMB), Laser Altimetry (Icesat) and Gravimetry (GRACE) results5, 7, 11, 12, 13 but does seem to agree better with estimates using radar altimetry (according to the authors)14, 15, 16. The agreement with radar altimetry data does however bring forward questions as it has been shown that previous radar altimetry surveys have significantly underestimated losses in Greenland due to their coarse resolution17.
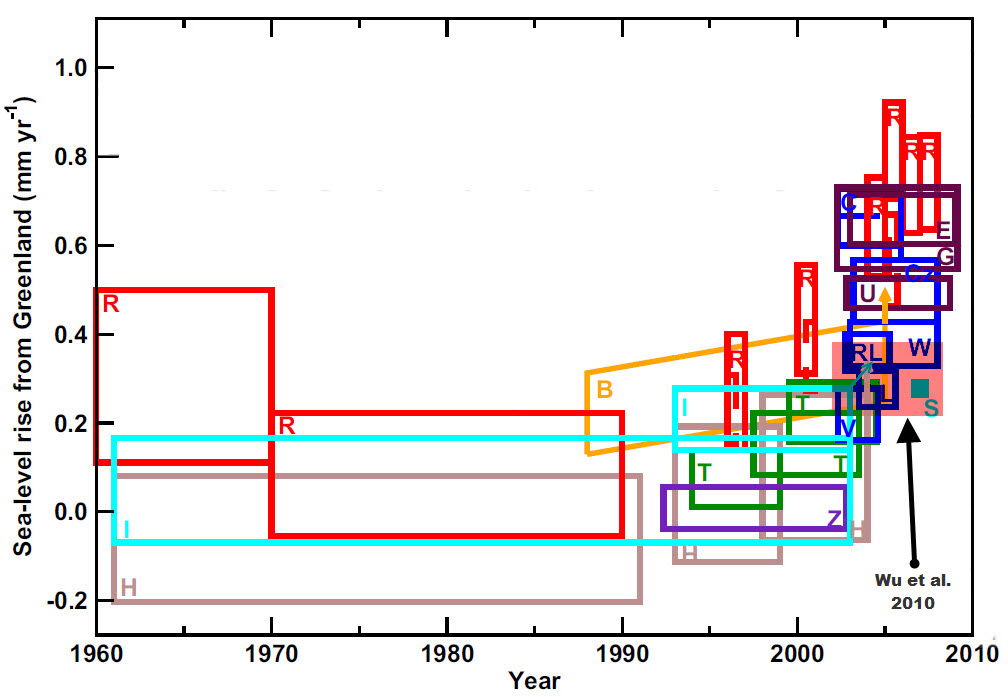
Figure 4: Sea-level rise contributions from Greenland estimated by: Cazenave et al. 2009 (CZ; dark blue), Lemke et al. 2007 (I for IPCC; light blue), Rignot et al. 2008 (R; red), Shepherd and Wingham 2007 (S, light blue), Wouters et al. 2008 (W; dark blue), Box et al. 2006 (B; orange), Hanna et al. 2005 (H; brown), Thomas et al. 2006 (T; dark green), Zwally et al. 2005 (Z; Violet), Rignot and Kanagaratnam 2006 (red dashed), Ramillien et al. 2006 (RL; dark blue), Velicogna and Wahr 2005 (W; dark blue), Luthcke et al. 2006 (L; dark blue), Chen et al. 2006 (C; dark blue), Velicogna 2009 (G, Maroon) and Baur et al. 2009 (U; maroon). Wu et al. 2010 is highlighted in light red. Adapted from Alley et al. 2010.
Forgotten in all this is that Wu et al (2010) still find extensive ice losses for Greenland that are at the absolute upper end of IPCC predictions (Figure 5) and Wu et al (2010) do not cover 2009 or 2010 making their estimates likely unrepresentative of the current situation in Greenland as ice loss has been accelerating since 2006 5, 8. Wu et al (2010) represent another single estimate which can be added to the plethora of other studies (Figure 4) which show extensive ice losses from Greenland that are accelerating. A single estimate cannot be “the best” estimate with the degree of uncertainty which exists among the measurement techniques today, but what we can say is that all methods do agree that Greenland is losing ice extensively, and that these losses are accelerating18.
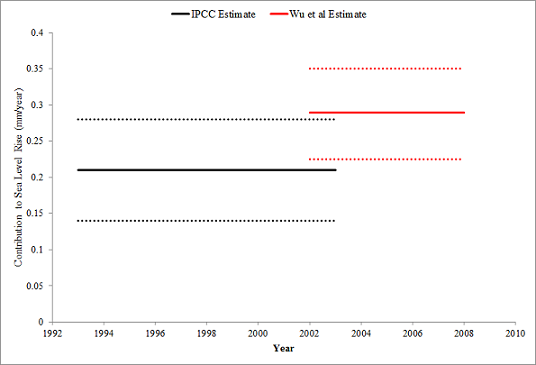
Figure 5: Wu et al (2010) estimate of sea level rise contribution for Greenland compared with IPCC AR4 predictions.
Some more context
According to the Arctic Report Card’s update for 2010 (Richter-Menge, J., and J.E. Overland, Eds., 2010: Arctic Report Card 2010) Greenland experienced the highest recorded melt rate since monitoring began in 1958 with a melt area that was also the highest on record since monitoring begin in 1978. The rate of area loss in marine-terminating glaciers was also calculated to be the greatest on record with 417 km2 of glacier ice being lost. Another interesting caveat to make note of is that some of the same skeptics who trot out this study as evidence of underestimated ice losses, are the same individuals who made claims that its too cold in East Antarctica to lose ice, yet this study finds an ice loss of 23 Gt/year from East Antarctica. Another example of the many skeptic contradictions.
[1] Wu et al. 2010 [2] Chen et al. 2006 [3] Wouters et al. 2008 [4] Van den Broeke 2009 [5] Velicogna 2009 [6] Cazenave et al. 2009 [7] Chen et al. 2009 [8] Khan et al. 2010 [9] Sorensen and Forsberg 2010 [10] Bamber and Riva 2010 [11] Van den Broeke et al. 2009 [12] Sorensen et al. 2010 [13] Rignot et al. 2008 [14] Zwally et al. 2005 [15] Thomas et al. 2006 [16] Wingham et al. 2006 [17] Thomas et al. 2008 [18] Allison et al 2009


