Climate Science Glossary

Term Lookup

Enter a term in the search box to find its definition.

Settings

Use the controls in the far right panel to increase or decrease the number of terms automatically displayed (or to completely turn that feature off).

Term Lookup

Settings


All IPCC definitions taken from Climate Change 2007: The Physical Science Basis. Working Group I Contribution to the Fourth Assessment Report of the Intergovernmental Panel on Climate Change, Annex I, Glossary, pp. 941-954. Cambridge University Press.

Home Arguments Software Resources Comments The Consensus Project Translations About Support

Twitter Facebook YouTube Mastodon MeWe

RSS Posts RSS Comments Email Subscribe


Climate's changed before
It's the sun
It's not bad
There is no consensus
It's cooling
Models are unreliable
Temp record is unreliable
Animals and plants can adapt
It hasn't warmed since 1998
Antarctica is gaining ice
View All Arguments...


Username
Password
New? Register here
Forgot your password?

Latest Posts

Archives

Part Two: How do we measure Antarctic ice changes?

Posted on 15 July 2010 by robert way

Guest post by Robert Way

This post summarizes the three key methods through which ice sheet losses are measured using satellite data. Although there are indeed some on site measurement techniques which are used by glaciologists, it has become the norm to use satellites for large scale measurements because of their cost-efficiency and coverage compared to on the ground measurement techniques. With regards to understanding Antarctic ice changes, these techniques are all the more important because of the continent’s size, climate, and isolation. Of all the different methods out there, it has become clear that there are three predominant techniques for accurate measurement of ice sheet changes. These consist of measuring elevation change, mass change and flux components.

i) Elevation change

Changes in the elevation of ice across the Antarctic ice sheet is measured using both laser and radar altimetry. Sensors such as these measure the distance from the satellite to the ice surface over time. Radar altimeter signals provide very good coverage for ice sheets but older versions of these satellites had issues with too low a resolution (2-5 km) leading to difficulties in measuring sloped/rough terrain. This low resolution also makes it difficult to measure small outlet glaciers where most mass wastage (ice loss) in Antarctica occurs.

Radar altimeter signals also penetrate the near-surface snow and ice layer introducing a potential bias to the data processing (Allison et al. 2009). A new radar satellite "Cryosat-2" has recently been placed into orbit equipped with a much higher resolution radar altimeter that uses complicated radar combination techniques (radar interferometry) to enhance the radar's horizontal resolution to 250 m while allowing for precise measurements of changes as small as a few centimeters. A further benefit of this satellite is that it will allow for the highest coverage available for an altimeter with measurements capable of being taken up to 88° N/S Latitude. Measurements have already been obtained from this satellite and have stunning detail (Figure 1).


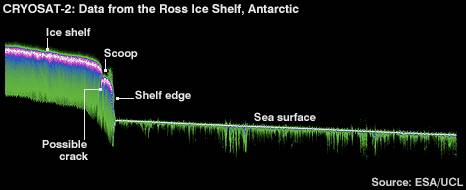
Figure 1: New data from the recently launched Cryosat-2 over the Ross Sea

The second method of measuring elevation change is through using laser altimetry which is essentially a laser beam that measures the height from the satellite to ice surface. This measurement technique is extremely accurate and has a higher resolution than even the new radar altimeters but also has a small footprint (10s of meters) and can be affected by cloud cover (Allison et al. 2009). The most commonly used laser altimeter equipped satellite “Icesat” has no longer any working lasers thereby making satellite borne laser altimetry for ice sheets currently unfeasible but still applicable for aerial surveys or when icesat-2 is launched in 2015.

ii) Mass Changes

Gravimetry directly measures the change in regional gravitational fields through accurate measurements of the amount of effect that gravity has on satellites as they cross these regions. As mass is gained or lost it by the ice sheets, regional gravitational forces are affected, thereby making it possible for mass change estimates to be deduced. Ice sheet mass change has been detected using satellites to measure gravitational field changes through precise monitoring of the separation between a pair of satellites in identical orbits (GRACE Mission) (Allison et al. 2009). Although this method can be significantly affected by things such as crustal uplift and Glacial Isostatic Adjustment (GIA, crustal uplift after the depressing weight of an ice sheet/ice mass is removed), it is important to note that accelerations in mass loss can be detected very effectively and cannot be directly caused by GIA (Velicogna, 2009).

iii) Flux Component Method

The flux component method refers to the estimation of the total mass inputs and mass outputs for each individual drainage basin and ultimately the ice sheet as a whole. Estimating the mass inputs requires knowledge of spatial and temporal patterns of snow accumulation in regions that are oftentimes unsurveyed. In order to make an ice sheet wide snow accumulation map, on site observations of mass through meteorological records, snow pits, ice cores and marker poles are used to ground truth regional accumulation models. These models have been shown to have good agreement with measurements in interpolated regions (Allison et al. 2009). The loss by outflow is usually estimated as the ice discharge across the grounding line of the ice sheet, as this is where ice begins to float and hence contribute to sea level rise. Estimates such as these require observations of the speed of ice flow and the thickness of the column ice. Radar Interferometry has allowed for direct all-weather measurements of surface velocities to be conducted through both a differential method and a speckle tracking method (Figure 2). Depth of ice streams has been estimated using varying means from bedrock topography models to ground penetrating radar surveys. 


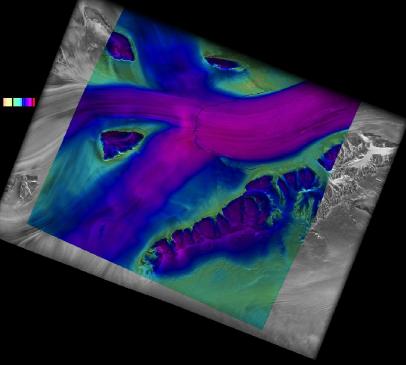
Figure 2: Example of Radar Interferometry Velocity Measurements. Presentation by Eric Rignot at the Alos Palsar Symposium.

Satellite observations have been used to provide wide coverage of ice surface velocities but because the velocity of an ice sheet varies with depth a further level of uncertainty is added to the discharge estimates. For glaciers which move using mostly basal sliding such as outlet glaciers and ice streams with high velocities, this uncertainty is minimized because there is less variation in velocity with depth.

Conclusion
Overall when considering the different measurement techniques, it is important to note that although each individual technique has its own uncertainties, they each can and do effectively measure ice losses in Antarctica. It is also important to note that with time, each technique has become more and more accurate, and that new satellite missions such as Cryosat-2 and Icesat-2 will continue to increase the accuracy of ice loss measurements.

Part three will consist of a detailed rebuttal of several of Goddard’s recent pieces. This section will use much of the information from Parts One and Two in order to formulate this rebuttal.

I would like to thank Professor Jon Ove Hagen (University of Oslo) for helping to proofread and discuss these postings. 

References

Allison, I., Alley, R., Fricker, H., Thomas, R., Warner, R. (2009). Ice sheet mass balance and sea level. Antarctic Science. 21(5), 413-426. doi:10.1017/S0954102009990137

Velicogna, I. 2009. Increasing rates of ice mass loss from the Greenland and Antarctic ice sheets revealed by GRACE. Geophysical Research Letters. 36, L19503, doi:10.1029/2009GL040222.

0 0

Printable Version  |  Link to this page

Comments

Comments 1 to 17:

  1. Excellent once again Robert, nice descriptions of different methods. I look forward to your detailed deconstruction of goddard's arguments, though I guess that might even be the easiest to write! One very minor quibble/note - when discussing resolution of the radar it might be worth noting that the resolution quoted is the horizontal resolution. It's obvious if you already understand the subject, but maybe clarify just in case a goddard drone comes and claims the satellites couldn't possibly measure elevation change!
    0 0
  2. Fixed
    0 0
  3. In science, the only thing better than empirical evidence is multiple lines of empirical evidence all pointing to the same result. In the case of the Antarctic mass budget, the three methods outlined above slowly start to agree on the fact that also the Antarctic ice sheet is currently losing mass. Figure 4.18(b) from the latest IPCC report is a nice visual depiction of different estimates of the Antarctic mass budget using elevation changes (box Z), gravimetry (boxes RL and V) and the flux component method (boxes RT and RT2). The downside of this picture is that it becomes apparent that the observed trends are rather short (less than 15 years), that the uncertainty of the amount of mass loss is rather large (it's somewhere between 0 and -200 Gigatonnes per year) and that the error estimates of the different studies (depicted as the vertical extent of the boxes) sometimes do not even overlap. Cleary, more observations and improved data analysis are required for a clearer picture to emerge. The obvious pitfall of tracking elevation changes is that height needs to be converted to mass. The exchange rate for this conversion is density. Densification of snow via firn to ice is strongly dependent on the accumulation rate and on snow temperature. So if your satellite detects a change in height, it may not mean you lost mass: it could be that the vertical column of snow and ice you're measuring has become a bit denser. It has recently been shown that the effect of decadal accumulation variability has a signature that is as large as the observed trend in elevation itself (Helsen et al. 2009). It means that long records of elevation change and accumulation rates are required to squeeze out a reliable mass change signal, no matter how accurate your laser or radar is. The flux component method requires model calculations on the surface mass balance (roughly, snowfall minus melt minus sublimation). Direct observations are almost impossible due to the sheer size of the continent. Modeling surface mass balance is an ongoing field of research, and a simple thing like sublimation due to drifting snow or melt water production is surprisingly difficult to model, especially since validation is thin on the ground. Nevertheless, I believe that this method can yield good results. My personal feeling is that gravimetry will in the end be the method that can give the most accurate results, but future developments will show if I'm right on this. The multiple lines of evidence are slowly converging to a picture in which Antarctica is losing mass, but we will unfortunately be quite a few years away from nailing down the Antarctic mass loss precisely and consistently among the different methods. On the upside, much progress has been booked in estimating the mass budget of the Greenland ice sheet, serving as an example of where constructive skeptical science can be in a few years time.
    0 0
  4. I will include a similar graph in part 3
    0 0
  5. The figure you just posted, any chance you can find a link for that. I ended up having to edit allison et al. 2009 figure to show the most updated studies but this figure seems to show some of them.
    0 0
  6. Actually Nevermind that last comment, I just realized the end date is only 2005 so I can't modify them.
    0 0
  7. Before the decisive critique (and draw hasty conclusions - by the Antarctic), I recommend first reading this papers: 1. Mass balance of the Antarctic ice sheet, Wingham et al., 2006 "The Antarctic contribution to sea-level rise has long been uncertain. While regional variability in ice dynamics has been revealed, a picture of mass changes throughout the continental ice sheet is lacking. Here, we use satellite radar altimetry to measure the elevation change of 72% of the grounded ice sheet during the period 1992–2003. Depending on the density of the snow giving rise to the observed elevation fluctuations,the ice sheet mass trend falls in the range K5–C85 Gt yrK1. We find that data from climate model reanalyses are not able to characterise the contemporary snowfall fluctuation with useful accuracy and our best estimate of the overall mass trend—growth of 27G29 Gt yrK1—is based on an assessment of the expected snowfall variability. Mass gains from accumulating snow, particularly on the Antarctic Peninsula and within East Antarctica, EXCEED THE ICE DYNAMIC MASS LOSS from West Antarctica. THE RESULT EXACERBATES THE DIFFICULTY OF EXPLAINING TWENTIETH CENTURY SEA-LEVEL RISE. [???]” 2. An updated Antarctic melt record through 2009 and its linkages to high-latitude and tropical climate variability, Tedesco & Monaghan 2009 “A 30-year minimum Antarctic snowmelt record occurred during austral summer 2008–2009 according to spaceborne microwave observations for 1980–2009. Strong positive phases of both the El-Niño Southern Oscillation (ENSO) and the Southern Hemisphere Annular Mode (SAM) were recorded during the months leading up to and including the 2008–2009 melt season. The 30-year record confirms that significant negative correlations exist at regional and continental scales between austral summer melting and both the ENSO and SAM indices for October–January. In particular, the strongest negative melting anomalies (such as those in 2008 and 2009) are related to amplified large-scale atmospheric forcing WHEN BOTH the SAM and ENSO are in positive phases. Our results suggest that enhanced snowmelt is likely to occur if recent positive summer SAM trends subside in conjunction with the projected recovery of stratospheric ozone levels, with subsequent impacts on ice sheet mass balance and sea level trends.”
    0 0
  8. Robert, You can find all the figures from the IPCC report on their website. I am sure there will be updated figures around but you might have to ask persons who are in this business personally.
    0 0
  9. Arkadiusz Semczyszak, I suggest you in fact read the paper you just cited. Wingham et al. 2006 uses a low resolution radar altimeter for its analysis. Notice the description given for radar altimetry above. Radar altimeters of low resolution are not as accurate as other measurement types. Thomas et al. 2008 compares radar and laser altimetry over Greenland and finds that radar underestimates the mass loss there by 75±15 km3. So with all due respect I understand that you may not know these things about remote sensing but you should take the time to at least read up on the subject before trying to rub it in someones face.
    0 0
  10. Arkadiusz Semczyszak, with respect to the 2nd paper. It is an interesting result but lets consider that melting is of little concern in Antarctic when compared with calving and its effects on mass balance. I suggest you read http://www.skepticalscience.com/Part-One-Why-do-glaciers-lose-ice.html for more information if you like. Either way, interesting paper.
    0 0
  11. I agree with pkm #3. Every line of evidence in the science that backs up AGW is in agreement with the other ones. Multiple lines of evidence agreeing with each other. Deniers pick one apparently disagreeing lonely sutdy (usually not even a study, but a mere blog or op-ed text)and bandy it out as the uncovered revelation of "The Truth". Different approaches, consistent results. What else can we demand in terms of scientific evidence?
    0 0
  12. Robert Way at 23:47 PM on 15 July, 2010 Another informative and purposeful piece of science writing. Thanks. I tracked down this image but it is regional (GPS may also merit mention in your elevation discussion as yet another independent check and control). Sorry about resolution, it's better on original. It is from this rather nice SCAR presentation. I do remember another more comprehensive image like the IPCC one, but can't remember where from!
    0 0
  13. Peter Hogarth, I actually quite like the format of the image you showed. Next time I put together something like that I will have to consider putting something similar together as I find it shows a lot things. Thank you for pointing this out. I ended up adapting a figure from the copenhagen diagnosis for my one that you will see tomorrow. It will actually look kinda messy because of so many results being included. I don't remember which paper I saw it in but a recent paper shows a nice plot which just uses dots with error bars. I think that format is more visible. Your scott polar research institute link was interesting too. I had not really kept up with the literature and advances in Autosubs but it seems to me that this is the drection of the future for not only paleoclimatic research but for mineral resources and so on. I find the work really interesting but I must admit that I find it surprising that more grant funding isn't available for missions such as these considering their importance for scientific advancements.
    0 0
  14. Robert Way “Thomas et al. 2008 ...” Whether it's this papers: A DOUBLING [?] in snow accumulation in the western Antarctic Peninsula since 1850.? There is such (a favorite of skeptics) fragment: “Annual accumulation has more than doubled in the last 150 years: the mean for 1855–1864 was 0.49 mweq y-1while for 1997–2006 it was 1.10 mweq y-1. At the beginning of the record annual accumulation is relatively stable until about 1930 when it begins to increase steadily. Following a slight reduction in accumulation in the late 1960s, the most rapid increase occurs in the latter part of the record with the mean accumulation rate from the mid-1970s onwards increasing to 0.95 mweq y-1. Note that for the post-1980 period even the lowest annual accumulation values are still greater than the highest accumulation values from the first half of the record (1855–1924).” IPCC 2007 report : “Antarctic sea ice extent continues to show inter-annual variability and localized changes but no statistically significant average trends, CONSISTENT WITH THE LACK OF WARMING REFLECTED IN ATMOSPHERIC TEMPERATURES AVERAGED ACROSS THE REGION” ; “Current global model studies project that the Antarctic ice sheet will remain TOO COLD for widespread surface melting and is expected to gain in mass due to increased snowfall.” Of course, growth of the ice sheet may well be evidence of warming, but then we have nothing to fear when it comes to sea level. None of the methods described here are not detailed enough to authorize such a declaration that: Antarctic ice really quickly lose land (do you really lose?). In any case I will add that this works like this: Extensive dynamic thinning on the margins of the Greenland and Antarctic ice sheets, Pritchard, 2008(9? - is variously dated), suggesting that the same is happening in the Arctic and Antarctica is the only way that: „... Amundsen Sea embayment of Antarctica, thinning exceeded 9.0 m yr-1 for some glaciers.”; an example of a typical "c. p.”. For me it is not "pure" science - even to discuss. For "cool" temperature of the discussion (in Poland - the heat wave) I propose: Kinematic Constraints on Glacier Contributions to 21st-Century Sea-Level Rise, Pfeffer et al., 2008: “We consider glaciological conditions required for large sea-level rise to occur by 2100 and conclude that increases in excess of 2 meters are physically untenable. We find that a total sea-level rise of about 2 meters by 2100 could occur under physically possible glaciological conditions but only if all variables are quickly accelerated to extremely high limits. More plausible but still accelerated conditions lead to total sea-level rise by 2100 of about 0.8 meter. These roughly constrained scenarios provide a "most likely" starting point for refinements in sea-level forecasts THAT INCLUDE ICE FLOW DYNAMICS. [!!!]” Well, well ... For me this is very strange that the latter paper is not cited in: The SCAR Antarctic Climate Change and the Environment (ACCE) report (Antarctic Climate Change and the Environment – An Update, 2010); and only: Vermeer and Rahmstorf (2009): Global
sea
level
linked
to
global
temperature., and Velicogna (2009). However, the SCAR report is very, very interesting ... and should "give a thought" ...
    0 0
  15. Okay dude, you have to tone it down a little. The thomas et al. study I pointed to had nothing to do with antarctica but was rather about Greenland, it is entitled "A comparison of Greenland ice-sheet volume changes derived from altimetry measurements " and concludes that Radar alimetry overestimates gains at high altitudes by 75 Gt year. The Pfeffer et al. 2008 study is a good study. And it concludes that sea level rise will be greater than IPCC median predictions. I don't know why you even brought it up? Whose talking about sea level. Regardless Vermeer and Rahmstorf is newer and shows relation between temperature and sea level which is important. Maybe that's why they put it in? I haven't really seen Pritchard et al. 2009 being dated differently but sure. If you want to discuss mass balance estimates you can start by checking out the figure at the bottom of here http://www.skepticalscience.com/Part-Three-Response-to-Goddard.html About the IPCC (2007). Steig et al. 2009 conclude that Antarctica has warmed, particularly western portions. The IPCC is a meticulous document but also a political one and tends to not include the latest literature. IPCC models on ice losses do not include ice dynamical processes and thereby have been proven wrong time and time again as both Antarctic and Greenland mass losses are extensive. (See chen et al. 2009, Velicogna 2009, Rignot et al. 2008a, Rignot et al. 2008b, Cazenave et al. 2009 and so on). With all due respect. You aren't really making a whole lot of sense. You are throwing all kinds of evidence out there which only suggests that you are cherry picking the literature.
    0 0
  16. "Of course, growth of the ice sheet may well be evidence of warming" I have seen this type of logic used before. Just how is this suppose to happen: More snow is caused by more warming water vapor put into the atmosphere? It is my understanding, and someone please correct me if I am in error, that the net effect of evaporation of water to form atmospheric moisture, is one of cooling. That is, the net cooling effect overrides the warming effect of the water vapor created. That is why a wet towel in front of a fan can cool the air.
    0 0
  17. Very useful feedback, thanks
    0 0

You need to be logged in to post a comment. Login via the left margin or if you're new, register here.


The Consensus Project Website

THE ESCALATOR

(free to republish)


© Copyright 2024 John Cook
Home | Translations | About Us | Privacy | Contact Us