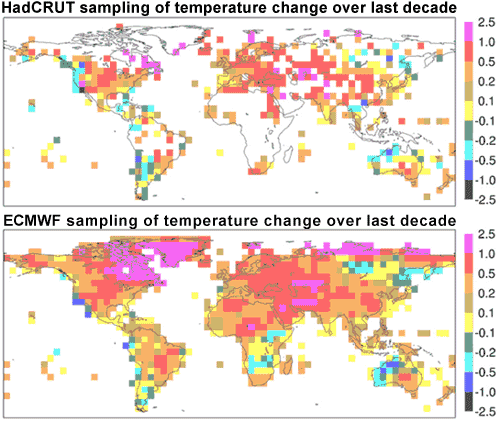
Figure 1: Increase in mean near-surface temperature (°C) from (1989-98) to (1999-2008). Top figure shows HadCRUT sampling regions, lower figure shows ECMWF analysis (ECMWF 2009).
The argument "global warming stopped in 1998" still enjoys popularity (in fact, #7 on the skeptic leaderboard). The nuanced response to this line of thought is to point out that global warming is fundamentally due to the planet accumulating heat. Direct observations find the planet's total heat content has continued to rise past 1998 (Murphy 2009). Recent ocean heat measurements show the planet has been in positive energy imbalance to the end of 2008 (Schuckmann 2009). Global warming is still happening. Nevertheless, there is a simpler response to the argument that 1998 is the hottest year on record. It's not true. 1998 is not the hottest year on record.
The most prominent global temperature records come from the Hadley Centre at the University of East Anglia (HadCRUT), a branch of NASA called the Goddard Institute of Space Studies (NASA GISS) and the National Climatic Data Center which is part of the USA government’s National Oceanographic and Atmospheric Administration (NOAA). Of these three records, only the HadCRUT record shows 1998 as the hottest year on record. While all three records show near identical long term trends, there are differences on a year-to-year basis. GISS and NOAA both find 2005 is the hottest year on record (with 2009 possibly on track to pip 1998 as the second hottest year on record).
A new independent analysis of the HadCRUT record sheds light on this discrepancy. The analysis is by the European Centre for Medium-Range Weather Forecasts (ECMWF) who calculated global temperature, utilising a range of sources including surface temperature measurements, satellites, radiosondes, ships and buoys. They found recent warming has been higher than that shown by HadCRUT. This is because HadCRUT is sampling regions that have exhibited less change, on average, than the entire globe.
Figure 1 shows the regions that HadCRUT have sampled compared to the regions ECMWF included in their dataset. The ECMWF analysis shows that in data-sparse regions such as Russia, Africa and Canada, there is strong warming over land that is not included in the HadCRUT's sampling data. This leads the ECMWF to infer with high confidence that the HadCRUT record is at the lower end of likely warming.

Figure 1: Increase in mean near-surface temperature (°C) from (1989-98) to (1999-2008). Top figure shows HadCRUT sampling regions, lower figure shows ECMWF analysis (ECMWF 2009).
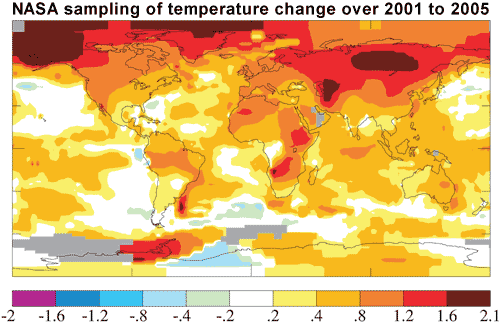
This result is not unexpected. NASA GISS found a major contributor to the record hot 2005 was the extreme Arctic warming (Hansen 2006). As there are few meterological stations in the Arctic, NASA extrapolated temperature anomalies from the nearest measurement stations. They found the estimated strong Arctic warmth was consistent with infrared satellite measurements and record low sea ice concentrations.

Figure 2: Surface temperature anomaly for the first half decade of the 21st century (Hansen 2006).
For the record, I've updated the "global warming stopped in 1998" page, adding the ECMWF analysis. However, I've still kept the discussion of total heat content as more prominent in the hope that this will lead to greater scientific understanding.
Posted by John Cook on Wednesday, 23 December, 2009
 |
The Skeptical Science website by Skeptical Science is licensed under a Creative Commons Attribution 3.0 Unported License. |