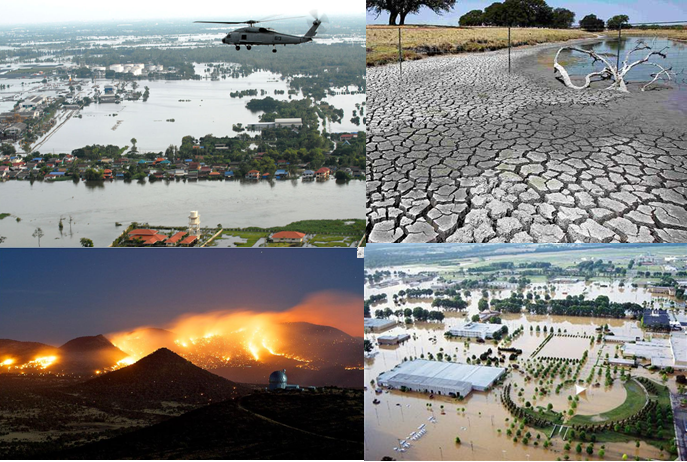
 Figure 1 - Hell and High Water? A helicopter surveys the devastation of Bangkok, Texas suffers brutal drought and a massive fire season, while Millington, Tennessee is under water.
Dramatic events grab headlines, and in the 2011 weather & climate sections of newspapers we've seen walls of fire burn across the American south, heartbreaking stories of Texan farmers losing their livelihoods to a record-breaking one year drought combined with record-breaking heat, tragedy across the midwest as a super active tornado season tore apart towns and massive flooding across the eastern states as record-breaking snowmelt combined with storms pounding the coast.
The US grabbed most of the news thanks to a record-breaking number of billion dollar weather disasters, but there have been weather & climate tragedies elsewhere: East African drought has caused the first UN announced famine in Africa in 30 years, heavy floods in Thailand have caused politicians there to suggest moving the capital (as well as rising seas, Bangkok is sinking into the ground) and scientists from Environment Canada have said that for the first year recorded, it was not a white Christmas for most Canadians.
 Figure 1 - Hell and High Water? A helicopter surveys the devastation of Bangkok, Texas suffers brutal drought and a massive fire season, while Millington, Tennessee is under water.
However, science is not about picking individual events that suit the story you want to tell. These events are consistent with global warming, but scientists won't point the finger until they've studied the data in detail, so it will be some time before we know how much global warming contributed to this year's remarkable events.
2010 was similarly frenetic: enormous floods in Pakistan, Colombia, Australia, Sri Lanka and South Africa, a record-breaking heatwave in Russia and the first single-season race around the North Pole in sailing ships, made possible by the disappearing sea ice. Amundsen's 1903 expedition took 3 years to manage the north-west passage, versus the 3 months for the Norwegian & Russian crews who did both the north-west and north-east passages!
It took until 2011 before scientists had checked the numbers and worked out that there is an 80% chance that the Russia's 2010 record-breaking warmth, and the tens of thousands of deaths that went with it, wouldn't have happened without global warming (Rahmstorf & Coumou, 2011).
Scientists look at all the available data: previous study of the US has found that hot records are now overwhelming cold records by 2:1 (Meehl et al, 2009), and a new NASA paper (Hansen, Sato & Ruedy, in press) shows that several recent heatwaves had a less than 1-in-750 chance of occurring naturally in the climate of a few decades ago. Events and analysis over the past years has now shown that we can be pretty confident that the first 'climate change disasters' and associated deaths have surely occurred.
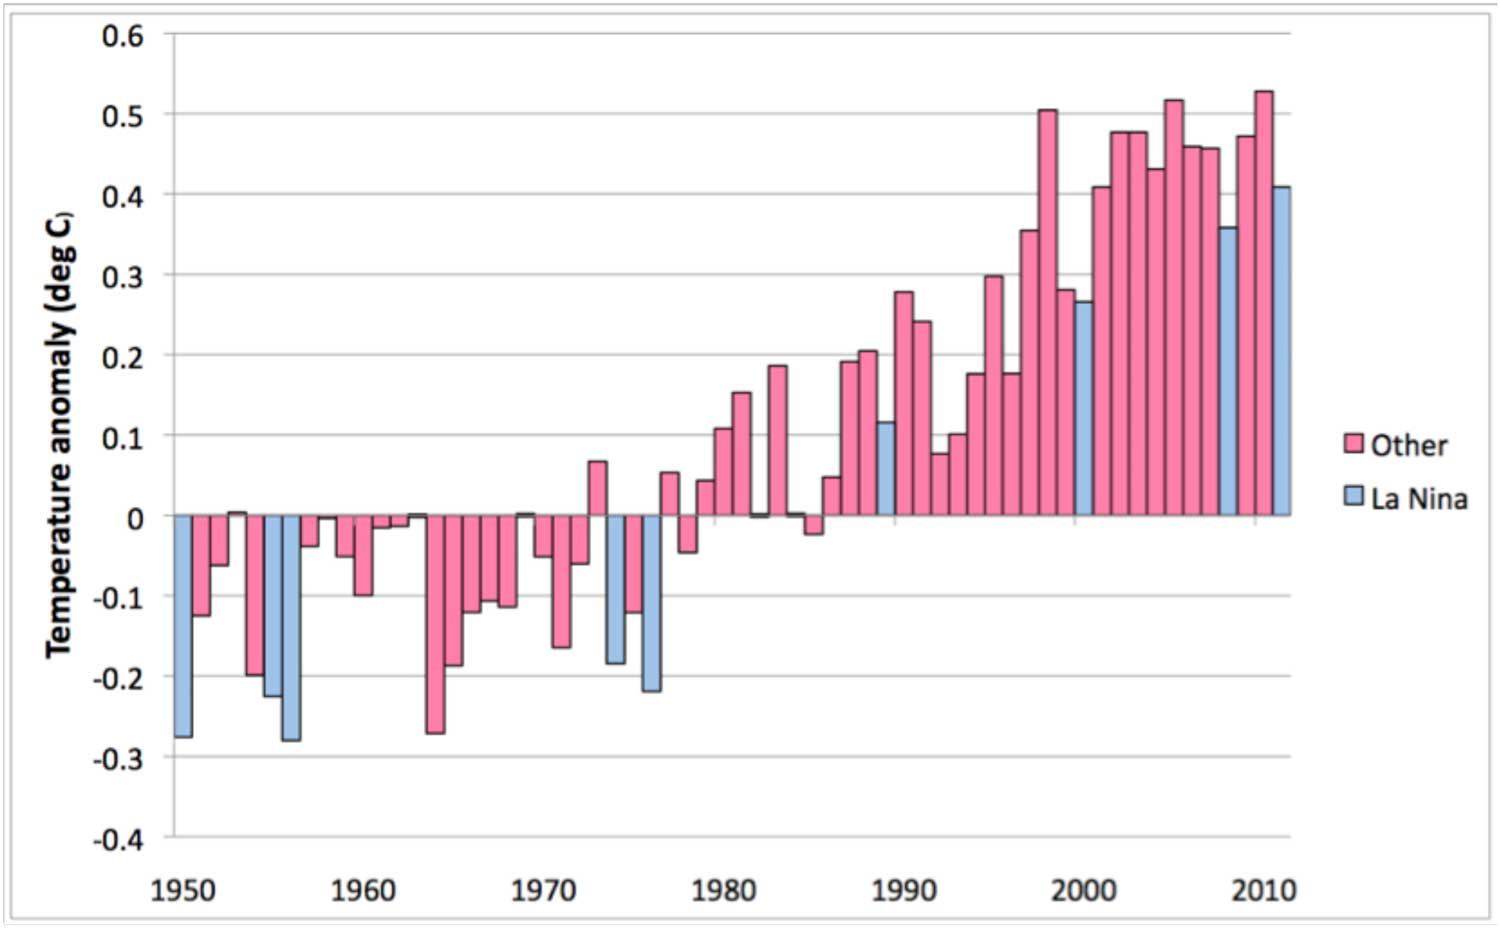
2011 was expected to be less dramatic and slightly cooler than 2010 because the Pacific ocean spent this year in a 'La Nina' cool phase, which slightly chills off global temperatures until the cycle switches back within a few years. The World Meteorological Organisation reports that 2011 has been the warmest La Nina year measured.

Figure 2 - global temperature change reported by the WMO. Blue years had 'La Nina' conditions in the Pacific, which acts to cool down temperatures. 2011 is the warmest La Nina year recorded.
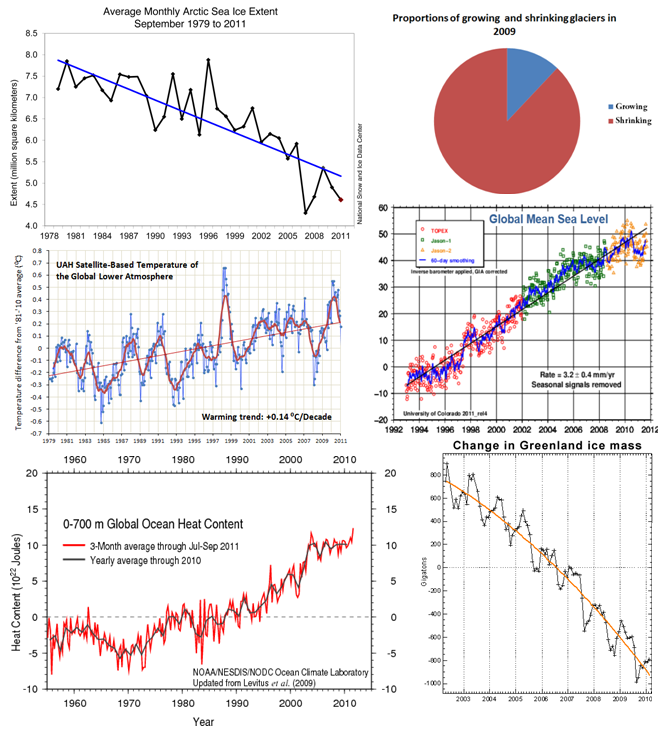
Meanwhile Arctic sea ice kept up its shrinking trend, coming in at the second lowest September recorded. Antarctic sea ice, temporarily protected by wind and ocean changes, remains stable (with a long term trend that is increasing, but not statistically significant) - we find that globally, sea ice is shrinking.
Satellite measurements of sea level show a rise of +3.2 mm/year, an acceleration of about 90% from last century's average (Church & White, 2006). Last year NASA reported a 'pothole on the road to higher seas', where it rained so hard that the seas fell. This couldn't continue forever (Australia, Pakistan, Sri Lanka and Colombia surely didn't want it to last any longer), and as the oceans have warmed, floodwater has filtered back to the oceans and ice has continued to melt in 2011, sea levels rose once again.
Initial data from the ARGO network of 3,000+ buoys suggest that the top 700 metres of the ocean is beginning to warm again after a 7 year slow down (discussed here and here), while scientists have found that heat has continued to go into melting ice and the deeper ocean below 700 metres (Church et al, 2011).
Greenland, despite not reaching some of the record-breaking high temperatures it has seen recently, has likely seen near record-breaking melt in 2011, with hundreds of billions of tons more ice lost according to computer simulations (Tedesco et al, 2011). These need to be confirmed by other measurements: gravity field satellites are used to 'weigh' the Greenland ice sheet and show hundreds of billions of tons of ice loss from 2002-2010, expect 2011 results in the coming months.
The World Glacier Monitoring Service released their bulletin, reporting on the state of glaciers measured from 2008 and 2009, and found that 90% are shrinking.
 Figure 3 - Some of the data published in 2011: September sea ice extent in the Arctic, changes in heat content of the upper 700 metres of the oceans, changes in Greenland's ice mass and temperature of the lower atmosphere measured by satellites, global sea levels and the fractions of glaciers which were measured as growing and shrinking.
In 2009, soon before the Copenhagen climate negotiations, criminals stole and published private emails from UEA, a British university. Climate conspiracy theories got the media spotlight and in response independent reviews were started. All 9 reviews cleared the scientists and their work, although they stated that more effort to make data public was needed.
In the first round of emails the two biggest critiques of the science (as opposed to personal or political critiques) relied on cherry picking quotes, and were 'hide the decline' (discussed here, and publically by the scientists involved 11 years before the email release) and Trenberth's 'travesty' (discussed here, and publically by the scientist involved months before the criminals published the emails).
In 2011, just before the Durban climate negotiations, the criminals released more of the stolen emails and this time the critiques focused pretty exclusively away from the scientific work.
A major criticism of the scientists involved was that a small portion of the data used to create the temprature records was not centrally available. Despite this, at least 9 external groups were able to check the work, whilst the critics typically refused to do so. In July the data from all but 17 Polish weather stations was released by the UK Met Office, to complete silence from the critics.
A potential problem with the weather stations used to create the temperature record is 'microsite influences': stations being near air conditioners or other things which might affect their readings. Anthony Watts, a skeptic blogger proposed that this is important, and helped to organise volunteers into photographing US weather stations to classify their quality. After hard work and calling in help from climate scientists, they published their results (Fall et al, 2011) and found that the effect on measuring warming is effectively zero.
But microsite influences are just one potential problem when trying to use thermometers to measure changes on Earth. Critics commonly stated that the methods used by scientists to account for these changes weren't good enough, often without understanding how they work.
To test these claims even more, Dr Richard Muller, a skeptical physicist, formed the Berkeley Earth Surface Temperature (BEST) project to calculate global land warming using more data and different statistical methods to all the other groups.
They confirmed that global warming is happening, and that UEA, the university at the centre of the email storm had likely been underestimating it!
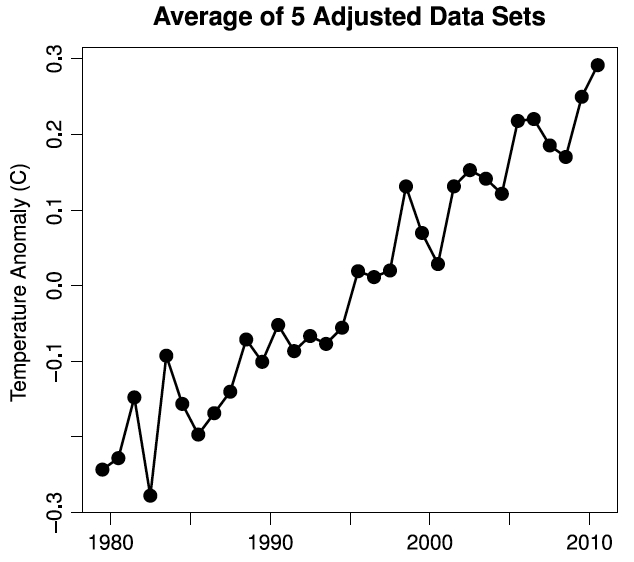
Finally, work by Foster and Rahmstorf (2011) used thermometer and satellite data to work out the effect of the Sun, Pacific Ocean changes (El Nino and La Nina) and volcanoes on temperatures over the past decades. They found that, combined together, these 3 natural causes had been acting to cool down Earth, but the global warming trend was strong enough to overpower them. Once you take out these natural factors to see if there is a background climate change, global warming is clear, with the two warmest years being 2009 and 2010 (2011 data weren't included because they weren't available when the work was done). Dana provides an excellent discussion with more pictures here.
 Figure 4 - The average temperature change recorded by 5 teams of scientists: 2 working on satellites (University of Alabama, Huntsville and Remote Sensing Systems) and 3 working with thermometers and ship/buoy measurements (UK Hadley Centre & Climate Research Unit, NASA Goddard Institute for Space Studies and the US National Climatic Data Centre. Statistical methods have been used to 'take out' the effects of volcanic eruptions, Pacific Ocean cycles and the Sun.
Science is the the slow buildup of work by thousands of scientists year after year. Thanks to them we know that glaciers are melting, ice sheets are shrinking, the oceans are rising and heating up, sea ice is retreating and the atmosphere is warming.
Work by Rahmstorf and Coumou showed that global warming probably made the Russian heatwave as severe and deadly as it was.
Further work on the temperature record by Watts, Muller and Foster has torpedoed the idea that global warming is an 'artifact' of measurement errors. Foster & Rahmstorf's work shows that 3 major known natural causes of climate change are not responsible for the warming and that there is a 'global warming signal' as predicted by physics and measurements of carbon dioxide's heating effect.
But that's not the end of the story of 2011: science continues its march forwards and in the next post we'll look at some of the interesting research results of 2011.
Posted by MarkR on Saturday, 31 December, 2011
 |
The Skeptical Science website by Skeptical Science is licensed under a Creative Commons Attribution 3.0 Unported License. |