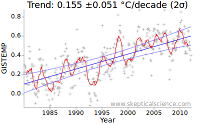
 Skeptical Science is pleased to provide a new tool, the Skeptical Science temperature trend uncertainty calculator, to help readers to evaluate critically claims about temperature trends.
 Skeptical Science is pleased to provide a new tool, the Skeptical Science temperature trend uncertainty calculator, to help readers to evaluate critically claims about temperature trends.
The trend calculator provides some features which are complementary to those of the excellent Wood For Trees web site and this amazing new tool from Nick Stokes, in particular the calculation of uncertainties and confidence intervals.
| Start the trend calculator | to explore current temperature data sets. |
| Start the trend calculator | to explore the Foster & Rahmstorf adjusted data. |
What can you do with it?
That's up to you, but here are some possibilities:
Health warnings
As with any statistical tool, the validity of the result depends on both the expertise and the integrity of the user. You can generate nonsense statistics with this tool. Obvious mistakes would be calculating the autocorrelations from a period which does not show an approximately linear trend, or using unrealistically short periods.
Temperature trends are often quoted in the global warming debate. As with any statistic, it is important to understand the basis of the statistic in order to avoid being misled. To this end, Skeptical Science is providing a tool to estimate temperature trends and uncertainties, along with an introduction to the concepts involved.
Not all trends are equal - some of the figures quoted in the press and on blogs are completely meaningless. Many come with no indication of whether they are statistically significant or not.
Furthermore, the term ‘statistically significant’ is a source of confusion. To someone who doesn’t know the term, ‘no statistically significant trend’ can easily be misinterpreted as ‘no trend’, when in fact it can equally well mean that the calculation has been performed over too short a time frame to detect any real trend.
Whenever we calculate a trend from a set of data, the value we obtain is an estimate. It is not a single value, but a range of possible values, some of which are more likely than others. So temperature trends are usually expressed something like this: β±ε °C/decade. β is the trend, and ε is the uncertainty. If you see a trend without an uncertainty, you should consider whether the trend is likely to be meaningful.
There is a second issue: The form β±ε °C/decade is ambiguous without an additional piece of information: the definition of uncertainty. There are two common forms. If you see an uncertainty quotes as ‘one sigma’ (1σ), then this means that according to the statistics there is a roughly 70% chance of the true trend lying between β-ε and β+ε. If you see an uncertainty quoted as ‘two sigma’ (2σ), then this means that according to the statistics there is a roughly 95% chance of the true trend lying between β-ε and β+ε. If the trend differs from some ‘null hypothesis’ by more than 2σ, then we say that the trend is statistically significant.
How does this uncertainty arise? The problem is that every observation contains both the signal we are looking for, and spurious influences which we are not - noise. Sometimes we may have a good estimate of the level of noise, sometimes we do not. However, when we determine a trend of a set of data which are expected to lie on a straight line, we can estimate the size of the noise contributions from how close the actual data lie to the line.
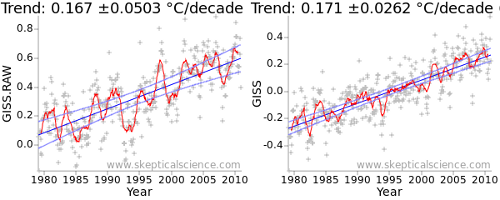
The fundamental property which determines the uncertainty in a trend is therefore the level of noise in the data. This is evident in the deviations of the data from a straight line. The effect is illustrated in Figure 1: The first graph is from the NASA GISTEMP temperature record, while the second uses the adjusted data of Foster and Rahmstorf (2011) which removes some of the short term variations from the signal. The adjusted data leads to a much lower uncertainty - the number after the ± in the graph title. (There is also a second factor at play, as we shall see later.)

The uncertainty in the trend has been reduced from ~0.05°C/decade to less than 0.03°C/decade.
Note that the definition of noise here is not totally obvious: Noise can be anything which causes the data to deviate from the model - in this case a straight line. In some cases, this is due to errors or incompleteness of the data. In others it may be due to other effects which are not part of the behaviour we are trying to observe. For example, temperature variations due to weather are not measurement errors, but they will cause deviations from a linear temperature trend and thus contribute to uncertainty in the underlying trend.
In statistics, the uncertainty in a statistic estimated from a set of samples commonly varies in inverse proportion to the square root of the number of observations. Thus when you see an opinion poll on TV, a poll of ~1000 people is often quoted as having an uncertainty of 3%, where 3% = 1/√1000. So in the case of temperature trends, we might expect the uncertainty in the trend to vary as 1/√nm, where nm is the number of months of data.
However a second effect comes into play - the length of time over which observations are available. As the sampling period gets longer, the data points towards the ends of the time series gain more 'leverage' in determining the trend. This introduces an additional change in the uncertainty inversely proportional to the sampling period, i.e. proportional to 1/nm.
Combining these two terms, the uncertainty in the trend varies in proportion to nm3/2. In other words, if you double the number of months used to calculate the trend, the uncertainty reduces by a factor of ~2.8.
The two contributions to uncertainty described above are widely known. If for example you use the matrix version of the LINEST function found in any standard spreadsheet program, you will get an estimate of trend and uncertainty taking into account these factors.
However, if you apply it to temperature data, you will get the wrong answer. Why? Because temperature data violates one of the assumptions of Ordinary Least Squares (OLS) regression - that all the data are independent observations.
In practice monthly temperature estimates are not independent - hot months tend to follow hot months and cold months follow cold months. This is in large part due to the El Nino cycle, which strongly influences global temperatures and varies over a period of about 60 months. Therefore it is possible to get strong short term temperature trends which are not indicative of a long term trend, but of a shift from El Nino to La Nina or back. This ‘autocorrelation’ leads to spurious short term trends, in other words it increases the uncertainty in the trend.
It is still possible to obtain an estimate of the trend uncertainty, but more sophisticated methods must be used. If the patterns of correlation in the temperature data can be described simply, then this can be as simple as using an ‘effective number of parameters’ which is less than the number of observations. This approach is summarised in the methods section of Foster and Rahmstorf (2011) [Note that the technique for correcting for autocorrelation is independent of the multivariate regression calculation which is the main focus of that paper].
This is the second effect in play in the difference in uncertainties between the raw and adjusted data in Figure 1: Not only has the noise been reduced, the autocorrelation has also been reduced. Both serve to reduce the uncertainty in the trend. The raw and corrected uncertainties (in units of C/year) are shown in the following table:
| Raw uncertainty (σw) | N/Neff (ν) | Corrected uncertainty (σc=σw√ν) | |
| GISTEMP raw | 0.000813 | 9.59 | 0.00252 |
| GISTEMP adjusted | 0.000653 | 4.02 | 0.00131 |
You can test this effect for yourself. Take a set of time series, say a temperature data set, and calculate the trend and uncertainty in a spreadsheet using the matrix form of the LINEST function. Now fabricate some additional data by duplicating each monthly value 4 times in sequence, or better by interpolating to get weekly temperature values. If you recalculate the trend, you will get the same trend but roughly half the uncertainty. If however the autocorrelation correction described above was applied, you would get the same result as with the actual data.
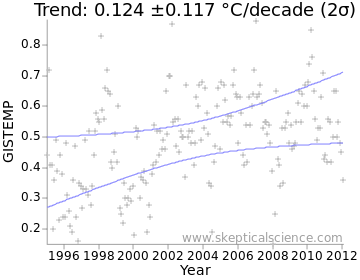
The uncertainty in the slope is not the only source of uncertainty in this problem. There is also an uncertainty in estimating the mean of the data. This is rather simpler, and follows the normal law of varying in inverse proportion to the square root of the number of data. When combined with the trend uncertainty, this leads to an uncertainty which is non-zero even at the center of the graph. The mean and the uncertainty in the trend both contribute to the uncertainty at any time. However, uncertainties are always combined by adding their squares, not the actual values.
We can visualise the combined uncertainty as a confidence interval on a graph. This is often plotted as a ‘two sigma’ (2σ) confidence interval; the actual trend is likely to lie within this region approximately 95% of the time. The confidence interval is enclosed between the two light-blue lines in Figure 2:

The Skeptical Science temperature trend uncertainty calculator is a tool to allow temperature trends to be calculated with uncertainties, following the method in the methods section of Foster and Rahmstorf (2011) (Note: this is incidental to the main focus of that paper). To access it, you will need a recent web browser (Internet Explorer 7+, Firefox 3.6+, Safari, Google Chrome, or a recent Opera).
Open the link above in a new window or tab. You will be presented with a range of controls to select the calculation you require, and a ‘Calculate’ button to perform the calculation. Below these is a canvas in which a temperature graph will be plotted, with monthly temperatures, a moving average, trend and confidence intervals. At the bottom of the page some of the intermediate results of the calculation are presented. If you press ‘Calculate’ you should get a graph immediately, assuming your browser has all the required features.

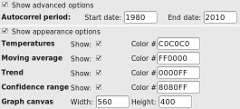
The controls are as follows:

If you click the ‘Advanced options’ checkbox, you can also select the period used for the autocorrelation calculation, which determines the correction which must be applied to the uncertainty. The period chosen should show a roughly linear temperature trend, otherwise the uncertainty will be overestimated. Using early data to estimate the correction for recent data or vice-versa may also give misleading results. The default period (1980-2010) is reasonable and covers all the datasets, including the BEST preliminary data. Foster and Rahmstorf use 1979-2011.
If you click the ‘Appearance options’ checkbox, you can also control which data are displayed, the colors used, and the size of the resulting graph. To save a graph, use right-click/save-image-as.
The data section gives the trend and uncertainty, together with some raw data. β is the trend. σw is the raw OLS estimate of the standard uncertainty, ν is the ratio of the number of observations to the number of independent degrees of freedom, and σc is the corrected standard uncertainty. σc and σw are always given in units of °C/year.
Acknowledgements:
In addition to papers quoted in the article, Tamino's 'Open Mind' blog provided the concepts required for the development of this tool; in particular the posts Autocorrelation, Alphabet soup 3a, and Alphabet soup 3b. At 'Climate Charts and Graphs', the article Time series regression of temperature anomaly data also provides a very readable introduction. Google's 'excanvas' provides support for Internet Explorer browsers.
Thanks to Sphaerica, Andy S, Sarah, Paul D and Mark R, Neal and Dana for feedback, and to John Cook for hosting the tool.
Data was obtained from the following sources: GISTEMP, NOAA, HADCRUT, RSS, UAH, BEST.
 For a short-cut, look for the Temperature Trend Calculator Button in the left margin.
Posted by Kevin C on Tuesday, 27 March, 2012
 |
The Skeptical Science website by Skeptical Science is licensed under a Creative Commons Attribution 3.0 Unported License. |