The UK Meteorological office have for many years published estimates of the global mean surface temperature record from 1850. Over the last decade it has been noted that this record has shown little or no warming. The Skeptical Science trend calculator shows that the difference between the HadCRUT3v trend and the IPCC forecast over the past 15 years is statistically significant at the 95% level. What is going on?
Foster and Rahmstorf (2011) have shown that two natural cycles - the El Nino Southern Oscillation (ENSO), and the solar cycle - have contributed temporarily to this apparent slowdown in global warming. But the slowdown is much more obvious in the HadCRUT3v data. Why?
The clues lie in one basic statistical principle, and two features of the data.
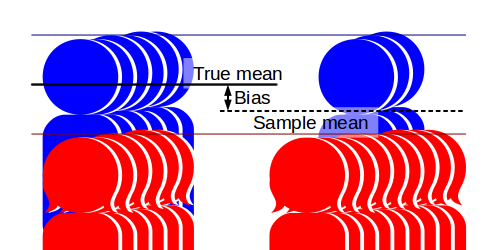
Suppose you want to determine some statistic on a large dataset, say the average height of the children of a given age. You could simply measure everyone. But that would be impractical. So normally you would measure the heights of a representative sample group. If the group is large enough, the average height of the sample group will give a good estimate of the average height of age group as a whole.
Or will it? Suppose three quarters of your sample group are girls. Girls make up approximately half of the population as a whole. But girls in the chosen age group are on average shorter than boys. If girls make up three quarters of your sample group, then the average height of the sample group (the 'sample mean') will be lower than the average for the population as a whole (the true 'population mean'). The sample group is not representative of the population, and as a result produces a biased estimate.

The problem is that the population is stratified - it is divided into groups with different statistics. A representative sample from this population must be both 'big enough', and contain appropriate proportions of the different strata - in this case girls and boys.
Now consider a more complex case. Samples are to be taken a year apart to determine the rate at which the children are growing taller. The first sample consists of 50% boys and 50% girls. The second sample, a year later, has about 25% boys and 75% girls. The first sample is unbiased, the second is biased low. The resulting trend may erroneously suggest that the children are growing shorter!
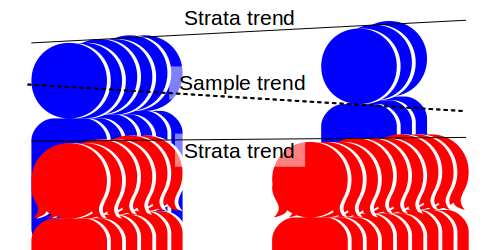
Note that there are two problems in estimating the trend: Firstly we are undersampling the faster growing strata, and secondly the proportion of the data coming from the taller group is declining. Both add a downward bias to the estimated trend.
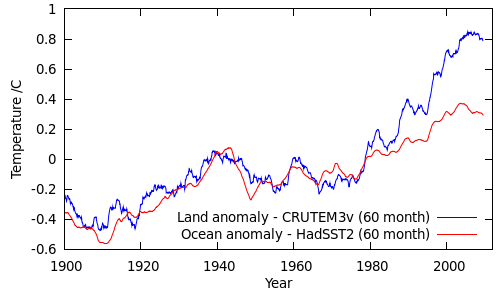
Land surface temperatures have been increasing more quickly than sea surface temperatures, as would be expected given the higher heat capacity of water. The following figure shows the area-average temperature anomalies from CRUTEM3 and HadSST2:
(Alternatively, look at this figure from GISTEMP.)
Land coverage in the HadCRUT3v record has been declining over the past 50 years. The following figure shows the proportion of the HadCRUT3v global sample drawn from land measurements. The actual proportion of the Earth's surface covered by land is about 29%.
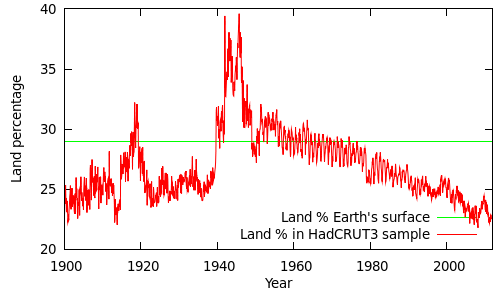
(The spikes during the world wars are due to poor SST - sea surface temperature - coverage during these periods. You can get a reasonable estimate of this graph based on the coverage values given on alternative lines of the CRUTEM3 and HadSST2 data files, however the values themselves are slightly peculiar: The land and ocean coverage exceed the fractions of the surface covered by land and ocean, and in some cases add up to more than 100%. This is due to the coarse 5 degree grid, and the fact that coastal cells are treated as both 100% land and 100% ocean. The figure above is a more accurate estimate based on the gridded datasets and a high-resolution land mask.)
The proportion of land readings in the HadCRUT3v sample has been dropping since the 1960s, and has dropped from ~25% to less than 23% since 1995. Over the same period the land temperature anomalies have been increasing faster than the sea surface temperature anomalies, with the greatest differences occurring since 2000.
What does this mean for the temperature record?
The temperature estimated from the unrepresentative sample will be an average of the temperatures from the land strata and the ocean strata (Tland and Tocean), weighted by the proportion of the Earth's surface covered by data from each strata (Pland and Pocean):
Tbiased = Pland Tland + Pocean Tocean
However, this is a biased estimate: Not only is it subject to normal sampling errors, it is biased by the fact that the proportions of land and ocean data in the sample are different from the proportions in the real data. An unbiased estimate would use the true land and ocean proportions:
Tunbiased = 0.29 Tland + 0.71 Tocean
where 0.29 and 0.71 are the actual global land and ocean fractions.
We can calculate the bias from the difference between the biased and unbiased estimates:
Δbias = Tbiased - Tunbiased = Tland (Pland - 0.29) + Tocean (Pocean - 0.71)
= (Tland - Tocean) x (Pland - 0.29)
The bias in the HadCRUT3v data due to the unrepresentative land/ocean sampling can be calculated by this equation, and is shown in the following figure (as a 60 month moving average):
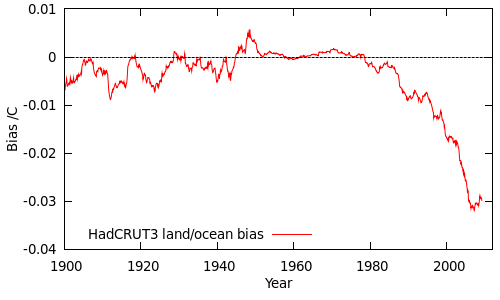
Until 1980 the bias is small, because the land and ocean temperatures do not differ significantly. After 1980, the difference between the land and ocean temperatures becomes significant, and at the same time the sampling of the land and ocean strata becomes increasing unrepresentative, amplifying the bias. (This is analogous to boys growing faster than girls at the same time as the proportion of boys in the sample is dropping.)
What impact does this have on the temperature trends? If HadCRUT3v is biased over recent years, it looks as though it is biased low. However before drawing a firm conclusion we need to look for other sources of bias; this will be subject of the next post in the series.
Note: While we can estimate the bias by careful statistics, the ideal solution to poor sampling is the one that Hadley and CRU have adopted - improve the data coverage. That of course involves a lot more work.
Acknowledgements
Thanks to Tom Curtis both for helping with this article, and for suggestions which inspired the original analysis.
Posted by Kevin C on Wednesday, 28 March, 2012
 |
The Skeptical Science website by Skeptical Science is licensed under a Creative Commons Attribution 3.0 Unported License. |