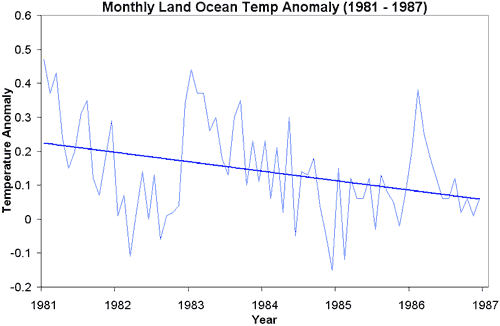
Figure 1: Land-ocean temperature anomaly (NASA GISS) 1981 to 1987.
The modern global warming trend began around 1975 and has shown a long term warming trend of 0.18°C per decade since. That's not to say the warming trend has been monotonically constant with each year slightly warmer than the previous. Short term weather fluctuations cause a noisy signal. Large volcanic eruptions lead to dramatic cooling over several years. El Nino/La Nina has a cycle of warming and cooling lasting 4 to 5 years. To demonstrate climate's variability, let's examine a 6 year record early in the global warming period.

Figure 1: Land-ocean temperature anomaly (NASA GISS) 1981 to 1987.
You're on shaky statistical ground asserting a climate trend over short periods. Both Stoat and Atmoz demonstrate the insignificance of 5 year trends. Nevertheless, I'm going to risk a slap on the wrist from Tamino by adding an ordinary least squares fit. The trend line indicates a distinct cooling of 0.27°C cooling per decade! If the blogosphere has been as active in 1987 as it is now, "global warming stopped in 1981" would be a certain front runner on the skeptic leaderboard.
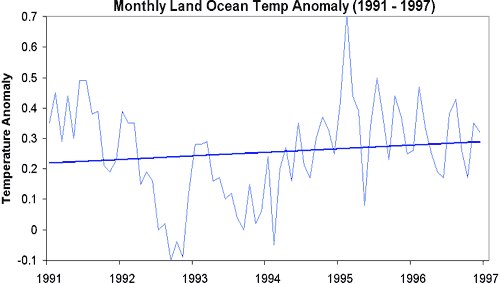
Let's jump ahead a few years. Here's another 6 year period starting in 1991. From 1991 to 1997, the long term warming trend of 0.18°C per decade slowed to 0.12°C per decade.

Figure 2: Land-ocean temperature anomaly 1991 to 1997.
However, it's worth noting Mount Pinatubo erupted in 1991, causing global temperatures to drop over 0.4°C. If you remove the volcano induced dip from 1992 to 1994, the overall trend from 1991 to 1997 is an actual cooling of 0.08°C per decade.
Now fast forward to the most recent decade. When someone argues global warming stopped in 1998, they lose credibility. 1998 was unusually warm due to a strong El Nino (one of those short term weather fluctuations mentioned above) so it's not surprising that the subsequent years were cooler. Climate change is about discerning trends, not comparing single anomalous years. But what if you plotted a linear trend since 2002?

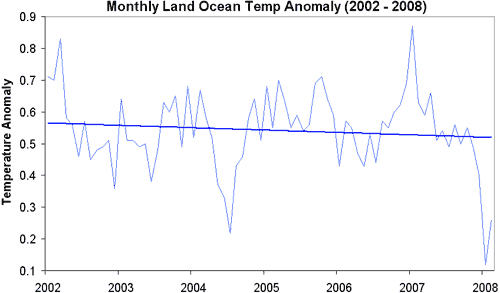
Figure 3: Land-ocean temperature anomaly 2002 to 2008.
From 2002 to 2008 (including the La Nina cooled early months of 2008), we observe a cooling trend of 0.08°C per decade. So we see it's not uncommon to observe brief periods where global warming slows or even temporarily reverses amidst long term warming. The trend over the last 6 years is not unprecedented. But could it be the beginning of the reversal of the long term trend?
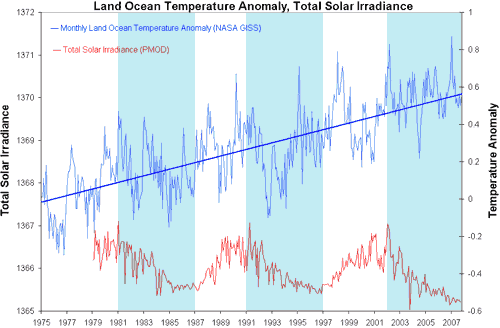
To answer that, you need to go beyond statistical analysis and look at some of the physical processes involved. The three time periods discussed above all have something in common, highlighted below in light blue:

Figure 4: Land-ocean temperature anomaly 1975 to 2008 (blue with trend line), Total Solar Irradiance 1978 to 2008 (red). Light blue area indicate periods when solar irradiance is falling due to the 11 year solar cycle.
The sun displays an 11 year cycle of rising and falling solar activity (the red line in Figure 4). Figures 1 through 3 are all periods where solar activity is falling. Camp 2007 found a statistically significant signal of 0.18°C in global temperature attributable to the 11 year solar cycle. In other words, as the sun moved from solar maximum in 2002 to solar minimum in 2008, falling solar activity lowered global temperatures by around 0.18°C. This is a greater rate than the long term global warming trend!
What are the consequences? The current "plateau" of global temperature is not only not unusual but is expected. Global warming hasn't reversed. Rather, this is a brief respite before solar activity begins rising in Solar Cycle 24. When this happens, in the words of Tung and Camp 2007, solar forcing will double the amount of global warming expected from greenhouse warming alone.
UPDATE April 1 2008: Scratching around for other studies on the solar signal in global temperatures, I find Douglass 2004. He calculates that due to the 1W/m2 change in TSI, you would theoretically expect a change in global temperature of 0.05°C. Instead, he observes a change of 0.1°C (using data from 1978) - he attributes the difference to positive feedback. White 1997 finds sea surface temperatures change by 0.1°C due to the 11 year solar cycle, looking at data from 1955 to 1994. Scafetta 2005 finds the 11 year solar cycle causes a change of 0.11°C in global temperatures going back to 1860. So it may be Camp 2007 overestimates the solar signal in global temperatures and the drop in solar activity from 2002 to 2008 led to around 0.1°C cooling. This equates to a cooling trend of 0.167°C per decade - roughly equivalent to the long term warming trend.
Posted by John Cook on Monday, 31 March, 2008
 |
The Skeptical Science website by Skeptical Science is licensed under a Creative Commons Attribution 3.0 Unported License. |