Guest post by Alden Griffith from Fool Me Once
My previous post, “Has Global Warming Stopped?”, was followed by several (well-meaning) comments on the meaning of statistical significance and confidence. Specifically, there was concern about the way that I stated that we have 92% confidence that the HadCRU temperature trend from 1995 to 2009 is positive. The technical statistical interpretation of the 92% confidence interval is this: "if we could resample temperatures independently over and over, we would expect the confidence intervals to contain the true slope 92% of the time." Obviously, this is awkward to understand without a background in statistics, so I used a simpler phrasing. Please note that this does not change the conclusions of my previous post at all. However, in hindsight I see that this attempt at simplification led to some confusion about statistical significance, which I will try to clear up now.
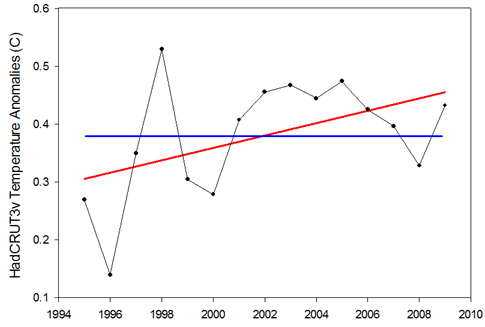
So let’s think about the temperature data from 1995 to 2009 and what the statistical test associated with the linear regression really does (it's best to have already read my previous post). The procedure first fits a line through the data (the “linear model”) such that the deviations of the points from this line are minimized, i.e. the good old line of best fit. This line has two parameters that can be estimated, an intercept and a slope. The slope of the line is really what matters for our purposes here: does temperature vary with time in some manner (in this case the best fit is positive), or is there actually no relationship (i.e. the slope is zero)?

Figure 1: Example of the null hypothesis (blue) and the alternative hypothesis (red) for the 1995-2009 temperature trend.
Looking at Figure 1, we have two hypotheses regarding the relationship between temperature and time: 1) there is no relationship and the slope is zero (blue line), or 2) there is a relationship and the slope is not zero (red line). The first is known as the “null hypothesis” and the second is known as the “alternative hypothesis”. Classical statistics starts with the null hypothesis as being true and works from there. Based on the data, should we accept that the null hypothesis is indeed true or should we reject it in favor of the alternative hypothesis?
Thus the statistical test asks: what is the probability of observing the temperature data that we did, given that the null hypothesis is true?
In the case of the HadCRU temperatures from 1995 to 2009, the statistical test reveals a probability of 7.6%. Thus there’s a 7.6% probability that we should have observed the temperatures that we did if temperatures are not actually rising. Confusing, I know… This is why I had inverted 7.6% to 92.4% to make it fit more in line with Phil Jones’ use of “95% significance level”.
Essentially, the lower the probability, the more we are compelled to reject the null hypothesis (no temperature trend) in favor of the alternative hypothesis (yes temperature trend). By convention, “statistical significance” is usually set at 5% (I had inverted this to 95% in my post). Anything below is considered significant while anything above is considered nonsignificant. The problem that I was trying to point out is that this is not a magic number, and that it would be foolish to strongly conclude anything when the test yields a relatively low, but “nonsignificant” probability of 7.6%. And more importantly, that looking at the statistical significance of 15 years of temperature data is not the appropriate way to examine whether global warming has stopped (cyclical factors like El Niño are likely to dominate over this short time period).
Ok, so where do we go from here, and how do we take the “7.6% probability of observing the temperatures that we did if temperatures are not actually rising” and convert it into something that can be more readily understood? You might first think that perhaps we have the whole thing backwards and that really we should be asking: “what is the probability that the hypothesis is true given the data that we observed?” and not the other way around. Enter the Bayesians!
Bayesian statistics is a fundamentally different approach that certainly has one thing going for it: it’s not completely backwards from the way most people think! (There are many other touted benefits that Bayesians will gladly put forth as well.) When using Bayesian statistics to examine the slope of the 1995-2009 temperature trend line, we can actually get a more-or-less straightforward probability that the slope is positive. That probability? 92%1. So after all this, I believe that one can conclude (based on this analysis) that there is a 92% probability that the temperature trend for the last 15 years is positive.
While this whole discussion comes from one specific issue involving one specific dataset, I believe that it really stems from the larger issue of how to effectively communicate science to the public. Can we get around our jargon? Should we embrace it? Should we avoid it when it doesn’t matter? All thoughts are welcome…
1To be specific, 92% is the largest credible interval that does not contain zero. For those of you with a statistical background, we’re conservatively assuming a non-informative prior.
Posted by Alden Griffith on Wednesday, 11 August, 2010
 |
The Skeptical Science website by Skeptical Science is licensed under a Creative Commons Attribution 3.0 Unported License. |