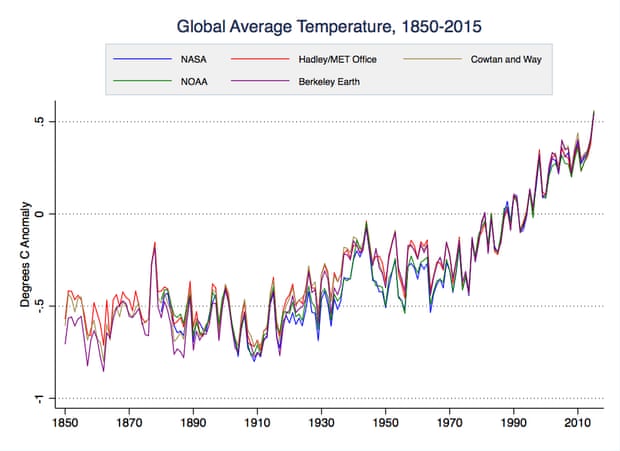
2015 smashed the record for hottest year by about 0.14°C. To put that into perspective, the previous two hottest years (2014 and 2010) only broke the prior records by 0.002°C, according to Berkeley Earth data. The only time the temperature record was shattered by such a large margin was in the monster El Niño year of 1998.
Various global surface temperature datasets, 1850–2015. Illustration: Zeke Hausfather
While the current El Niño event is also becoming monstrously strong, it’s only now reaching its peak intensity, and there’s an approximately 4-month lag before changes in El Niño are reflected in global surface temperature changes. Thus, the El Niño of 1998 had a greater warming influence than its 2015 counterpart. 2015 was nevertheless more than 0.2°C hotter than 1998, due to human-caused global warming.
As the animated graphic below shows, there’s a consistent warming trend among El Niño years, La Niña years, and neutral years. Over the past 50 years, there’s a 0.16°C per decade trend among each category, and individual years fall close to those trend lines. That underlying human-caused global warming trend is what’s causing annual temperatures to so frequently break records, with 4 new record-hot years in the past decade.
Berkeley Earth average global surface temperatures since 1965 categorized by type of El Niño year. Illustration: Dana Nuccitelli
As NASA GISS director Gavin Schmidt said,
The El Niño that we’re seeing is starting at the end of 2015, and so there hasn’t been enough time for that to really have an impact on the annual mean temperatures. So 2015 was warm even though there was an El Niño, and it would’ve been a record year even if you abstract out the El Niño affect, 2015 would’ve been a record warm year by a long chalk.
And due to the aforementioned lag, 2016 could be even hotter yet. Prof Adam Scaife, head of long-range forecasting at the Met Office, said in an interview with Carbon Brief,
Given the strength of the current El Niño, we expect 2016 to be even warmer globally than 2015. The lagged effects of El Niño are already starting to appear in the monthly temperature observations, which are registering more than 0.8 degrees above norm in recent months. This is consistent with our forecast for unprecedented warmth in the coming year. Overall, we expect El Niño to contribute around 25% to what will most likely be a new record global temperature in 2016. Much of the rest is down to climate change.
If 2016 breaks the temperature record yet again, it will be the first time in the past 150+ years that three consecutive years set a new annual global temperature record.
Contrarians have responded to the news of record-shattering 2015 temperatures by noting that in the satellite data, it was only the third-hottest year on record in the lower atmosphere. There are two main reasons for this. First, atmospheric temperatures are more sensitive to changes in El Niño than surface temperatures. As a result, satellites still have 1998 as the hottest year on record, 0.14°C hotter than the second-hottest year of 2010, even though surface temperatures were about 0.07°C hotter in 2010 than 1998, and more than 0.2°C hotter in 2015.
Second, there’s an even bigger lag between changes in El Niño and changes in atmospheric temperatures, where it’s about 6–7 months. Thus the peak temperature influence of the current monster El Niño won’t be reflected in the satellite temperature record until summer 2016. As a result, 2016 is likely to become the hottest year in the satellite record.
However, the surface temperature data are more relevant to humans because they reflect temperatures where we live, and are less uncertain and more reliable than indirect satellite temperature estimates.
Over 90% of the energy trapped by the increased greenhouse effect goes into warming he oceans. A recent paper led by Peter Gleckler at Lawrence Livermore National Laboratory estimated that the oceans have been building up heat at a rate equivalent to 4 Hiroshima atomic bomb detonations per second since 1998. That’s over 2.3 billion atomic bomb detonations worth of heat building up in the oceans over the past 17 years.
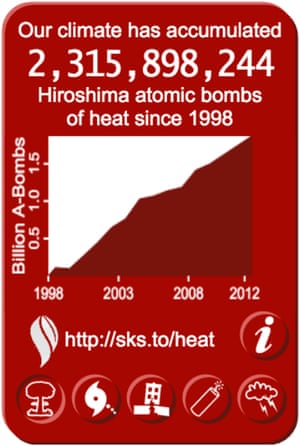
Widget counting global heat accumulation, up to 2.3 billion atomic bomb detonations since 1998. Illustration: 4hiroshimas.com
During that time, the oceans accumulated as much heat as they did during the previous 130 years, with 2015 reaching record levels.
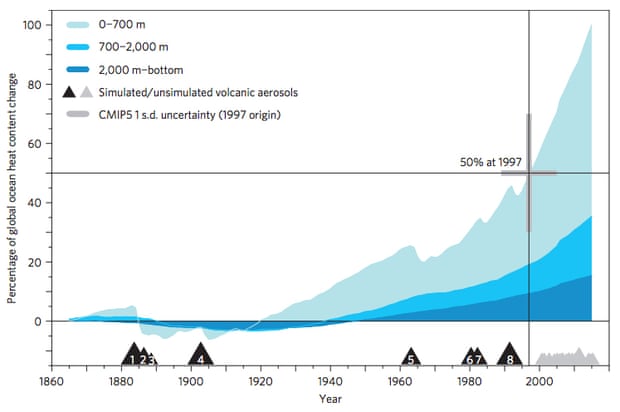
Ocean heat uptake as a percentage of 1865-2015 change for CMIP5 model average. Large grey cross indicates that 50% of the total uptake occurred in 1997. Source: Gleckler et al. (2016). Illustration: Nature Climate Change
In fact, research by Kevin Trenberth and colleagues suggests even this is an underestimate, and that from 1992 to 2005 the oceans built up heat at a rate of 6 atomic bomb detonations per second. Trenberth believes many other studies have underestimated the rate at which the southern hemisphere oceans are warming.
Previous estimates of ocean heat content change have been too conservative in the changes in the southern hemisphere. The absence of data does not mean absence of warming. Several estimates then use zero change in those regions. By better assessing what changes are likely in the no-data regions, based upon the regions where there are data, the ocean heat content changes increase.
Encouragingly, on average, climate models are nailing the increase in ocean heat content quite accurately.
As the above ocean heat content chart shows, the overall heating of the planet never paused or even slowed down. The warming of surface temperatures did briefly slow, due to a period with more La Niña than El Niño events since the turn of the century. However, with the apparent return of more El Niño events, global surface temperatures are surging, and it’s hard to even see the slowdown anymore.
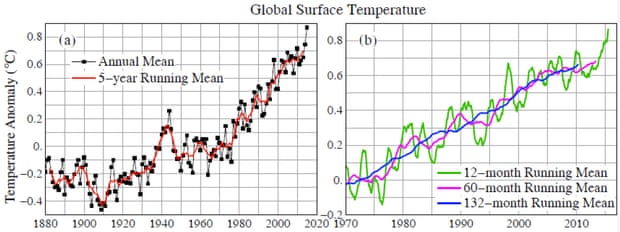
NASA GISS global surface temperatures. Right frame shows smoothing over various time periods. Illustration: James Hansen.
This argument is now relegated to the satellite temperature data, which have greater uncertainty, are more influenced by El Niño events, and diverge from direct weather balloon atmospheric temperature measurements.
For the global climate as a whole, there wasn’t even a warming slowdown (in fact it’s accelerated, as the Gleckler paper shows), and surface warming only temporarily slowed and is now speeding up again.
As Trenberth wrote, the record heat that we’re seeing now will soon become the norm.
Posted by dana1981 on Monday, 25 January, 2016
 |
The Skeptical Science website by Skeptical Science is licensed under a Creative Commons Attribution 3.0 Unported License. |