 Arguments
 Software
 Resources
Comments
 The Consensus Project
 Translations
 About
Support


Latest Posts
- 2026 SkS Weekly Climate Change & Global Warming News Roundup #06
- Skeptical Science New Research for Week #6 2026
- The future of NCAR remains highly uncertain
- Fact brief - Can solar projects improve biodiversity?
- How the polar vortex and warm ocean intensified a major US winter storm
- 2026 SkS Weekly Climate Change & Global Warming News Roundup #05
- Help needed to get translations prepared for our website relaunch!
- Skeptical Science New Research for Week #5 2026
- Climate Variability Emerges as Both Risk and Opportunity for the Global Energy Transition
- Fact brief - Are solar projects hurting farmers and rural communities?
- Winter 2025-26 (finally) hits the U.S. with a vengeance
- 2026 SkS Weekly Climate Change & Global Warming News Roundup #04
- Skeptical Science New Research for Week #4 2026
- WMO confirms 2025 was one of warmest years on record
- Fact brief - Do solar panels release more emissions than burning fossil fuels?
- Keep it in the ground?
- 2026 SkS Weekly Climate Change & Global Warming News Roundup #03
- Skeptical Science New Research for Week #3 2026
- Climate Adam - Will 2026 Be The Hottest Year Ever Recorded?
- Fact brief - Does clearing trees for solar panels release more CO2 than the solar panels would prevent?
- Where things stand on climate change in 2026
- 2026 SkS Weekly Climate Change & Global Warming News Roundup #02
- Skeptical Science New Research for Week #2 2026
- UK renewables enjoy record year in 2025 – but gas power still rises
- Six climate stories that inspired us in 2025
- How to steer EVs towards the road of ‘mass adoption’
- 2026 SkS Weekly Climate Change & Global Warming News Roundup #01
- Skeptical Science New Research for Week #1 2026
- 2025 in review - busy in the boiler room
- Direct Air Capture
ENSO Temperature Trends

For a video version of this graphic updated through 2019, click here
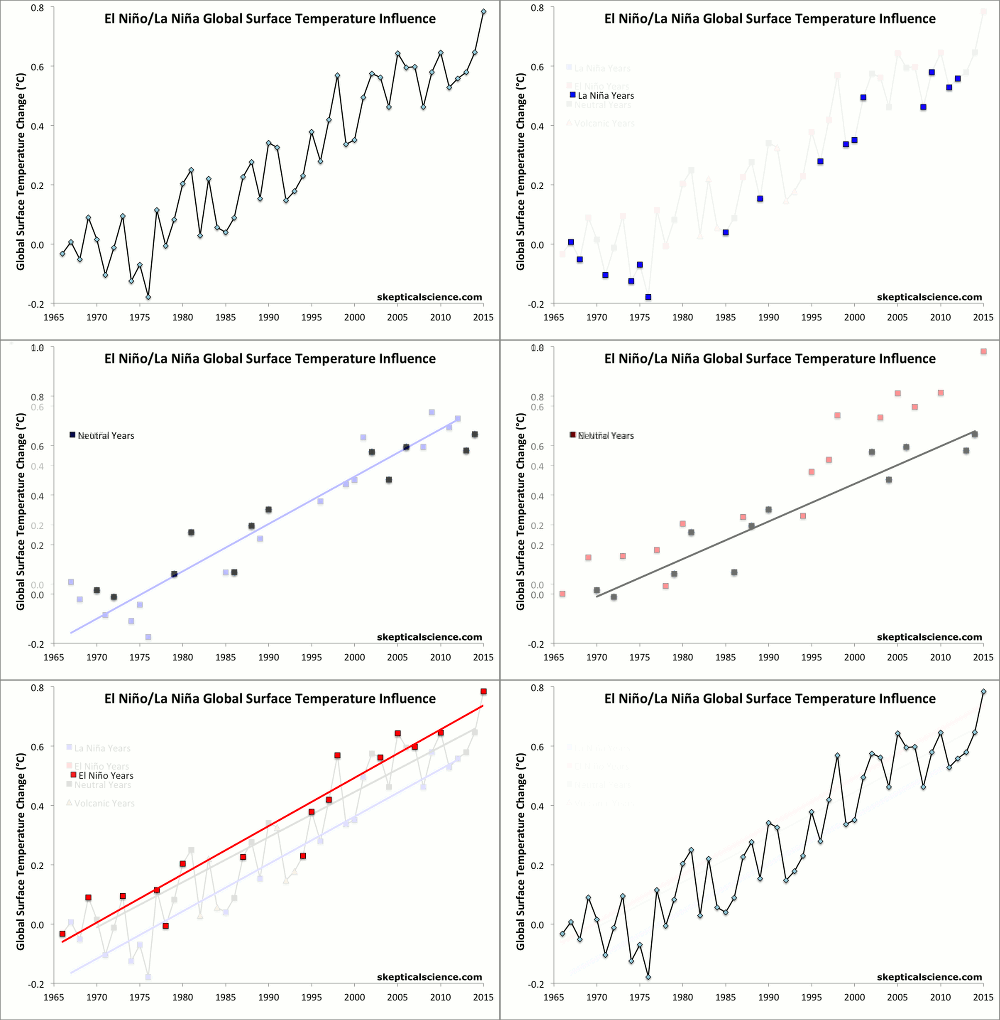
Berkeley Earth estimates of the change in average annual global surface air temperature (1966–2015) show that much of the short-term variability in the upward temperature trend is produced by the El Niño/La Niña Southern Oscillation (ENSO), a 2–7 year climate pattern in the tropical Pacific. Average air temperature is affected by many different factors, including: anthropogenic (human-caused) global warming (AGW) that is mainly caused by CO2 emissions from burning fossil fuels; the 11-year solar sunspot cycle; sulfate aerosols from volcanic eruptions; and the periodic ENSO.
In this analysis, each year was classified as either an El Niño, La Niña, or ENSO-neutral year based on the average of 3 common ENSO indices. The years were then ranked and the top, middle, and bottom approximately one-third of the ranked years were classified as El Niño, neutral, and La Niña years, as described here. Years that were strongly influenced by the volcanic eruptions of El Chichón (1983–1985) and Mount Pinatubo (1992–1994) were excluded from the analysis due to the temporary cooling effect of volcanic aerosols.
First Frame: Berkeley Earth global surface temperature data show a clear increasing trend, but it is "noisy" because multiple influences are present in the data (AGW, ENSO, volcanoes, solar cycle).
Middle Frames: Each year is classified according to its ENSO index as either an El Niño year (red), La Niña year (blue), ENSO-neutral year (black), excluding volcanic years (orange triangles). Each category of year is shown with its linear temperature trend.
Final Frame: Linear trends are calculated for each category, with the result that after accounting for the variability attributed to ENSO (and removing the effect of volcanic eruptions), each category shows essentially the same underlying global warming trend of 0.15–0.17°C per decade. Short-term cyclical factors like ENSO and the solar cycle average to about zero net effect over time, and volcanic influences are temporary.
Climate contrarians sometimes claim that global warming has somehow magically stopped in recent years based on their "cherry picking" short time periods of reduced temperature increase. However, in reality there was a preponderance of El Niño events in the 1990s and a preponderance of La Niña events since 2000, where the former cause short-term surface warming and the latter cause short-term cooling. Accounting for the El Niño/La Niña influence clarifies that human-caused global warming continues unabated.
SkS Resources that use this Graphic
- Did Global Warming Stop in 1998, 1995, 2002, 2007, 2010? (intermediate)
- Was 2012 the Hottest La Niña Year on Record?
- John Nielsen-Gammon Comments on Continued Global Warming
- Watts Interview – Denial and Reality Mix like Oil and Water
- Distinguishing Between Short-Term Variability and Long-Term Trends
- Another Piece of the Global Warming Puzzle - More Efficient Ocean Heat Uptake
- 2013 was the second-hottest year on record without an El Niño
- Mercury Rising: 2014 Sees Warmest May Ever Recorded Following on From 2nd Warmest April
- Climate models accurately predicted global warming when reflecting natural ocean cycles
- Global warming made 2014 a record hot year – in animated graphics
- 2015 shatters the temperature record as global warming speeds back up
Images
Printable Version | Back to Graphics by Skeptical Science
|
|
Skeptical Science Graphics by Skeptical Science is licensed under a Creative Commons Attribution 4.0 International License. |
THE ESCALATOR

(free to republish)


