It's October and as in previous years, Andy Lee Robinson spent a lot of time and computer power (more about that below) to update his haunting and mesmerizing visualization of the startling decline of Arctic Sea Ice, showing the minimum volume reached every September since 1979.
Average Arctic sea ice volume in September 2020 was 4,162 km3. This value is not even 400 km3 above the record minimum value of 3,673 km3 set in 2012. This makes 2020 the second lowest on record for September.
The rate of loss is staggering. In just 40 years the volume of Summer Arctic sea ice has declined by about 80%. At this rate, it is expected that the Arctic ocean will become ice-free for an increasingly large part of the year beginning sometime in the 2030s. What may normally take tens of thousands of years to happen in geologic timescales has happened within half a human lifespan, and continuing.
About the data: Sea Ice Volume is calculated using the Pan-Arctic Ice Ocean Modeling and Assimilation System (PIOMAS, Zhang and Rothrock, 2003) developed at APL/PSC. Source data for this graph is available from the Polar Science website.
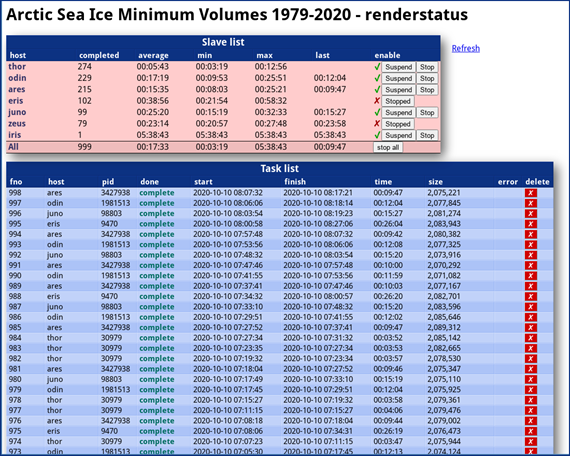
Andy shared some technical tidbits about creating these visualizations every year. The animation contains more than 1000 individual 1920x1080 sized images each of which takes 4 minutes to 4 hours to render. In addition to creating the graphs, Andy also wrote the software to make them, and to distribute rendering tasks to remote servers and collect results. If he had only one computer available, to make the animation, it would take a few weeks to finish! Andy is using Perl which he has has known since 1994 and which allows him to make it parameterizable. He can run it every year using just one command in an SSH terminal, and then wait... and wait...

Each participating server runs Andy's perl program which iterates through each frame one-by-one. However, in order to avoid duplicating work, a mysql database keeps track of rendering jobs in play. Each server checks this over an ssh tunnel for the next available frame, and reserves it so other servers will skip over it.
The program then calculates positions, dimensions, accelerations and other parameters for the objects in each frame based on the raw data, templates and keyframe interpolation data and then creates a scene definition file that includes these objects for the povray raytracer to interpret and render a PNG file. This is then uploaded to a web server and the database updated with the details.
A small PHP web page interacts with the database to display status and statistic and to pause or delete jobs. When all the frames have completed over the next few days, they are assembled using ffmpeg into an mp4 video, mixed with the sound track and ready for upload.
To top it off, Andy not "just" programmed all of this, he also composed and played the hauntingly beautiful piano music, "Ice Dreams" to go along with the video. You can listen to and watch him play his music in this video:
How about making all of this worth Andy's time and effort by first liking and then sharing his video far and wide? It sure deserves to be seen by as many people as possible if you ask me!
Posted by BaerbelW on Tuesday, 27 October, 2020
 |
The Skeptical Science website by Skeptical Science is licensed under a Creative Commons Attribution 3.0 Unported License. |