


 Arguments


Arctic Sea Ice Minimum Volumes Video - 2020 edition
Posted on 27 October 2020 by BaerbelW
It's October and as in previous years, Andy Lee Robinson spent a lot of time and computer power (more about that below) to update his haunting and mesmerizing visualization of the startling decline of Arctic Sea Ice, showing the minimum volume reached every September since 1979.
Average Arctic sea ice volume in September 2020 was 4,162 km3. This value is not even 400 km3 above the record minimum value of 3,673 km3 set in 2012. This makes 2020 the second lowest on record for September.
The rate of loss is staggering. In just 40 years the volume of Summer Arctic sea ice has declined by about 80%. At this rate, it is expected that the Arctic ocean will become ice-free for an increasingly large part of the year beginning sometime in the 2030s. What may normally take tens of thousands of years to happen in geologic timescales has happened within half a human lifespan, and continuing.
About the data: Sea Ice Volume is calculated using the Pan-Arctic Ice Ocean Modeling and Assimilation System (PIOMAS, Zhang and Rothrock, 2003) developed at APL/PSC. Source data for this graph is available from the Polar Science website.
The Making of
Andy shared some technical tidbits about creating these visualizations every year. The animation contains more than 1000 individual 1920x1080 sized images each of which takes 4 minutes to 4 hours to render. In addition to creating the graphs, Andy also wrote the software to make them, and to distribute rendering tasks to remote servers and collect results. If he had only one computer available, to make the animation, it would take a few weeks to finish! Andy is using Perl which he has has known since 1994 and which allows him to make it parameterizable. He can run it every year using just one command in an SSH terminal, and then wait... and wait...
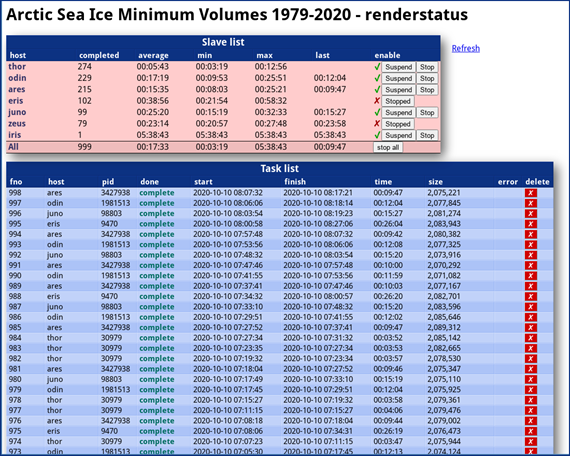
Each participating server runs Andy's perl program which iterates through each frame one-by-one. However, in order to avoid duplicating work, a mysql database keeps track of rendering jobs in play. Each server checks this over an ssh tunnel for the next available frame, and reserves it so other servers will skip over it.
The program then calculates positions, dimensions, accelerations and other parameters for the objects in each frame based on the raw data, templates and keyframe interpolation data and then creates a scene definition file that includes these objects for the povray raytracer to interpret and render a PNG file. This is then uploaded to a web server and the database updated with the details.
A small PHP web page interacts with the database to display status and statistic and to pause or delete jobs. When all the frames have completed over the next few days, they are assembled using ffmpeg into an mp4 video, mixed with the sound track and ready for upload.
To top it off, Andy not "just" programmed all of this, he also composed and played the hauntingly beautiful piano music, "Ice Dreams" to go along with the video. You can listen to and watch him play his music in this video:
How about making all of this worth Andy's time and effort by first liking and then sharing his video far and wide? It sure deserves to be seen by as many people as possible if you ask me!


Presenting the reduction of Mimimum Volume since 1979 is a great way to show how dramatic the decline is. Presenting the Minimum volume captures the issue of reduction of multi-year ice.
But the amazing graphic image presentation of the minimum volume misses one very disturbing thing that the graph on the PIOMAS website shows. The Maximum volumes since the winter of 2008-09 have clearly been lower than any of the Minimum volumes before summer 2007.
Am I missing something on this? If you extend that line out there would be zero summer ice in about twelve years. As near as I can tell from a quick search, the arctic ice is assumed to be the major driver of the ocean conveyor belt (which is already slowing down). It would seem then that in twelve years or probably less would be global catastrophic climate change. If so why is this not talked about?
PS: Just to be clear, I meant why is this not talked about in the media, not in the above presentation.
Wilt:
Forecasting the "end of ice" is not that simple, and a linear extrapolation is probably not realistic. And although reaching that summer ice-free point will be major, I'd hesitate to call it "catastrophic".
What is your definition of "catastrophic"?
Wilt @2&3,
While we should not be surprised by the appearance of sub-million sq km Arctic Sea Ice minimums (=ice-free) starting sometime in the 2030s (& there has been a fair old kerfuffle with folk suggesting it could be sooner), the usual concern of ice melt and the AMOC is the melt run-off from Greenland which has increased by perhaps 30% in recent decades. (Note this is the increase in gross run-off. The net ice loss (run-off minus snowfall are the more dramatic values we usually see.)
The increased Greenland melt very roughly results in an extra 300Gt of cold fresh water discharged into the oceans which is a tiny change when compared to the 15,000Gt of cold fresh water resulting from the annual melt of the northern sea ice, a level of annual melt that has remained unchanged over the last 40 years. And the arrival of an ice-free summer minimums Arctic Ocean won't immediately change that 15,000Gt melt cycle, not until the arrival of an ice-free Arctic Ocean in the early summer and through to the autumn.
While the AMOC is driven in the most fundamental way by the freezing polar temperatures, its sensitivity to changes in salinity and these cold fresh water inflows is quite local and the Greenland discharge into Labrador & Nordic Seas is the very point of sensitivity.
Thanks for the thoughtful responses my catastrophic thinking. 2 things are still stuck in my brain though.
I recall it pointed out somewhere that at some point on the progression to zero summer ice it is likely to reach the point of a reduced enough ice cover to quickly and dramatically raise arctic temperatures by exposing enough uncovered ocean to sunlight which absorbs 10 times the heat of ice thus rapidly melting much more ice until the sun gets far enough south to let it grow again. That would probably begin a viscous cycle of rapidly increasing ice free periods, and probably start well before the zero September ice that the current progression indicates would be at a maximum of 12 years from now.
#2 A small enough amount of summer ice would likely stop amoc as the large variability displayed in the following chart seems to indicate is very possible; "Full array OSNAP east OSNAP west" chart, (the chart is about 3/4 of the way down this page): https://www.carbonbrief.org/major-study-uncovers-sea-change-in-worlds-understanding-of-atlantic-conveyor-belt.
Perhaps a complete ice free bit in the summer and its resultant halt of the primary driver of amoc would not disrupt amoc significantly or permanently, but it would seem likely that as the ice free periods extended it would.
So it would seem likely that in twelve years give or take we could be seeing a collapse of amoc and the resultant (by everyones descriptions of what a halted amoc would cause) catastrophe.
Wilt:
Regarding your first point, keep i mind that large bodies of water in the Northern hemisphere, such as Hudson's Bay and the Great Lakes, already go through seasonal cycles from ice-free to substatially ice-covered. Even an "ice-free" Arctic Ocean will have a lot of ice for a lot of the year.
https://www.glerl.noaa.gov/data/ice/#historical
Yes, penetration of solar radiation into open water is a primary mechanism of feedback for additional warming. Maximum solar radaiation is on June 21, though - not in September when the ice minimum will (most likely continue to) occur.
As for point #2: RealCimate has freqently dicussed the Atlantic Meridional Overturning Circulation (AMOC) and it's potential climate effects. A search there for AMOC turns up several posts over the years. The most recent one is:
http://www.realclimate.org/index.php/archives/2020/09/new-studies-confirm-weakening-of-the-gulf-stream-circulation-amoc/
Andy Lee Robinson published the 2024 version of his animation on October 25, 2024:
https://youtu.be/NphVG576grU?si=F_xF0mfjjrd_5o6l
Andy explains in the video description how much effort is involved to render the video:
"I produced the animation using hand-written Perl and PHP code to create PovRay scripts, and scheduling task distribution using MySQL between 8 Linux servers working in parallel to render 1018 frames at 3840 x 2180 resolution. Each frame took an average of about 45 minutes to render, so that is 763 hours or 4.5 weeks of CPU time, shared between the servers to complete in 5 days.
I also built a web interface to keep track of the rendering jobs, start, stop and redo frames for all the distributed servers. They would upload their results to a webserver after each frame, to make a total size of 7.6GB to then be combined with the piano track using ffmpeg into a high quality mp4 video for upload."