We occasionally receive excellent questions and/or comments by email or via our contact form and have then usually corresponded with the emailer directly. But, some of the questions and answers deserve a broader audience, so we decided to highlight some of them in a new series of blog posts.
Recently, an email asked about CO2 and the absorption of infrared (IR) radiation (specifically mentioning the 15 μm wavelength). The email mentioned the Beer-Lambert Law, and went on to ask how a gas can have any effect at low concentrations (400 ppm, or 0.04% of the atmosphere).
This post will attempt to explain what the Beer-Lambert Law tells us about the absorption of radiation, and explain why 400 ppm of CO2 can still be an important factor. We’ll look at some of the differences between visible light and IR radiation, and perform a small experiment to show that how we measure “concentration” is important.
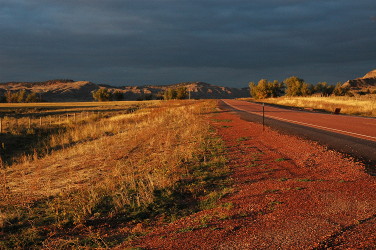
Figure 1. Lighting at sunset - atmospheric radiation transfer at work
It is well known that different wavelengths of light interact differently with the atmosphere. An example we are all familiar with is the difference in lighting between mid-day and twilight. At mid-day, we see a normal (to our human eyes) distribution of the spectrum of light - a balance between the various colours of the rainbow we all learn in school: red, orange, yellow, green blue, indigo, and violet. As the sun sets, the long path the light takes through the atmosphere means we see a colour distribution with much more red in it. To the delight of photographers worldwide, there is a special quality to the lighting that makes landscapes change their appearance (figure 1).
There is also a very strong difference between the way solar radiation (from the sun) and terrestrial radiation (emitted within the earth-atmosphere system) interact with the atmosphere. Solar radiation comes in the UV, visible and near-infrared portions of the spectrum, and terrestrial radiation is in the infrared. Figure 2 shows the theoretical Planck curves for radiation emitted from two sources – one at a temperature of 5800K (similar to the sun), and the other at 255K (typical of the earth-atmosphere system).
Each follows a curve, with a peak somewhere in the middle. Solar radiation is mostly in the visible range, between 0.4 and 0.7 μm, and nearly all the energy falls between about 0.2 and 2 μm. Terrestrial radiation peaks at just over 10 μm, and nearly all the energy falls in the range between 4 and 40 μm. We can see that the two ranges do not overlap in the portions of the spectrum where most radiation is emitted from each source.
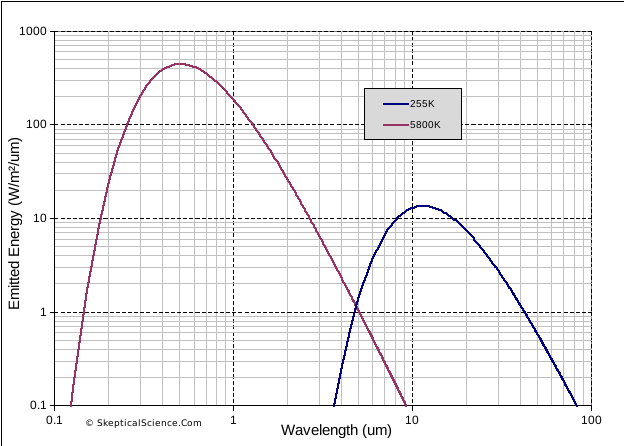
Figure 2. Theoretical emission curves (Planck curves) for sources at 5800K (solar) and 255K (terrestrial)
This difference between solar and terrestrial radiation wavelengths is a key aspect of the greenhouse effect. The atmosphere is mostly transparent to solar radiation wavelengths, so energy from the sun easily reaches (and heats) the surface. In contrast, the atmosphere readily absorbs IR radiation, so energy emitted from the surface is not easily transmitted through the atmosphere back to space. The effect of the atmosphere – reducing the efficiency of energy loss from the surface to space – is the essential characteristic of “the greenhouse effect”. Instead of surface temperatures being in the region of 255K (-18°C), our planet is a habitable average of about 288K (15°C). And if we add gases that absorb additional IR radiation, such as CO2, we will increase this heating effect (global warming).
So, what was it that our email writer was asking about? Well, the question had to do with the low levels of CO2, and how a gas that exists in such small quantities in the atmosphere (400 ppm = 0.04%) could possible have an influence on climate. The writer was aware of several important factors:
...but the writer speculated that it would take 100% CO2 to absorb all the 15 μm IR radiation, and that 0.04% CO2 would only absorb 0.04%. How could such a small concentration have any effect? The email writer has misunderstood some aspects of radiation absorption, and come to an incorrect conclusion.
To explain this, we need to look a little more closely at just what the Beer-Lambert Law tells us, and how this applies to the atmosphere. Wikipedia has a good article on the Beer-Lambert Law, but it doesn’t really tell us how to apply this to CO2 and climate.
The Wikipedia page’s first equation (yes, we need equations...) is:
A = εLc
where
(“Attenuation” is a fancy term for the combination of absorbing and scattering. More on that later.)
So, we can see here how the email writer is thinking in terms of “concentration”. The catch is, thinking of CO2 in terms of parts per million – comparing it to all the other gases in the atmosphere – is not the correct “concentration” that is needed. The equation multiplies three terms. Let’s look at the one at a time.
The first is the “attenuation coefficient”, ε. This is molar attenuation – where molar is a count of the number of molecules. (Since there are so many molecules involved, chemist usually talk in terms of moles, which is the number given by the Avogadro constant.) When expressing CO2 in “ppm”, we are talking about how much CO2 there is as a proportion of how much total gases are present. So, if we have a volume of air that contains 400 molecules of CO2 and 1 million molecules of air, we have 400 ppm of of CO2. But if that same volume of air contains 4,000 molecules of CO2 and 10 million molecules of air, we still have 400 ppm of CO2 even though there are ten times as many molecules present. To radiation passing through that volume of air, these two cases are not the same. It is the number of molecules that matter.
Figure 3 shows this. Although both sides of the diagram have 40 red symbols per 1000 symbols (or, 40 parts per thousand), the left diagram is packed with 1000 symbols in total, and the right diagram has only 100. Clearly, the left diagram represents a case where more absorbing will occur. Also, we should remember that different gases that absorb differently at different wavelengths. This means that they act more or less independently. In figure 3, the effect of the red symbols – 40 on the left side, or 4 on the right side – is not much affected by how many blue symbols there are. In fact, if you just took all the blue symbols out, we’d still have the same number of red symbols and they would have the about the same effect – even though the red symbols are now 100% of all the symbols. (There are additional details involved, but as a first approximation, this is the case.)
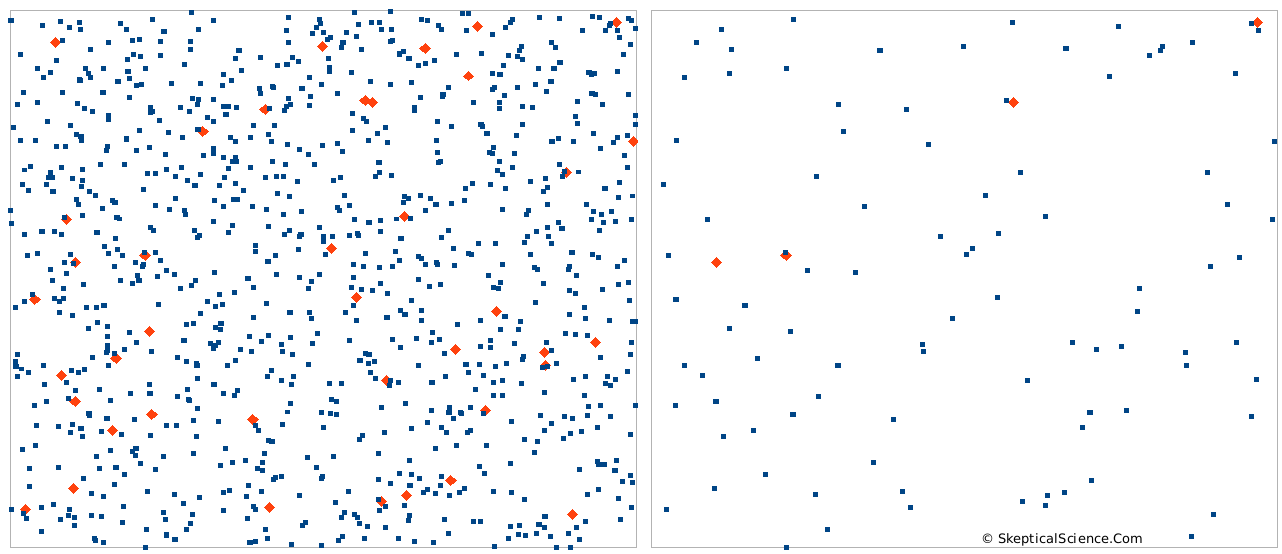
Figure 3. Two boxes, each with 40 parts per thousand (ppt) red symbols, but different absolute amounts.
So, to match the attenuation term, ε, the concentration that we need (the c term in our equation above) needs to be a count of the absolute number CO2 molecules in the volume of air – the molar concentration – not its ratio to the other gases.
If we apply the ideas from figure 3 to our atmosphere in a thought experiment, think of CO2 as the red symbols and N2 as the blue symbols. In the atmosphere, CO2 is 0.04%, and N2 is about 78%. N2 is transparent to IR radiation - it does essentially no absorbing. What would happen if we removed all the N2? CO2 would now be 0.18% of the atmosphere - but will it be absorbing almost 5x as much IR? No. There will be some minor changes related to the air pressure change, but the CO2 is present in the same number of molecules, and it will be doing basically the same absorbing. (Removing all the N2 would alter the overall greenhouse effect, because convetcton is important. Having 1/5 the mass in the atmosphere will affect convection - but that is another story for a different blog post.)
Back to our equation. The term in the middle, L, is the path length. We multiply the concentration by the path length. If concentration is in moles/m3, and we multiply by the length in metres, then Lc is in moles/m2. And then when we multiply by the attenuation coefficient (units are “per mole”), then we end up with units of “per m2”. Since we always talk of radiation in units of “per m2” (e.g. Watts/m2), this is exactly what we need - A = εLc will tell us the fraction of our radiation that is absorbed.
So, we can see here that we need concentration in the correct units, and we also need to think about how far through the atmosphere the radiation needs to travel – a longer path (at the same concentration per m3) means more absorption.
Now, let’s try to think how this all works in the atmosphere. Figure 4 shows this visually. In the top part of the diagram we see a cylinder that represents a small portion of the atmosphere. Radiation (photons) coming in from the upper left can do three things:
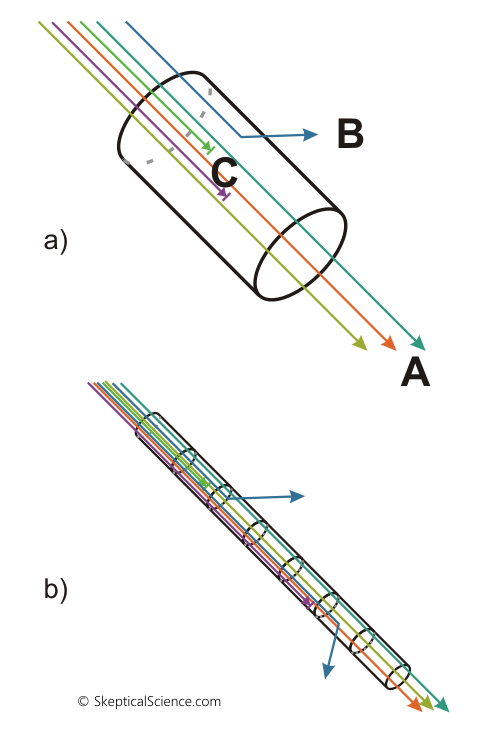
Figure 4 – Diagrammatic view of atmospheric transmission (Beer-Lambert law). Top: a single "unit" of air. A = transmitted, B = scattered, C = absorbed. Bottom: a chain of multiple units of air.
We haven’t said much about scattering yet. In the atmosphere, scattering can be caused two ways: Rayleigh scattering, or Mie scattering. Both depend on the size of the particles in relation to the wavelength of radiation. Rayleigh scattering is caused by the air molecules themselves (much smaller than the wavelengths of radiation), and is strongest in the UV and blue end of the visible spectrum, and weak at the red end. It is essentially non-existent in the IR range. Mie scattering is caused by small dust particles, etc., and radiation is only scattered in wavelengths similar to the particle size. Mie scattering also only affects visible light, because particles large enough to scatter IR radiation are too large to stay suspended in the atmosphere.
As a consequence, when discussing IR radiation we can ignore scattering and only need to think about absorption. Remember earlier when we mentioned “attenuation”? Well, when we see a reduction in radiation – the “transmitted” amount leaving the cylinder is less than the amount entering the cylinder in figure 4 – we can’t tell whether it was absorbed or scattered. So, we put “absorbed and/or scattered” into one group, and call it “attenuated”. For visible light, absorption and scattering both occur and we need to know how much of each is happening. For IR radiation, though, scattering is zero so any radiation that was “attenuated” was absorbed.
Let’s get back to figure 4. We can see in the top diagram how we have radiation being transmitted, absorbed, or scattered as it passes through a volume of air. In the bottom diagram, we have just chained together a series of cylinders. As radiation passes through each cylinder, it will react according to the Beer-Lambert Law, and we will see a continued reduction in transmitted radiation. We need to be careful how we calculate the result, though. It is not a case of simply adding them together – we actually need to multiply them:
If one cylinder absorbs 1% and transmits 99%, then it is a mistake to think that 100 cylinders end-to-end will absorb 100x1% = 100%. Why? Because the “1% per cylinder” is not 1% of the original radiation amount – it is 1% of the amount that was passed from the first cylinder to the second, and the second to the third, etc.
Instead, it is easier if we think of how much is transmitted. If 1% was absorbed, then 99% was transmitted.
What we have is not a linear reduction in transmission, but an exponential one. This leads us to another common way of expressing the Beer-Lambert Law (also seen on the Wikipedia page linked earlier):
I(z) = I(0)e-μz
where
Figure 5 shows this exponential function for 200 layers of transmission, using two transmission values (0.95 and 0.9 per layer). If we mistakenly calculate that each layer removes 0.05 or 0.1 of the original radiation (y = 1 at x = 0), then we would conclude that transmission would reach zero after 20 or 10 layers respectively. As we can see, the exponential nature means that fully 1/3 of the original radiation will pass through 10 or 20 layers in these two cases.
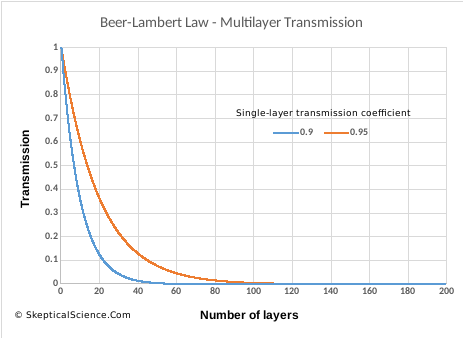
Figure 5. Transmission of radiation through multiple layers, from the Beer-Lambert Law, for two values of single-layer absorption (0.95, 0.9)
What is the practical significance of all this? Every child probably asks "why is the sky blue?" at some point. It is the difference in scattering of blue light (lots of scattering) versus red light (not much scattering) that gives us our nice blue skies. Without an atmosphere, we’d see a black sky with a bright white sun. The only reason we see light from other parts of the sky is because the atmosphere scatters the light, and more blue is scattered. And when the sun is low in the sky, it passes through a longer path in the atmosphere – as much as 40 times longer at sunset, compared to the sun positioned directly overhead. This removes even more blue light from the direct path, leaving a reddish sun. And that gives us the lovely lighting we see in figure 1.
For IR radiation? Well, there are two key things to consider:
All of this discussion started with the emailed question about CO2 ppm being so small, and not recognizing that it is the absolute amount of CO2 that is the important factor. When I first read the question, it made me think of a simple basement experiment I could try to illustrate how concentration in ppm was not important – the absolute quantity of an absorber is. I don’t know what you have in your basement, but I do not have any IR radiation measurement equipment. I do have methods of detecting visible light, though (a digital camera), and fortunately visible light and IR radiation both follow the Beer-Lambert Law.
Figure 6 shows the results of my experiment. There are four photographs, each taken with the same exposure settings. Here is what I did:
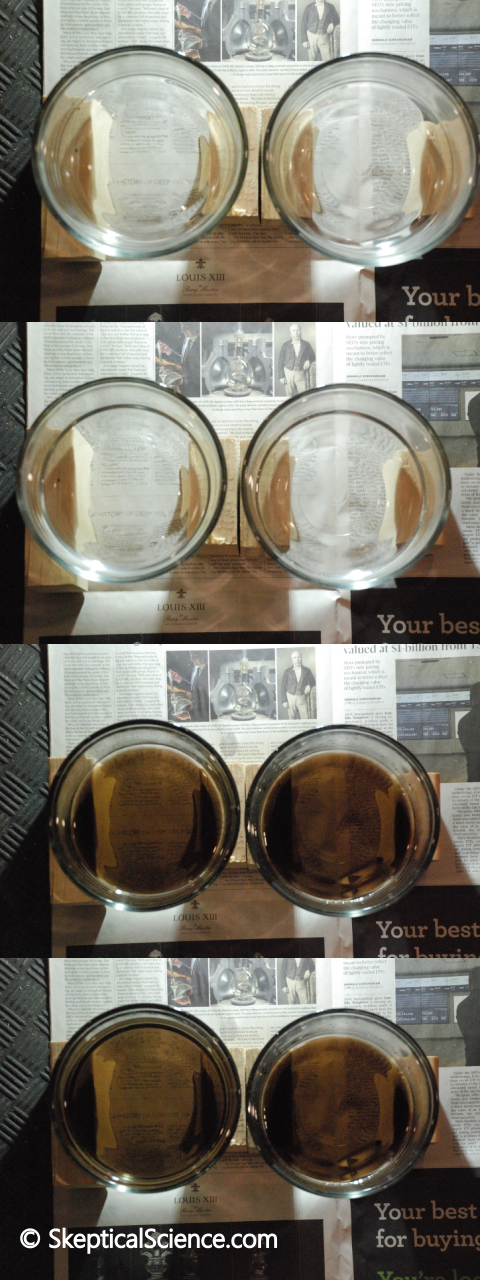
Figure 6. A simple experiment on light transmission through coloured water.
This experiment could be improved by using containers with straight sides, taller, and with better lighting control, but what I did took me about 15 minutes and is easily done at home. Instead of woodworker’s dye, you could use food colouring, liquid ink, or even a coloured soft drink to create the semi-transparent liquid.
I thought about trying to take a picture of the two containers from the side, so you could see the effects of diluting the dye when the path length does not change (homework assignment!), but the round shape of the containers and the difficulty of getting good lighting passing through the sides of the containers wasn't working out. Refraction in the glass became important, rather than transmission through the dye solution..
That’s it for our review of the Beer-Lambert Law: how it relates to the absorption of IR radiation by CO2, and how to correctly measure CO2 concentration for this purpose.
This article only touches on the complexity of radiation transfer in the atmosphere, though. The Beer-Lambert Law only looks at a one-dimensional source of radiation travelling in a single direction. Atmospheric radiation transfer is a three-dimensional problem. For visible light, we get multiple scattering, and surface and cloud reflection. For IR radiation, the earth and atmosphere are also doing the reverse of absorption – thermal energy is being transformed into photons, resulting in the emission of IR radiation in all directions. The amount of IR radiation that comes out of a volume of air is a combination of what came in and was transmitted, plus amounts emitted inside that volume of air that are added to the stream of photons.
Yes, these complexities are known, and yes, the complexities do not change the conclusion that CO2 is present in high enough concentrations to be important, and that increasing CO2 will continue to cause significant climate change over time.
Skeptical Science has pages debunking two myths related to the discussion here:
CO2 is a trace gas.
In the “trace gas” post, the discussion focuses on how trace amounts of different substances can still be dangerous. The essential part of that argument is that you need to do the science to determine whether small amounts of something are important. The post here points out that CO2 expressed in ppm is the wrong units to use. Someone could still argue that the right units (molar concentration) may still be “small”, but the next step to that argument has to be “do the math”. Climate scientists have “done the math”. CO2 is important.
The CO2 effect is saturated.
In the “CO2 is saturated” post, the discussion debunks the myth that CO2 already absorbs all the IR radiation it can, so adding more will have no effect. (Notice how this is the complete opposite of the “it’s a trace gas” myth.) The reasons why that myth is wrong are complicated, but figure 5 (above) gives a good starting point: even if absorption approaches 100% after many layers, increasing the absorption per layer will have an effect in the middle layers. At hugely-high concentrations, CO2 will eventually “saturate” in a meaningful way, but we are a long way off that level.
Posted by Bob Loblaw on Monday, 20 December, 2021
 |
The Skeptical Science website by Skeptical Science is licensed under a Creative Commons Attribution 3.0 Unported License. |