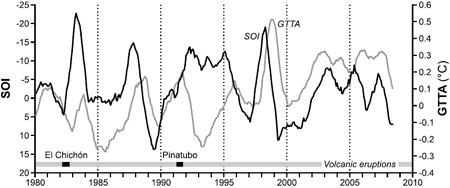
Figure 1: Twelve-month running means of SOI (dark line) and MSU GTTA (light line) for the period 1980 to 2006 with major periods of volcanic activity indicated (McLean 2009).
An old chestnut is climbing up the skeptic leaderboard: the El Niño Southern Oscillation. This is due to a new paper published in the Journal of Geophysical Research: Influence of the Southern Oscillation on tropospheric temperature (McLean 2009). What does the paper find? According to co-author Bob Carter, “The close relationship between ENSO and global temperature, as described in the paper, leaves little room for any warming driven by human carbon dioxide emissions." In other words, they claim that any global warming over the past few decades can be explained by El Niño activity.
How do they arrive at this conclusion? They begin by comparing satellite measurements of tropospheric temperature to El Niño activity. Figure 1 plots a 12 month running average of Global Tropospheric Temperature Anomaly (GTTA, the light grey line) and the Southern Oscillation Index (SOI, the black line).

Figure 1: Twelve-month running means of SOI (dark line) and MSU GTTA (light line) for the period 1980 to 2006 with major periods of volcanic activity indicated (McLean 2009).
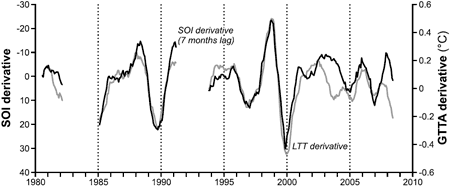
The Southern Oscillation Index shows no long term trend (hence the term Oscillation) while the temperature record shows a long term warming trend. Consequently, they find only a weak correlation between temperature and SOI. Next, they compare derivative values of SOI and GTTA. This is done by subtracting the 12 month running average from the same average 1 year later. They do this to "remove the noise" from the data. They fail to mention it also removes any linear trend, which is obvious from just a few steps of basic arithmetic. It is also visually apparent when comparing the SOI derivative to the GTTA derivative in Figure 2:

Figure 2: Derivatives of SOI (dark line) and MSU GTTA (light line) for the period 1981–2007 after removing periods of volcanic influence (McLean 2009).
The linear warming trend has been removed from the temperature record, resulting in a close correlation between the filtered temperature and SOI. The implications from this analysis should be readily apparent. El Niño has a strong short term effect on global temperature but cannot explain the long term trend. In fact, this is a point made repeatedly on this website (eg - here and here).
This view is confirmed in other analyses. Hoerling 2008 examines the temperature record from 1880 to 2007 and finds internal variability such as El Nino has relatively small impact on the long term trend. Instead, they find long term trends in sea surface temperatures are driven predominantly by the planet's energy imbalance.
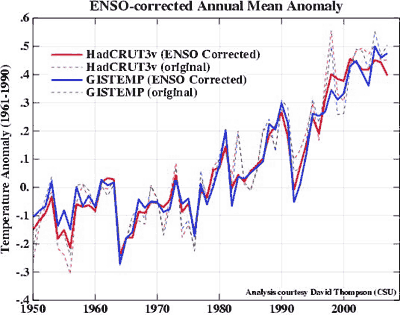
There have been various attempts to filter out the ENSO signal from the temperature record. We've examined one such paper by Fawcett 2007 when addressing the global warming stopped in 1998 argument. Similarly, Thompson 2008 filters out the ENSO signal from the temperature record. What remains is a warming trend with less variability:

Figure 3: Surface air temperature records with ENSO signal removed. HadCRUT corrections by Thompson 2008, GISTEMP corrections by Real Climate.
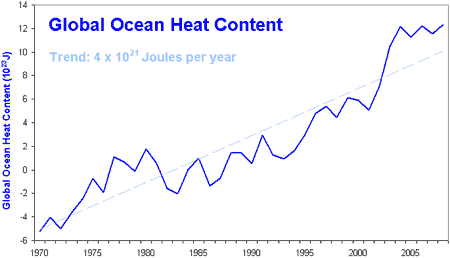
Ultimately, all the data analysis shouldn't distract us from the physical reality of what is happening to our climate. Over the past 4 decades, oceans all over the globe have been accumulating heat (Levitus 2008). The El Niño Southern Oscillation is an internal phenomenon where heat is exchanged between the atmosphere and ocean and cannot explain an overall buildup of global ocean heat. This points to an energy imbalance responsible for the long term trend (Wong 2005).

Figure 4: Global ocean heat from 1970 to 2008. Dark blue line is yearly ocean heat content for the 0–700 m layer. Light blue line is linear trend (Levitus 2008).
Data analysis, physical observations and basic arithmetic all show ENSO cannot explain the long term warming trend over the past few decades. Hence the irony in Bob Carter's conclusion "The close relationship between ENSO and global temperature leaves little room for any warming driven by human carbon dioxide emissions". What his paper actually proves is once you remove any long term warming trend from the temperature record, it leaves little room for any warming.
UPDATE 7 August 2009: A comment has been submitted to the Journal of Geophysical Research: Comment on “Influence of the Southern Oscillation on tropospheric temperature” by J. D. McLean, C. R. de Freitas, and R. M. Carter (Foster et al 2009). An excerpt from the abstract:
This comment first briefly reviews what is understood about the influence of ENSO on global temperatures, then goes on to show that the analysis of MFC09 severely overestimates the correlation between temperature anomalies and the SOI by inflating the power in the 2–6 year time window while filtering out variability on longer and shorter time scales. It is only because of this faulty analysis that they are able to claim such extremely high correlations. The suggestion in their conclusions that ENSO may be a major contributor to recent trends in global temperature is not supported by their analysis or any physical theory presented in that paper, especially as the analysis method itself eliminates the influence of trends on the purported correlations.
They talk about the 24 hour news cycle. Considering the speediness of the response, I wonder if we're heading towards a 24 hour science cycle.
Posted by John Cook on Wednesday, 29 July, 2009
 |
The Skeptical Science website by Skeptical Science is licensed under a Creative Commons Attribution 3.0 Unported License. |