My recent post about long-term CO2 targets was rather doom-and-gloom: I concluded that we must phase out fossil fuels to keep the climate in the range that humans have experienced. The good news is that action on this scale is not only possible but surprisingly feasible.
Last year, the University of Melbourne Energy Research Institute in conjunction with Beyond Zero Emissions produced the Zero Carbon Australia 2020 Stationary Energy Plan. The ZCA2020 Plan outlines an ambitious and inspiring vision: to power Australia with 100% renewable energy in ten years.
The report that has been released only covers emissions from Stationary Energy (though it does refer to electrifying transport). Five future reports are planned on how to eliminate emissions from other sectors (Transport, Buildings, Land Use and Agriculture, Industrial Processes, and Replacing Fossil Fuel Export Revenue).
As I’ve explained here, to prevent “dangerous anthropogenic interference with the climate system” we must reduce CO2 to below 350 ppm. That necessitates a rapid transition to a zero-carbon economy.
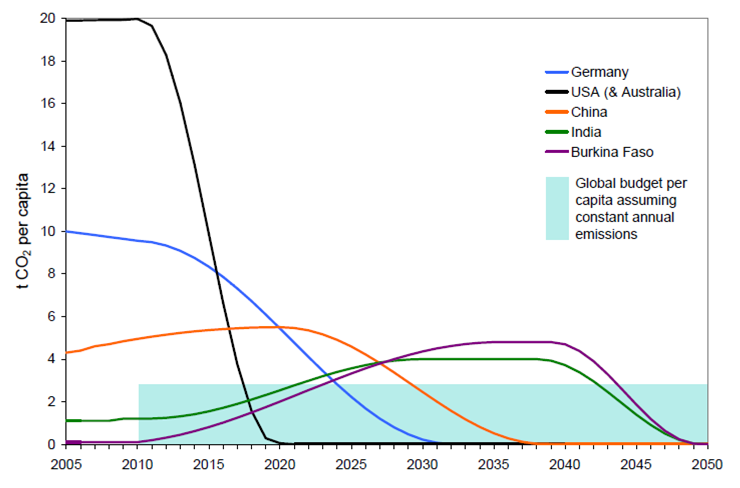
A common approach is to define a quota of allowable future global emissions to limit warming to less than 2°C above preindustrial levels, and divide them up by nation per capita. At Australia's current rate of emissions, we will use up our share of the global budget in just five years (the same goes for the US and Canada). This gives Australia about a decade to make the transition.

Figure 1: CO2 emissions budget for selected nations.
That’s why Zero Carbon Australia 2020 is not a low emissions plan but a zero emissions plan. This is a fundamentally different way of thinking about the problem. It goes straight to zero emissions technologies, without a detour through low emissions ones which would waste time and resources.
If the Plan is adopted later it could still meet a later deadline. But obviously, further delay means ever increasing risks – and the risks are already very high.
The Plan chose only technologies that can meet demand, can be implemented within ten years, are already commercially available, and (obviously) are zero-carbon, not counting emissions from construction.
60% of the grid would be powered by concentrating solar thermal (CST). The other 40% would come from wind turbines. The Plan also includes small-scale solar to reduce the grid demand during the daytime. Biomass and existing hydroelectric would be used as backups.
Of course, this is only one possible scenario. Technologies that become available in future could increase our options and reduce the cost.
Nuclear power was not considered because the implementation time is longer than a decade. Hydro and biomass are limited in scalability for unrelated environmental reasons. Wave, tidal, and geothermal are promising technologies but not yet ready. Carbon capture and storage is neither commercially available nor zero-carbon.
A common misconception is that renewables can’t provide continuous (“baseload”) power. But the technology of concentrating solar thermal can. It was proven at commercial scale in the 1990s. The US Department of Energy lists several dozen solar thermal plants currently in operation.
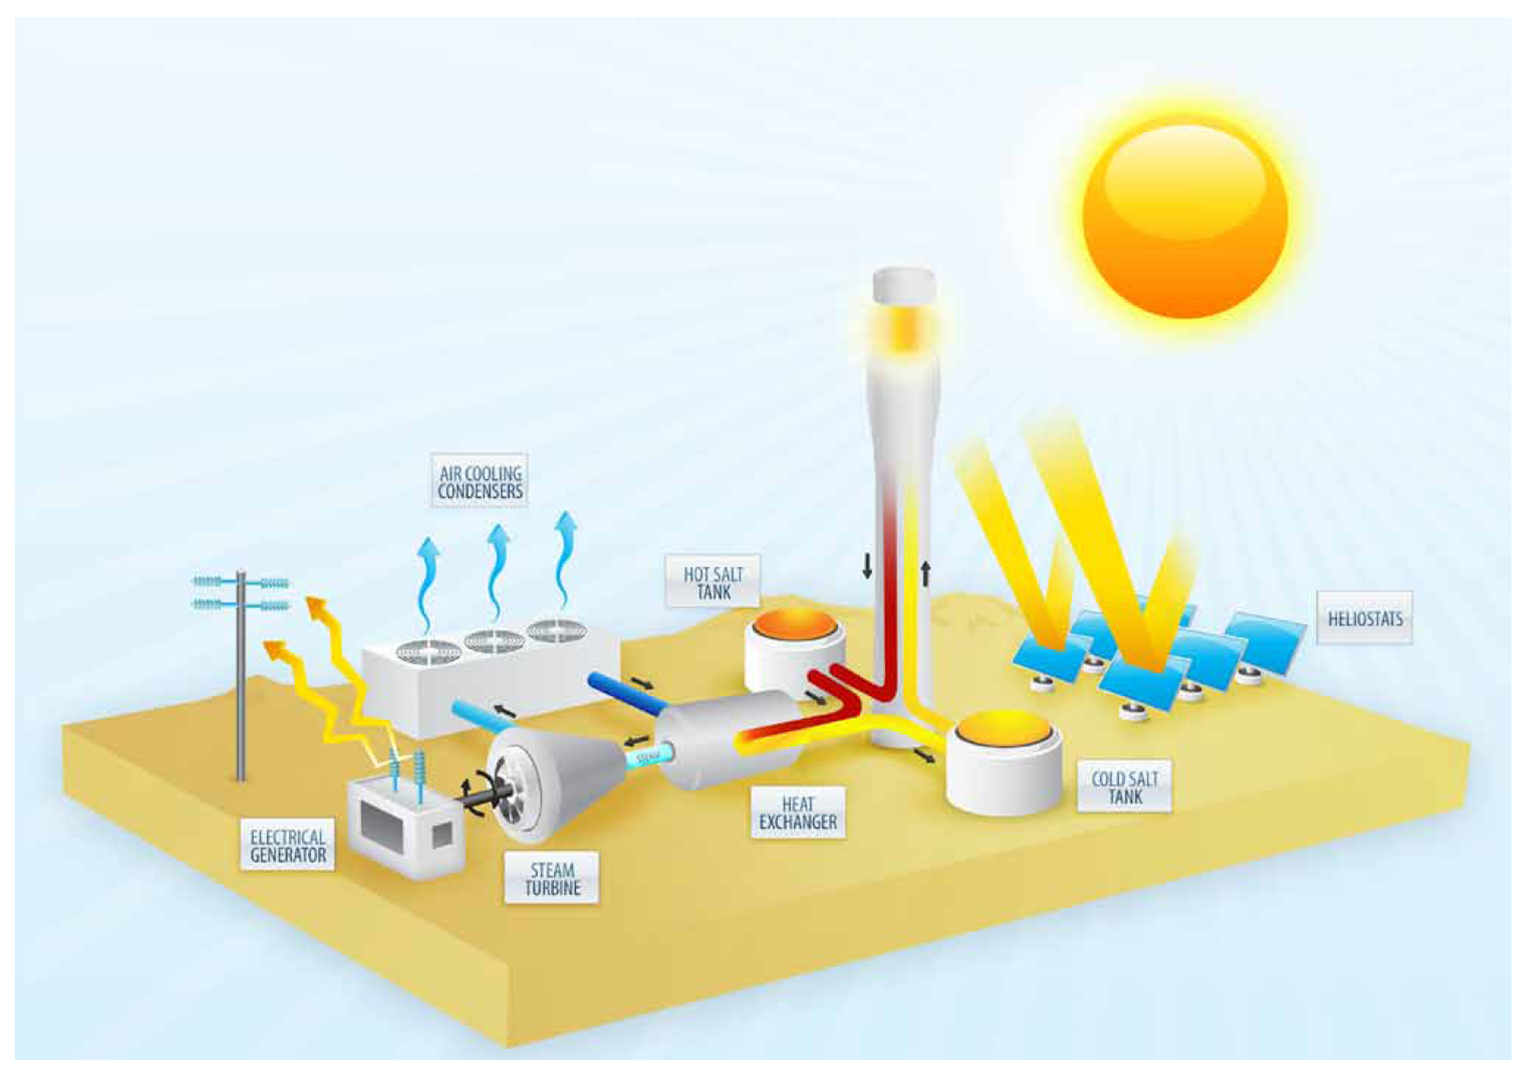
Here’s how it works. Mirrors called “heliostats” track the Sun and focus sunlight onto a central “power tower”. This energy is stored in molten salt as heat, warming the salt to 565°C. This energy storage has an efficiency of up to 93%. To produce electricity, the hot salt is pumped into a generator, where the heat is transferred to steam which drives a turbine. Once the salt is cooled to 290°C (still warm enough to be molten), it returns to the tank to be reheated.

Figure 2: Diagram of a concentrating solar thermal power plant.
The Sun doesn’t shine at night, but this is not a problem for a solar thermal plant because it has a store of energy ready to go at any time. CST can produce power around the clock. The ZCA2020 report describes it as “better-than-baseload” because it is more flexible. CST works well with wind power, because the stored solar energy can be used when there is not enough wind.
As the cheapest form of renewable energy, wind can provide a generous portion of our electricity. Because the wind isn’t blowing all the time, wind farms average only 30% of their capacity. At least half of the electricity produced (ie. 15% of capacity) is expected to be as reliable as “baseload”.
Finally, the Plan includes more than enough backup biomass capacity to fill the gaps created by worst-case weather. The hydro and biomass backups are required for just 2% of demand.
The report modeled the ZCA2020 grid, based on real-world insolation and wind speed. They assumed a demand 40% higher than today (accounting for increased energy efficiency and electrification of transport and heating). The modeling confirmed the proposed portfolio of solar, wind, hydro, and biomass would indeed supply demand.

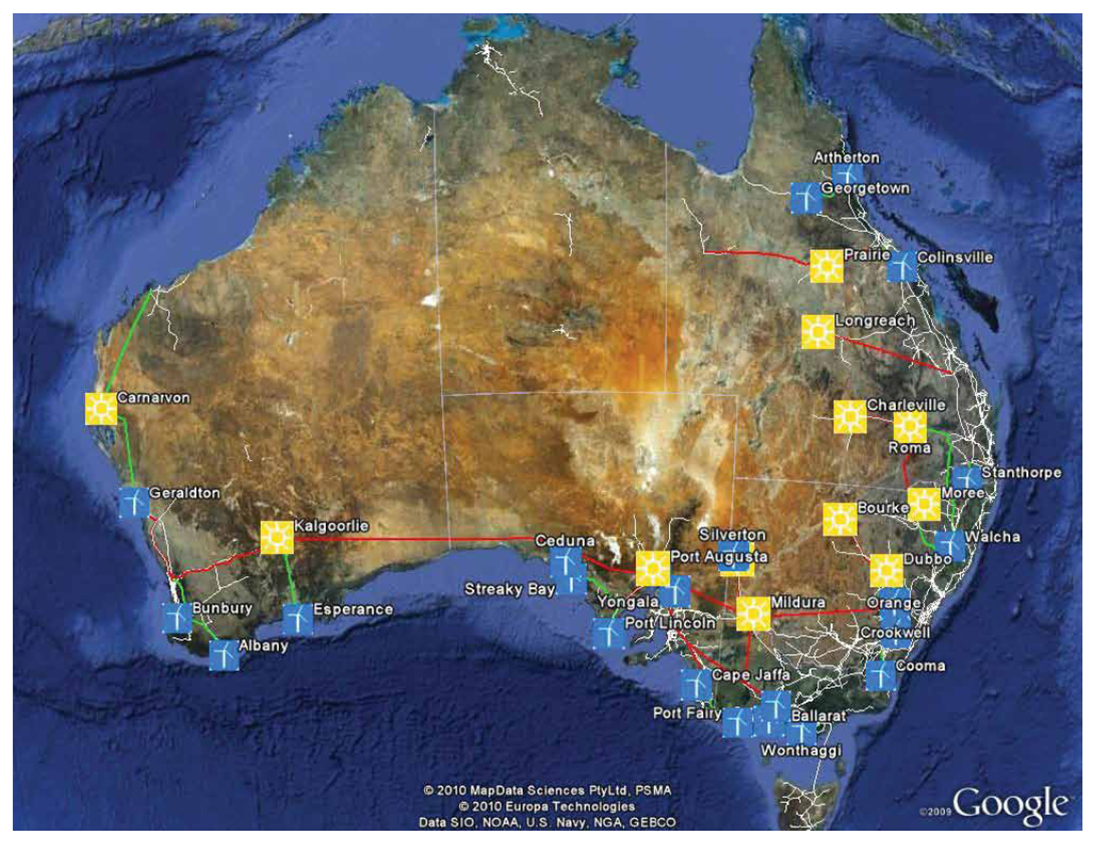
Figure 3: Map of proposed sites. Yellow squares are solar power plants, blue squares are wind power plants, red lines are high-voltage direct current transmission, and green lines are high-voltage alternating current transmission.
The Plan proposes 12 CST sites, each with 13 major power towers, each power tower with 18,000 heliostats. Together, they would have a total capacity of 42.5 GW and be able to store enough energy to meet winter demand.
The proposed locations are near Bourke, Broken Hill, Carnarvon, Charleville, Dubbo, Kalgoorlie, Longreach, Mildura, Moree, Port Augusta, Prairie, and Roma. These towns are far enough inland to have high sunlight throughout the year, but close enough to the populated coasts for it to be economical to build high-voltage transmission lines.
Each site would measure approximately 16 by 16 km. The total land used would be less than 3,000 km2. That’s comparable to Kangaroo Island, smaller than some large cattle stations, and 0.04% of the area of Australia.
To provide enough reliable wind power for a 40% target, we need a total capacity of 50 GW, 25 times what it is now. The best commercially available wind turbines have a capacity of 7.5 MW, so we need to build 6,400 of them. Land covered by wind turbines can still be used as farmland.
The Plan proposes 23 sites dotted around the coast. The locations are widely dispersed so the grid is not dependent on the weather in any one place. They are also chosen for high wind speeds in winter, when less solar power is available. Each site has annual average wind speeds of at least 25 km/h.
To put all this in perspective, some other nations are investing in renewables on a large scale. China already has 25 GW of wind capacity and will have 150 GW in five to ten years. Denmark has a target of 50% wind power by 2025. And Spain will have 2.5 GW of solar thermal capacity by 2013.
The CST plants would be built in two stages. The first stage would begin by constructing small power towers and gradually ramp up until 2015, when solar power costs become competitive with coal power. The majority of the power supply would come online during the second stage, with a constant rate of manufacture to 2019.
Wind would be scaled up faster because it is cheaper and there are already a number of installations in the pipeline. New projects would start every six months and take a year to complete. A three-year ramp-up should lower the cost to European levels, also followed by a constant rate of construction.
The Plan involves building 23,000 km of high voltage transmission – both to connect the new power stations to the grid, and to connect the multiple existing grids to each other (so supply does not depend on the weather in one place).
At peak construction, the Plan requires 600,000 heliostats and 1,000 wind turbines per year. These could either be mass-produced in Australia or imported. In Australia it could create 30,000 jobs in manufacturing.
The plan would also create 80,000 new construction-related jobs, and 45,000 ongoing jobs in operation and maintenance, replacing an equivalent 20,000 in fossil fuels. In addition, the 30,000 manufacturing jobs could also be retained to export components to the world. Some solar jobs would even be in the same areas as lost mining jobs.
The concrete needed is a tiny fraction of Australia’s resources, and the steel a tiny fraction of our exports. A solar power plant uses merely 12% as much water as a coal power plant. However, we would need several new factories producing glass and other materials.
The total capital cost over the decade is $370 billion, or 3% of GDP per year. That’s about the amount of money spent on insurance, or the value added by the real estate sector, or the money spent on coal, gas and uranium. Most of the money is spent in the latter half of the decade, after the public has already seen some of the benefits of the initial investment.
About half of the money, $175 billion, would be spent on solar thermal plants, as well as $92 billion to upgrade the grid, $72 billion on wind turbines, $17 billion on off-grid solar, and $14 billion on biomass. However, the Plan looks at these costs as an investment. It leaves open the question of where the funding would come from, suggesting a combination of public and private sources.
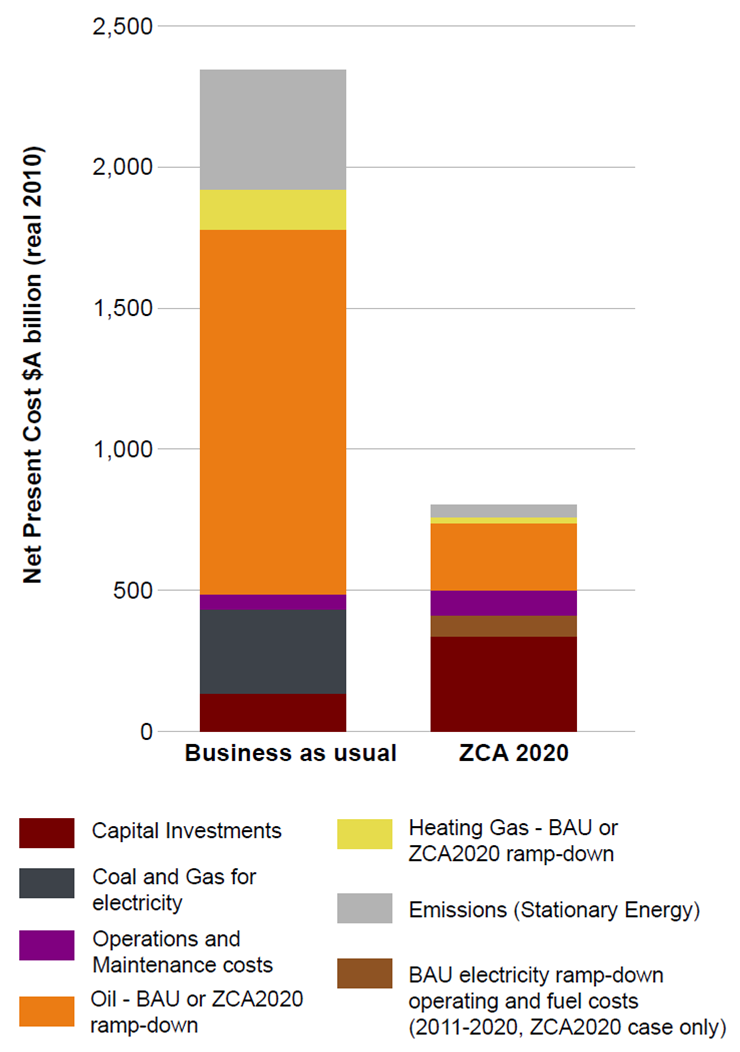
The investment pays itself back by 2040 or as soon as 2022, depending on which costs you count. The Net Present Cost over the period 2011-2040 is equal to business-as-usual (BAU) if you only include direct costs. Though the capital costs of ZCA2020 are much higher than BAU, more money is saved because solar power plants do not need a constant supply of coal and gas for fuel. If you also take into account the Net Present Cost of oil and (possibly) priced emissions under BAU, ZCA2020 could potentially save $1.5 trillion.

Figure 4: Net present value of ZCA2020 Plan compared to business as usual.
All the above completely ignores climate and environmental costs, which obviously would heavily favor ZCA2020. The Stern Review estimated that a global effort to mitigate climate change could save 20% of GDP per year by 2050.
The effect of the transition on electricity prices depends on how it is funded. In one possible scenario, they could rise by $8 per household per week, similar to what is expected under BAU.
The report does not address this as it is a political question. However, it does point out companies were aware of the risk to their industry when they invested in their assets.
Now I wish I knew the answer to that one. When Australia (and the world) finally wakes up to the climate crisis, Zero Carbon Australia 2020 provides a useful blueprint for decarbonising our energy sector. But we’d better wake up pretty damn quick.
Societies have shown that they can be mobilized by ambitious visions. When J.F.K. proposed landing a man on the Moon before the end of the 1960s, it seemed incredible. Yet the goal was accomplished twice before the deadline.
So far Australia has not shown leadership on clean energy, preferring to see itself as a mining nation. Renewable energy entrepreneurs are going overseas because there is no market in Australia. Yet we have vast untapped renewable resources.
Global warming is a very real and urgent threat. As an extremely high per capita emitter Australia has an imperative to take drastic mitigating action. ZCA2020 shows powering Australia with renewable energy is feasible using commercially available technology. Solar thermal can provide better-than-baseload power. The transition would stimulate the economy, save up to $1.5 trillion by 2040, create jobs, and make Australia a leader in clean energy. So what are we waiting for?
Posted by James Wight on Saturday, 19 March, 2011
 |
The Skeptical Science website by Skeptical Science is licensed under a Creative Commons Attribution 3.0 Unported License. |