As mentioned in the recently published prolog to EGU2026 article, I submitted an abstract to talk about the results of the experiment we ran on Skeptical Science to gauge the effectiveness of our rebuttals. This blog post is a "companion article" to that presentation in session EOS4.1 Geoethics: Linking Geoscience Knowledge, Ethical Responsibility, and Action and will go into somewhat greater details than is possible in the 8 minutes available during the oral session for my presentation about Results of the Skeptical Science experiment and impacts on relaunched website.
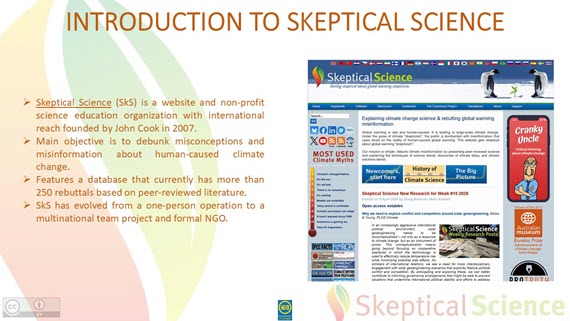
Skeptical Science (SkS) is a website and non-profit science education organization with international reach founded by John Cook in 2007. Our main purpose is to debunk misconceptions and misinformation about human-caused climate change and our website features a database that currently has more than 250 rebuttals based on peer-reviewed literature. SkS has evolved from a one-person operation to a team project with volunteers from around the globe.
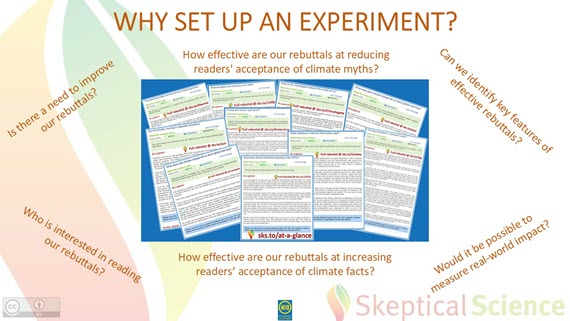
We wanted to find out how effective our rebuttals are at reducing belief in myths and how effective they are in increasing acceptance of facts. We hoped to find out if there was a need to improve our rebuttals, whether we could identify key features of effective rebuttals, learn who is interested in reading our rebuttals and even if we could measure real-world impact of them.
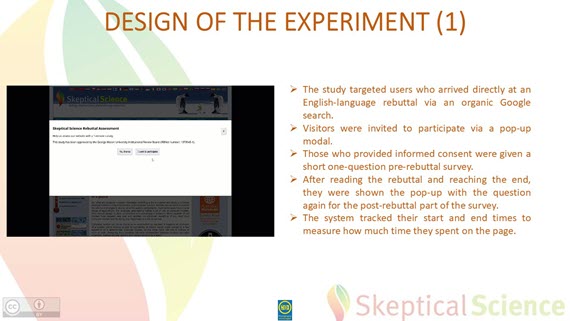
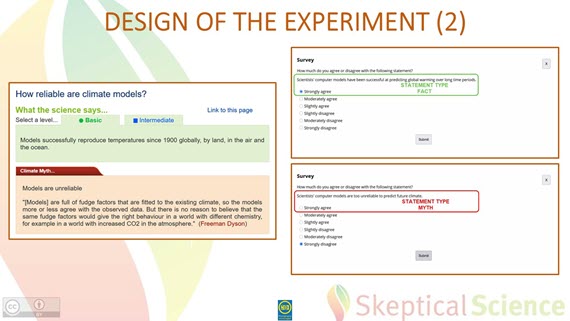
Users arriving via an organic Google search at an English language rebuttal were invited to participate in a short survey via a modal screen. If they provided informed consent they were shown a pre-rebuttal survey and after reading through the rebuttal and reaching its end they were shown the same survey again as the post-rebuttal part. We also tracked their start and end times to measure how much time they spent on the page.
For both the pre- and post-rebuttal survey participants were shown the same statement related to the rebuttal they accessed. They randomly either saw a fact or a myth statement. The full list of statements used in the experiment is available in Appendix A of our published paper.
Here is an example:
Participants then selected their level of (dis)agreement with either of those statements on a 6-point Likert scale from "Strongly agree" to "Strongly disagree".
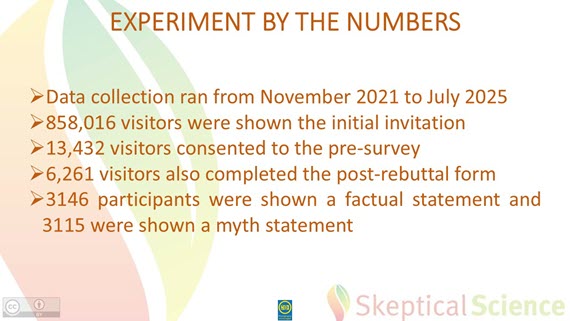
The data analysed for our recently published paper spans the period from November 2021 to July 2025. During that time, 858,016 visitors were shown the initial invitation, 13,432 consented to participate and filled out the pre-survey. 6,261 of them also completed the post-rebuttal form. 3146 participants were shown a factual statement in the survey quiz while 3115 were shown a myth statement.
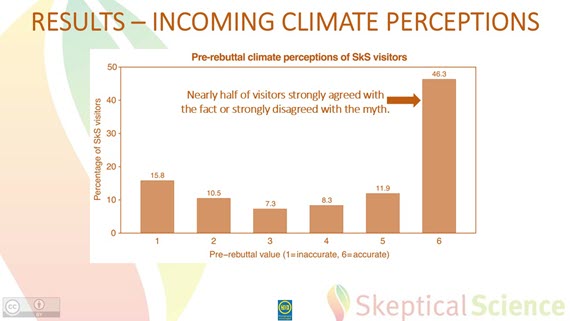
The majority of participants came to the website already convinced about climate change with nearly half of them (46.3 %) showing either full agreement with the climate fact or full disagreement with the climate myth. We may therefore either be just "chanting to the choir" or - what we hope is the case as it's a more constructive interpretation - our content is “teaching the choir to sing” by providing resources that empower people to respond to climate misinformation. Our survey also reached a significant number of undecided or dismissive users.
We also looked at the change in accuracy - the difference between the pre- and post-rebuttal surveys. And the results are a bit of a mixed bag:
The good news is that overall, the belief in myths decreased and that we saw improved climate perceptions even among "dismissive" readers, those who either agreed strongly with the myth or disagreed strongly with the fact in the pre-survey.
The not so good news is that for a small subset of visitors and specific rebuttals, percpetion actually decresased. Those who were already highly certain (strongly agreed with facts) sometimes saw a slight dip in accuracy after reading a rebuttal. Certainly, not what we had hoped to see!
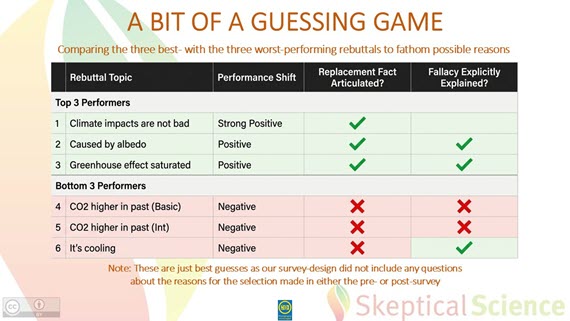
We had decided to keep the survey short with only one question asked to maximize participation, and therefore didn't include a question to learn why participants selected one of the options. Because of that we had to play a bit of a "guessing game" to find out what might have led to the decrease in perception for some rebuttals.
We decided to look at rebuttals which had received at least 50 completed surveys and devided them into two groups of top vs bottom performing rebuttals. We then compared the Top 3 (positive shift) to the Bottom 3 (negative shift) performers:
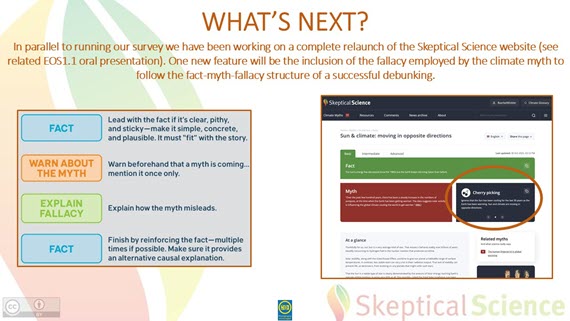
In parallel to running our experiment, we have been working on a complete relaunch of the Skeptical Science website (see related companion blog post for EOS1.1). One new feature will be the inclusion of the fallacy employed by the climate myth. The results of our experiment indicate that moving to the fact-myth-fallacy structure in our rebuttals is a pretty good idea to increase chances of a successful debunking.
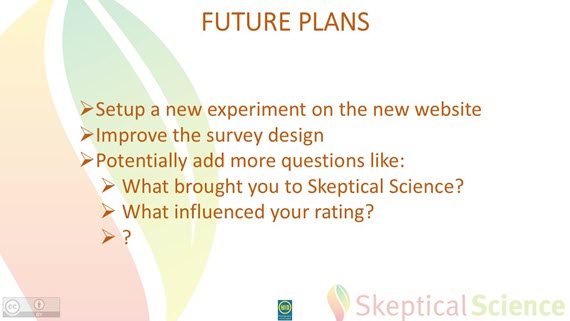
We plan to restart the experiment some time after the relaunch of the Skeptical Science website. When we do, we plan to improve the survey design based on what we learned during this first run. We will most likely also add a few targeted and potentially open-ended questions to avoid having to guess what brought people to our website or what influenced their rating.
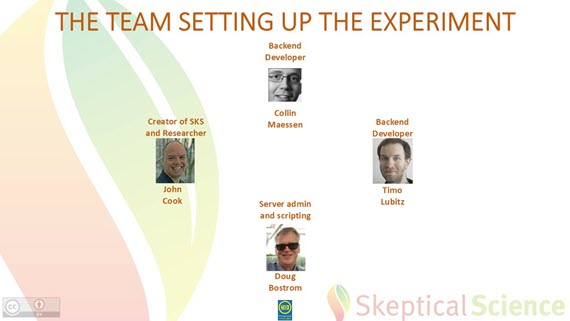
The setup for the experiment was implemented by members from our volunteer team, bringing their respective experience and knowledge to the table:
Our full results were published open access in Geoscience Communication on April 2, 2026 in Quantifying the impact of Skeptical Science rebuttals in reducing climate misperceptions.
You can download the full presentation in PDF-format here (2.5MB).
Reference: Winkler, B. and Cook, J.: Results of the Skeptical Science experiment and impacts on relaunched website, EGU General Assembly 2026, Vienna, Austria, 3–8 May 2026, EGU26-4110, https://doi.org/10.5194/egusphere-egu26-4110, 2026.
Posted by BaerbelW on Tuesday, 5 May, 2026
 |
The Skeptical Science website by Skeptical Science is licensed under a Creative Commons Attribution 3.0 Unported License. |