 The Intergovernmental Panel on Climate Change (IPCC) Second Assessment Report (SAR) was published in 1995, following the IPCC First Assessment Report (FAR), which we examined in the last Lessons from Past Climate Predictions entry.
The Intergovernmental Panel on Climate Change (IPCC) Second Assessment Report (SAR) was published in 1995, following the IPCC First Assessment Report (FAR), which we examined in the last Lessons from Past Climate Predictions entry.
In 1992, the IPCC published a supplementary report to the FAR, which utilized updated greenhouse gas emissions scenarios called "IS92" a through f. The 1995 SAR continued the use of these emissions scenarios, and made the following statements about the state of climate models their future projections.
"The increasing realism of simulations of current and past climate by coupled atmosphere-ocean climate models has increased our confidence in their use for projection of future climate change. Important uncertainties remain, but these have been taken into account in the full range of projections of global mean temperature and sea level change."
"For the mid-range IPCC emission scenario, IS92a, assuming the "best estimate" value of climate sensitivity and including the effects of future increases in aerosol, models project an increase in global mean surface air temperature relative to 1990 of about 2°C by 2100. This estimate is approximately one third lower than the "best estimate" in 1990. This is due primarily to lower emission scenarios (particularly for CO, and the CFCs), the inclusion of the cooling effect of sulphate aerosols, and improvements in the treatment of the carbon cycle."
Perhaps one of the biggest improvements between the FAR and SAR was the increased understanding of and thus ability to model aerosols. Section B.6 of the report discusses the subject.
"Aerosols in the atmosphere influence the radiation balance of the Earth in two ways: (i) by scattering and absorbing radiation - the direct effect, and (ii) by modifying the optical properties, amount and lifetime of clouds - the indirect effect. Although some aerosols, such as soot, tend to warm the surface, the net climatic effect of anthropogenic aerosols is believed to be a negative radiative forcing, tending to cool the surface"
"there have been several advances in understanding the impact of tropospheric aerosols on climate. These include: (i) new calculations of the spatial distribution of sulphate aerosol largely resulting from fossil fuel combustion and (ii) the first calculation of the spatial distribution of soot aerosol."
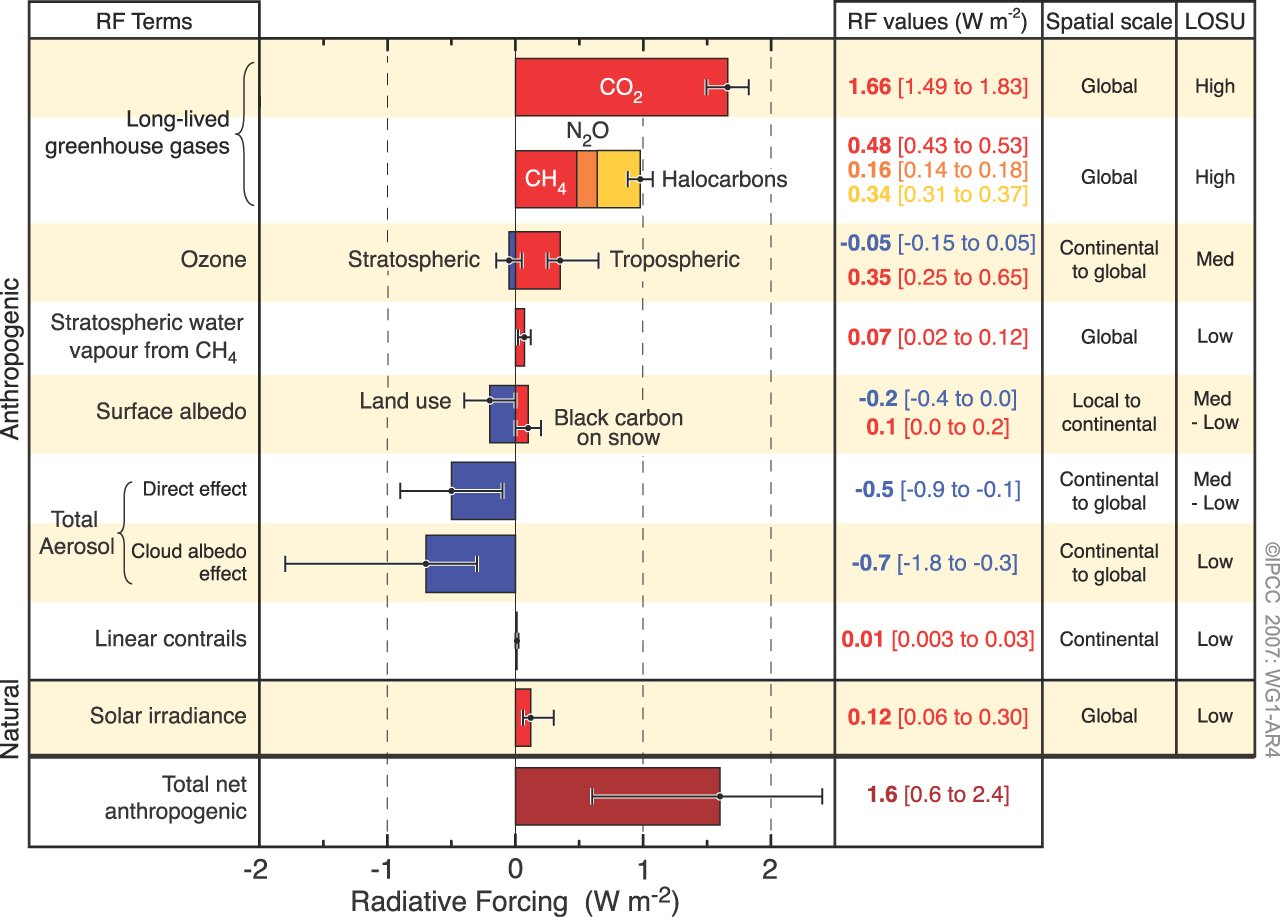
The SAR's estimated radiative forcings, including from aerosols, are shown in Figure 1.
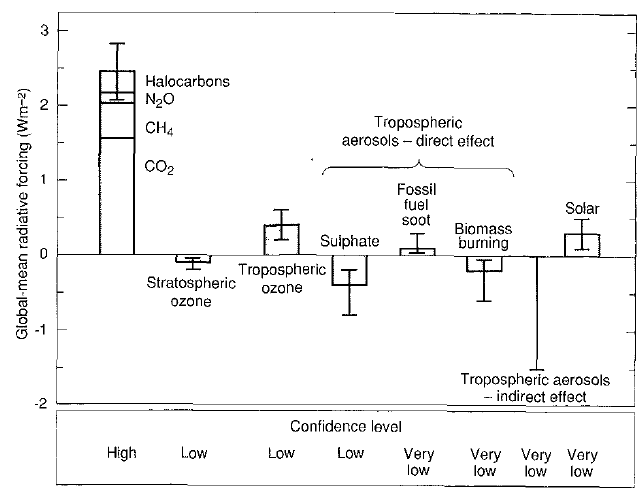
Figure 1: IPCC SAR etimates of the globally and annually averaged anthropogenic radiative forcing due to changes in concentrations of greenhouse gases and aerosols from pre-industrial times to 1992, and to natural changes in solar output from 1850 to 1992. The height of the rectangular bar indicates a mid-range estimate of the forcing whilst the error bars show an estimate of the uncertainty range.
The projected CO2 emissions and atmospheric concentrations in the IS92 scenarios are illustrated in Figure 2.
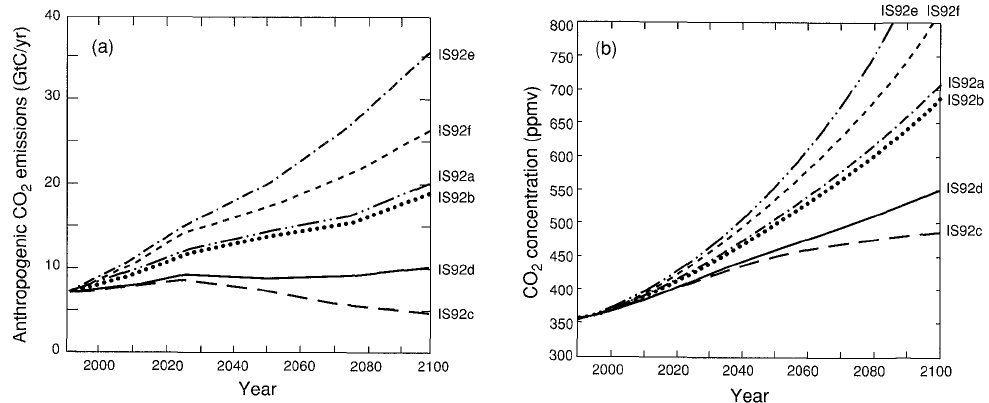
Figure 2: Total anthropogenic CO2 emissions under the IS92 emission scenarios and (b) the resulting atmospheric CO2 concentrations
So far, the IS92a and b scenarios have been closest to actual emissions, with scenarios e and f running just a bit high, and scenarios c and d increasingly diverging from actual emissions. However, by the year 2011, the atmospheric CO2 concentrations in each scenario are not yet very different. The IPCC SAR also provided a figure with the projected radiative forcings in Scenario IS92a (Figure 3).
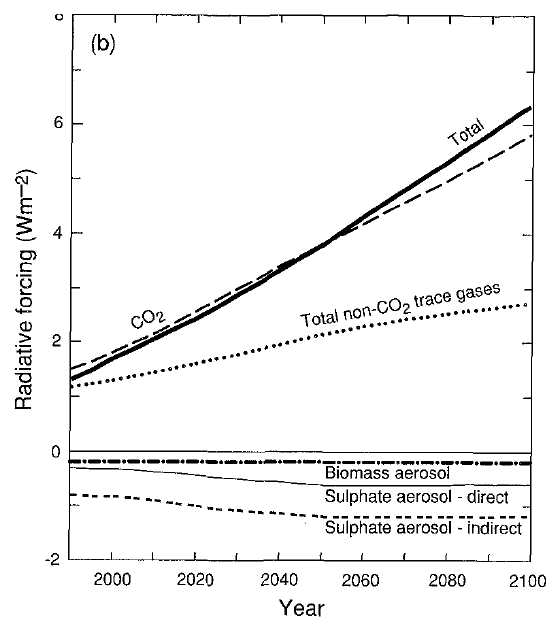
Figure 3: Projected radiative forcings in IPCC Scenario IS92a for 1990 to 2100.
One interesting aspect of this scenario is that the IPCC projected the aerosol forcings remaining strong throughout the 21st Century. Given that aerosols have a short atmospheric lifetime of just 1 to 2 years, maintaining this forcing would require maintaining aerosol emissions throughout the 21st Century. Since air quality and its impacts to human health are a related concern, it seems likely that human aerosol emissions will decline as the century progresses. This issue was one significant change made in the IPCC Third Assessment Report (TAR) projections - the next entry in the Lessons from Past Climate Predictions series.
The IPCC SAR also maintained the "best estimate" equilibrium climate sensitivity used in the FAR of 2.5°C for a doubling of atmospheric CO2. Using that sensitivity, and the various IS92 emissions scenarios, the SAR projected the future average global surface temperature change to 2100 (Figure 4).
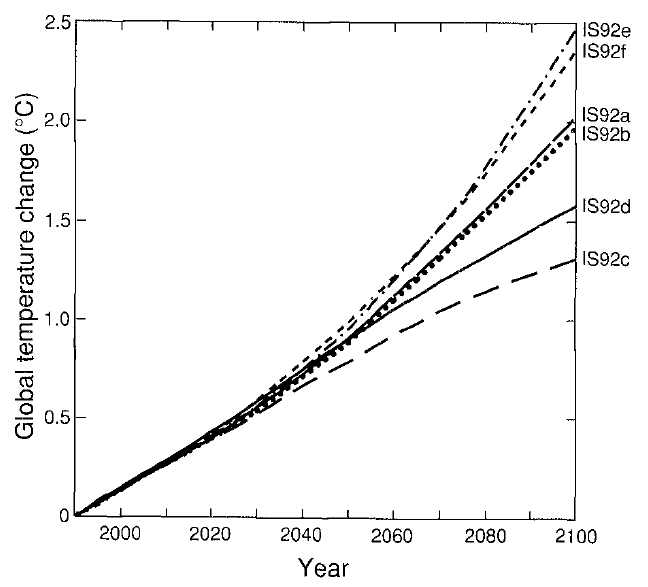
Figure 4: Projected global mean surface temperature changes from 1990 to 2100 for the full set of IS92 emission scenarios. A climate sensitivity of 2.5°C is assumed.
One helpful aspect of these scenarios is that the temperature projections from 1990 to 2011 are nearly identical, so the choice of scenarios makes little difference in evaluating the SAR projection accuracy to date. So how do these projections stack up against observations? We digitized the graph and compared it to observed temperatures from GISTEMP to find out (Figure 5).
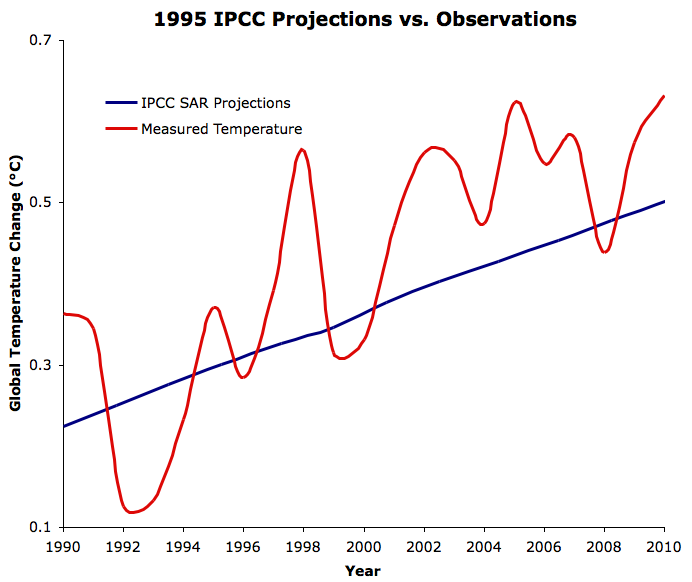
Figure 5: IPCC SAR global warming projections under the IS92 emissions scenarios from 1990 to 2010 (blue) vs. GISTEMP observations (red).
As you can see, the IPCC SAR projections were quite a bit lower than GISTEMP's measurements, anticipating approximately 0.1°C less warming than was observed over the past two decades. So where does the SAR projection go wrong?
The IS92a projected radiative forcings (Figure 3) have been quite close to reality thus far. Updating the radiative forcings from the IPCC Fourth Assessment Report (AR4), the net forcing is almost the same as the CO2 forcing, which is close to 1.8 W/m2 in 2010. This is almost exactly what the SAR projects in Figure 3.
However, the SAR used a radiative forcing of 4.37 W/m2 for a doubling of atmospheric CO2. The IPCC TAR updated this value five years later with the value which is still in use today, 3.7 W/m2 (see TAR WGI Appendix 9.1). Since the SAR overestimated the energy imbalance caused by a doubling of CO2, they also overestimated the climate sensitivity of their model. If we correct for this error, the actual sensitivity of the SAR "best estimate" climate models was 2.12°C for doubled CO2, rather than their stated 2.5°C.
We can then compare the trend in the SAR model to the observed trend and determine what model sensitivity would have correctly projected the observed warming trend. Matching the observations results in a model equilibrium sensitivity of approximately 3°C (Figure 6).
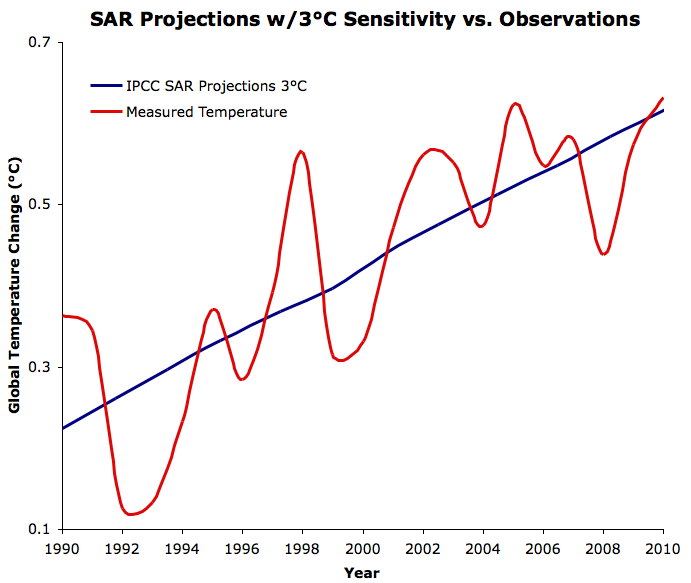
Figure 6: IPCC SAR global warming projections under the IS92 emissions scenarios from 1990 to 2010 with a 3°C equilibrium climate sensitivity (blue) vs. GISTEMP observations (red).
The SAR projection of the warming over the past two decades hasn't been terribly accurate, although it was still much better than most "skeptic" predictions, because the IPCC models are based on solid fundamental physics. The SAR accurately projected the ensuing radiative forcing changes, although it likely overestimated continued aerosol emissions in the second half of the 21st Century, and thus likely underestimated future warming.
The main problem in the SAR models and projections was the overestimate of the radiative forcing associated with doubling atmospheric CO2, and thus the underestimate of the equilibrium climate sensitivity to doubled CO2 (2.12°C). In fact, the comparison between observations and the IPCC SAR projected warming provides yet another piece to the long list of evidence that equilibrium climate sensitivity (including only fast feedbacks) is approximately 3°C for doubled CO2.
Posted by dana1981 on Thursday, 1 September, 2011
 |
The Skeptical Science website by Skeptical Science is licensed under a Creative Commons Attribution 3.0 Unported License. |