Climate Science Glossary

Term Lookup

Enter a term in the search box to find its definition.

Settings

Use the controls in the far right panel to increase or decrease the number of terms automatically displayed (or to completely turn that feature off).

Term Lookup

Settings


All IPCC definitions taken from Climate Change 2007: The Physical Science Basis. Working Group I Contribution to the Fourth Assessment Report of the Intergovernmental Panel on Climate Change, Annex I, Glossary, pp. 941-954. Cambridge University Press.

Home Arguments Software Resources Comments The Consensus Project Translations About Support

Twitter Facebook YouTube Mastodon MeWe

RSS Posts RSS Comments Email Subscribe


Climate's changed before
It's the sun
It's not bad
There is no consensus
It's cooling
Models are unreliable
Temp record is unreliable
Animals and plants can adapt
It hasn't warmed since 1998
Antarctica is gaining ice
View All Arguments...


Username
Password
New? Register here
Forgot your password?

Latest Posts

Archives

Lessons from Past Climate Predictions: Don Easterbrook

Posted on 29 June 2011 by dana1981

This is the first in what we plan to be a long series of posts evaluating climate predictions by both so-called "warmists" and so-called "skeptics" re-posted on "skeptic" blog WattsUpWithThat (WUWT) in which he predicted imminent global cooling.  His prediction is illustrated in Figure 1 below.  Easterbrook has been making similar predictions of imminent global cooling since 1998, according to his own account on WUWT.

In 2008, "skeptic" geologist Don Easterbook gave a presentation at the American Geophysical Union annual meeting,

Easterbrook global cooling projection

Figure 1: Easterbrook's global temperature projections (Source)

The obvious question now, given that the IPCC and virtually all climate scientists are predicting rapidly accelarating global warming: how did he arrive at these predictions of little warming or significant cooling?

Unfortunately that's not an easy question to answer, because Easterbrook is not very explicit about his methodology.

"Comparisons of historic global climate warming and cooling, glacial fluctuations, changes in warm/cool mode of the Pacific Decadal Oscillation (PDO) and the Atlantic Multidecadal Oscillation (AMO), and sun spot activity over the past century show strong correlations and provide a solid data base for future climate change projections."

"I used a very conservative estimate for the depth of cooling, i.e., the 30-years of global cooling that we experienced from ~1945 to 1977.  However, also likely are several other possibilities (1) the much deeper cooling that occurred during the 1880 to ~1915 cool period, (2) the still deeper cooling that took place from about 1790 to 1820 during the Dalton sunspot minimum, and (3) the drastic cooling that occurred from 1650 to 1700 during the Maunder sunspot minimum."

In short, Easterbrook's predictions are based on assuming that correlation equals causation, and a few of the myths in our database including the top 2 most used "skeptic" arguments - "Climate's changed before", "It's the sun", and "It's Pacific Decadal Oscillation".  Easterbrook assumes that the cooling periods in the past might be repeated again in the future, presuming they were mainly caused by solar activity and PDO.

Easterbrook also apparently does not believe that human greenhouse gas emissions will have any significant effect on global temperatures; therefore, this is not a physics-based prediction.  Even the most ardent climate scientist "skeptics" like John Christy and Richard Lindzen admit that human CO2 emissions will cause some amount of warming, based on fundamental atmospheric physics.

However, despite their fundamental flaws, we can still proceed and evaluate the accuracy of Easterbrook's temperature projections.  The next question that comes to mind: are the variables Easterbrook takes into consideration closer to their states during 1945-1977 or 1880-1915?  In other words, which of his projections should we be looking at?  In order to try to answer this question, we looked at the average value for PDO, AMO, and sunspot number over the two prior cooling periods Easterbrook references, as well as the past decade (Table 1).

Table 1: Average values for PDO, AMO, and sunspot number during Easterbrook's chosen timeframes.  Easterbrook Indicators

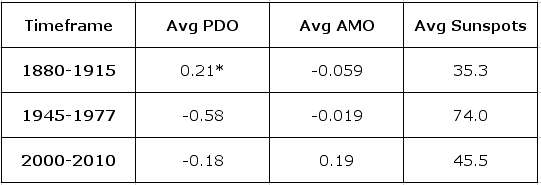
* - PDO data is only available since 1900.

As you can see, just looking at Easterbrook's three indicators, it's difficult to even determine why there was slightly more cooling in 1880-1915 (~0.3°C) than 1945-1977 (~0.15°C).  This is the difficulty when physics isn't taken into account, because for example volcanic activity is disregarded, as is the warming from human greenhouse gas emissions from 1945 to 1977, and the cooling from human aerosol emissions over that period, and sunspot activity is not a perfect indicator of solar irradiance, and so on.

Nevertheless, we can say that sunspot activity has been almost as low over the past decade than it was during 1880-1915, and lower than 1945-1977.  PDO over the past decade has been between the two prior periods, but AMO has been higher.  But based solely on these three criteria, it's difficult to determine which of Easterbrook's scenarios is more applicable, so we'll just proceed by evaluating both.

Now for the million dollar question - how close have Easterbrook's projections been to observed temperature changes since 2000?

In order to answer this question, we digitized Easterbrook's projections, and compared them to observed global temperature changes.  Between 2000 and 2010, Easterbrook's 1945-1977 scenario (which we call "Easterbrook A") projected a cooling of approximately 0.19°C, versus a cooling of 0.38°C over this period in his 1880-1915 scenario (Easterbrook B).  The observed temperature change from 2000 to 2010, on the other hand, is approximately 0.12°C warming, according to the Wood for Trees Temperature Index, which is the average of the four main temperature data sets (HadCRUT3, GISTemp, RSS, and UAH).

Figures 2 and 3 below compare Easterbrook's temperature projections to the observational global temperature data from NASA GISS.  Note: we shifted Easterbrook's projections downwards to match the GISTemp 5-year running average in 2000.  We inquired as to which temperature data set Easterbrook used in his graphic, and he responded that he took it from one of the IPCC report figures.  However, since we're looking at temperature changes, and using temperature anomalies (change from a certain baseline) rather than absolute temperatures, the starting point is unimportant.  What matters is that his projections begin where the observed temperature leaves off in 2000 (as in Figure 1), and how much global temperature change is projected vs. observed from that point on.

Easterbrook Projections

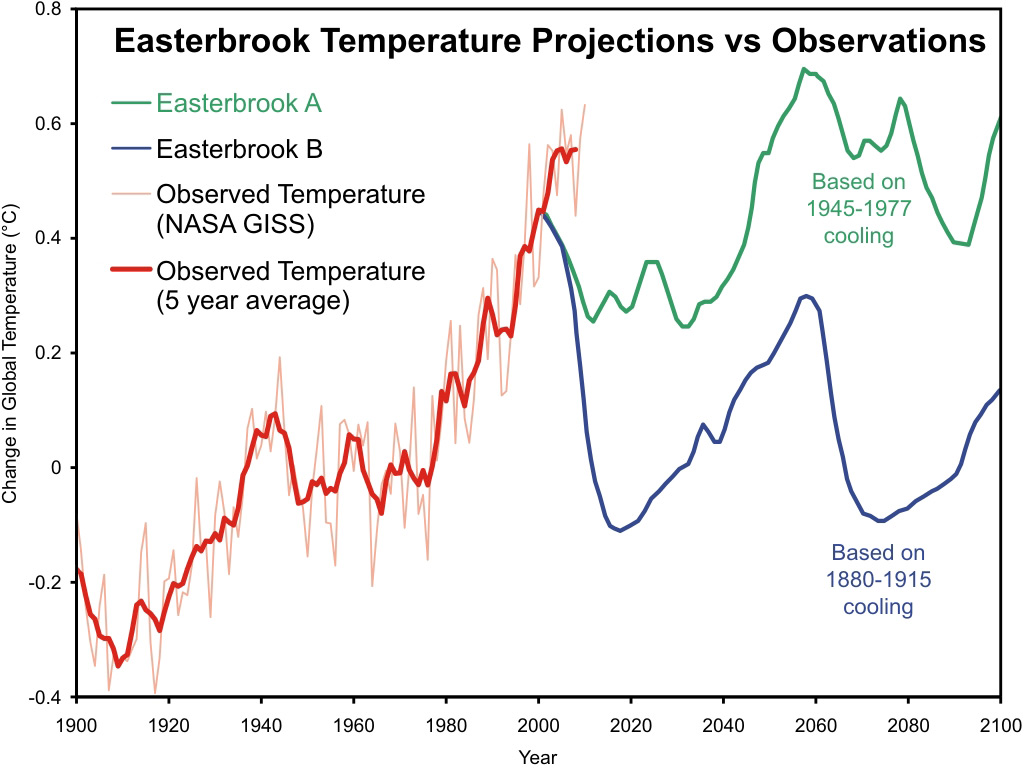
Figure 2: Easterbrook's temperature projections vs. GISTemp land-ocean data

Easterbrook zoomed

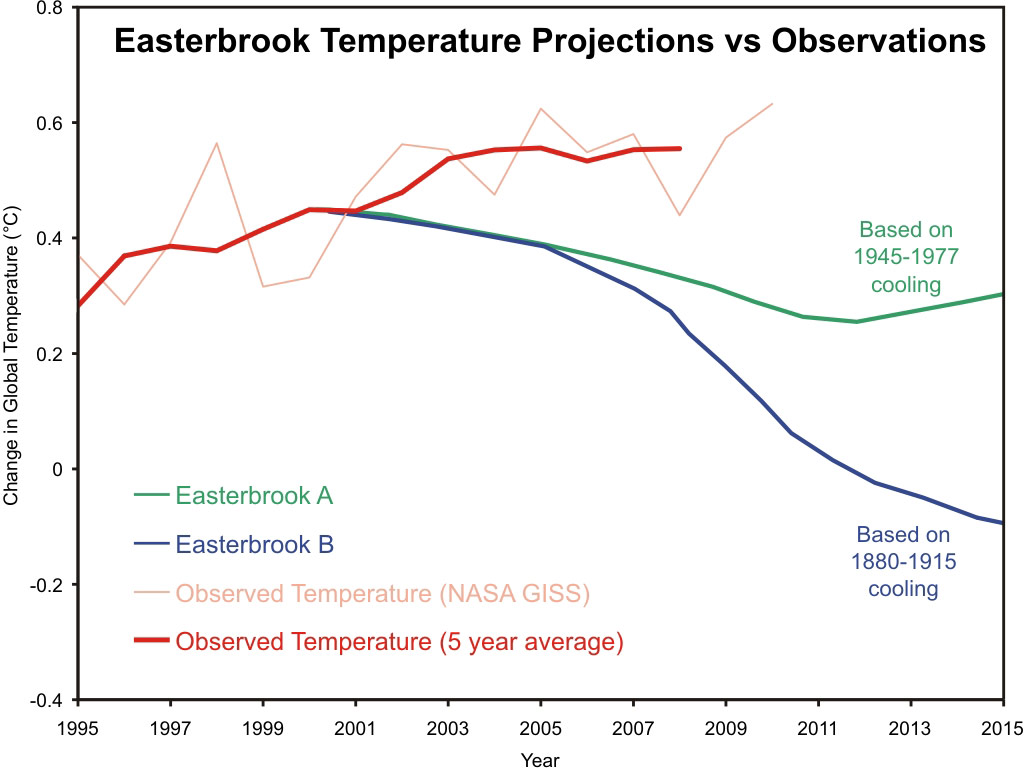
Figure 3: Easterbrook's temperature projections vs. GISTemp land-ocean data, zoomed in to focus on 2000-2010

In short, over the first decade of his global cooling projections, Easterbrook has already been wrong by between 0.3 and 0.5°C.  This awe-uninspiring result is due to the fact that Easterbrook's is not a physics-based model.  He simply assumes that correlation equals causation and future climate change will be similar to past patterns.  However, given that human greenhouse gas emissions are dominating current and future climate changes, ignoring this elephant in the room is the primary cause for Easterbrook's projection inaccuracy.

0 0

Printable Version  |  Link to this page

Comments

1  2  Next

Comments 1 to 50 out of 52:

  1. While I disagree with Don's projection, would it not be fairer to him to post his projections with error bars included? Once his projections leave the 95% confidence interval mark when compared to what we've seen so far, then we can say he is (almost certainly) wrong. Until then, he's only probably wrong.
    1 0
  2. Does anyone know what temperature dataset Easterbrook is using. It does not resemble anything I can envision. His projections start from a 2008 value of about +0.2C. Compare fig. 1 & 2 above with fig. 42 from the Easterbrook report. http://myweb.wwu.edu/dbunny/research/global/easterbrook_climate-cycle-evidence.pdf
    0 0
  3. jhudsy - as you can see in Figure 1, Easterbrook did not include error bars in his projections. The error bars in the surface temperature data are approximately +/- 0.05°C. Therefore, Easterbrook is already wrong by a large margin outside of the margin of error. Eric - as noted in the post, Easterbrook claims to have gotten the temp data in Figure 1 from one of the IPCC reports (TAR, I presume). Figure 42 in the paper you reference is unclear. The black line between 2000 and 2008 may be from UAH.
    0 0
  4. Hi Dana, I see you use GISTEMP and NASA GISS, what about HADCRUT, how do they compare? Does Don use a model or is he just plotting on a graph?
    0 0
  5. grayman @4, for the "cooling based on 1945-1977" prediction he appears to just append a smoothed version of one of the HadCRU global temperature indexes from 1945 to about 1995. He then appears to draw his own line to 2060, then appends the 1945-1995 line again. For the "cooling based on 1880-1915 prediction, he appears to use the same technique, but uses the HadCRU temp from 1880 to 1940. The last section (2090 onwards) appears to be free form in both cases. I believe this to be his procedure based on the similarity of the relevant curves rather than any stated procedure by Easterbrook.
    0 0
  6. Hi grayman. Although I used GISS in the graph, I actually used the Wood for Trees composite in the numerical analysis, which is the composite of GISTemp, HadCRUT, UAH, and RSS. I did that to avoid using a single particular data set. But there's not really much difference between GISTemp and HadCRUT, though the latter shows a bit less warming over the past decade. Easterbrook uses a "model" in the sense that any prediction must use a model. His model assumes that PDO, AMO and sunspots dominate global temperature change, and that future changes will be similar to past changes. But I don't think he's using any sort of computer model. His process appears to be much more crude.
    0 0
  7. Thanks Dana, As you know from me, how anybody can say this much temp(one way or the other) will be this i can not understand,as you are a more learned man than myself on this i can see some things better know, though i am still a skeptic i have been learning. sorry i did not get back to you on the Renewables post family matters came up. You know how that goes. I still have a few questions on renewables, will address them later.
    0 0
  8. Don is not very careful with accuracy. He often mentions the 1977-1998 warm period to be followed by the current cool period. yet on page 13 he refers to the 1977-2007 warm period. That is because the Mount Baker glaciers were still retreating rapidly. He also uses for Figure 20c and 21c images I took, not Jon Scurlock who is a great aerial photographer. Since he emailed me about using these images, he knows well where they came from. I have provided a more up to date look at Boulder Glacier and Easton Glacier
    0 0
  9. Ok, let's assume that he's using fuzzy data for temperatures. It is the 2000-2010 range that is causing me some concern. Figs. 1 and 2 do not appear to match, and neither seem to agree with the figure from his report (link above). His report seems to start his projection from 2008 and a temperature anomaly of ~0.2C. Your projections seem to start at 2001 and an anomaly of 0.4C. Did Easterbrook present an earlier version of this report to which you are referring?
    0 0
  10. Eric #9 - yes, as mentioned towards the beginning of the post, Figure 1 came from a presentation Easterbrook gave at the AGU conference in 2008, re-posted on WUWT. He had made very similar projections since 1998. Recently in the report you reference co-authored with D'Aleo, they revised the figure to include the very strange 2000-2008 temperature, probably from UAH. However, UAH has a different baseline than the the surface temperature dataset used up to 2000 (probably HadCRUT). I don't know how they spliced the two together, but there seems to be something shady going on there. Figures 1 and 2 in the post above do basically match, by the way, except we used GISTemp as opposed to whatever IPCC temperature data Easterbrook used up to 2000.
    0 0
  11. In the article you quote Don Easterbrook as saying "the 30-years of global cooling that we experienced from ~1945 to 1977. However, also likely are several other possibilities (1) the much deeper cooling that occurred during the 1880 to ~1915 cool period, (2) the still deeper cooling that took place from about 1790 to 1820 during the Dalton sunspot minimum, and (3) the drastic cooling that occurred from 1650 to 1700 during the Maunder sunspot minimum." My question is, why did he pick the start period for his ummm 'predictions'? Did he just conveniently skip all the years from 1977 to now? And how successful is his 'model' in hindcasting? How does he explain why it got so hot in recent years - or the overall rise in temperature of the entire past century? If his 'cycles' were merely 'cycles', why is the temperature not yet back to, say, that of 1700? Just when does he expect the whole 'cycle' to complete? A lot of questions, I know. I don't expect him to answer any of them :D
    0 0
  12. sout - as you can see in Figure 1, Easterbrook calls 1977-2000 a "warm period" (which basically means positive PDO). He doesn't really have a model, so it can't be tested with hindcasting. As I noted in comment #6, Easterbrook's projections are much more crude than real computer models. He also doesn't really explain the long-term trend. I suspect he would say that the "warm periods" have just been warmer on average than the "cool periods" have been cool. And he might say that on average, solar activity is higher now than a few centuries ago, which is true (though it can't explan very much of the recent warming).
    0 0
  13. In other words, his temperature reconstruction (or whatever you want to call it) is suspect from 2000-2008. His projections do not start until then, and call for cooling between 0.4 and 1.1C by 2040. That would be significant.
    0 0
  14. Well, his revised temperature projection starts in 2008. However, his initial temperature projection began in 2000, and called for between very dramatic cooling and very slight warming by 2100 (Figure 1).
    0 0
  15. From the WUWT article: "The sun’s recent behavior suggests we are likely heading for a deeper global cooling than the 1945-1977 cool period and ought to be looking ahead to cope with it." "The good news is that global warming (i.e., the 1977-1998 warming) is over and atmospheric CO2 is not a vital issue." I love the way "skeptics" are quick to make categorical claims, and then just don't care about how their predictions turned out. Truly unshakeable beliefs. Even reality cannot affect them.
    0 0
  16. 15, Alexandre, I've said it before and I'll say it again. The day is going to come when the history of all of this is written, and certain weathermen, creationists, tobacco-scientists, retired geologists, British "lords" and many others are going to be the laughingstocks of the scientific world, and also suffer the anger of a rather disappointed (but ultimately culpable) public who will feel that they were grossly mislead (and will steadfastly feel that they were mislead, and it wasn't their own lazy recalcitrance that lead to their ignorance, and everyone's dilemma).
    0 0
  17. Sphaerica - to be honest, part of the motivation behind this series was to get the 'skeptic' predictions 'on the record' and hold them accountable for their inaccuracy thus far. Though frankly at this point I'm more interested in looking at the good predictions, by the non-'skeptics'.
    0 0
  18. Dana "To be a good scientist you do not have to be right, the important thing is that you have reached your conclusions by sound reasoning with the concepts and observations available at the time you made them" (A.O. Persson). I think it will be interesting to also look at wrong predictions by good scientists and understand why they failed.
    0 0
  19. Riccardo where does the sound reasoning apply in this case. To look at sound reasoning based on observations from many scientists look at the BAMS State of the Climate 2010 that just came out. As one of the chapter authors (alpine glacier and ice sheets) I can tell you the editorial process is thorough.
    0 0
  20. So, starting in 2007, we have the Easterbrook prediction of -0.4C by the year 2035, and the IPCC prediction of +1.2C by 2038. Let the race begin.
    0 0
  21. Sphaerica: Does anyone remember the tobacco-scientists? (Or at least, would they be remembered if not for the fact that some have shifted to the climate debate?) On past experience I think it unlikely anyone will care much about the ringleaders of the stupidity of previous decades, either to be angry or to laugh at them. More likely they'll just get old and drop out of the limelight. And people don't become intellectually more flexible with age, so I suspect most of their followers will go the same way.
    0 0
  22. mspelto absolutely, no sound reasoning here. What I wanted to say is that wrong predictions, maybe made some decades ago, by good scientists (emph. on good) are interesting and may teach us something. Thank you very much for alerting us on the release of the State of the Cimate 2010.
    0 0
  23. #20 Eric, you'd love for it to be a 24 year test beginning now, wouldn't you? But fortunately, we already have over a century's worth of observations, and the attributions have been done to quantify the relative contributions of different forcing agents, as can be found elsewhere on this site. Given the result - somewhere between 2-4.5C rise and associated climate disruption caused by the dominant forcing of CO2, we don't need to wait for another generation in order to form policy. Phew!
    0 0
  24. sky, I think the winner be determined long before the 24 years is over. Don't you?
    0 0
  25. Eric, given how wrong Easterbrook has been since 2000 I'd say 'the winner' (aka reality) already has been determined.
    0 0
  26. CB, Since 2000, Easterbrook has been low by about the same amount that Hansen has been high. Are they both wrong?
    0 0
  27. Seeing as there is no alternative theory to the well tested, verified, physically solid theory of climate that represents the state of the science, the 'winner' is already in the bag. Losers will be ones who believe in fake numerology and hopecasting that has no basis in physics, like Easterbrook's projections.
    0 0
  28. Eric the Red One difference would be that the behaviour of ENSO over that period would mean that one would expect the observations to be below Hansen's projection, as it would tend to partially mask the forced warming. The flip side of that is that it makes Easterbrook's projection appear even worse. However, if you want to ask whether they are wrong, you need to look at the error bars on the projections. Hansens projections match up to the observations fairly well if you take into account the uncertaintes in the model output and the observations.
    0 0
  29. Dikran, Considering that ENSO was largely in positive, El Nino territory up until the end of 2007, followed by the negative La Nina for two years, and then an El Nino in 2010, it looks as if ENSO would favor warming until the 2011 La Nina. http://www.esrl.noaa.gov/psd/enso/mei/ Are there significant differences in Hansen's error bars compared to Easterbrook's. Easterbrook appears as if he just copied and pasted past temperature changes into the future.
    0 0
  30. Eric, a fairer comparison would be to compare Hansen's projections (which is an estimate of only the forced response of the climate without natural variability) with ENSO-adjusted temperatures (which give a better indication of the forced response by attenuating a major component of the unforced response). E.g.: If you do that, you will find that Hansens projections appear better and Easterbrooks rather worse, as I suggested. IIRC Easterbrook produces his projections in exactly that manner. Using such a daft way of making the projection should give pause for thought to anyone taking him seriously. His basic prediction is basically that there will be some unspecified cooling, but he makes that rather vague and unsubstantiated prediction look more scientific than it is by drawing some scientific looking plots. Sadly in doing so, he gives a hostage to fortune and voila his projections are demonstrated to be wrong. It would have been better if he had simply hand drawn his projection (c.f. the famous Lamb medieval warm period plot used in the first IPCC WG1 report).
    0 0
  31. Reading the last para on using stats... I'm reminded of hearing a talk from a meteorologist on early weather prediction methods. They were entirely statistics based - and completely rubbish. The history of meteorology has been all about understanding the mechanisms better, leading to increasingly accurate forecasts. I wonder if anyone out there could do a little comparative history? Relying on Easterbrook's methods would be like going back to statistics-based meteorology for predicting the weather. (i.e. it doesn't work...)
    0 0
  32. Riccardo - I agree. When I say "good projections", I mean projections which are based on sound physics, not projections which are necessarily spot-on. We'll be looking at some projections from studies in the 1970s which may not be perfect, but which we can learn from, because unlike Easterbrook's, they were based on sound physics. Eric - I'm pretty sure Hansen's Scenario B projection (made in 1988) was closer to reality in 2010 than Easterbrook's projections (first made around 2000). But it's true that Hansen was "wrong" in the sense that his climate model was too sensitive. Had his model sensitivity been about 3.4°C as opposed to 4.2°C for 2xCO2, he would have been "right". You can't say that for Easterbrook - his fundamental approach is wrong.
    0 0
  33. Eric: We need to start Easterbrook at his 2000 prediction. Why do you give him tie first eight years when he has been wrong for free?? If you always choose the most optomsitic prediction, and then let them correct it when they are wrong, it will always look OK.
    0 0
  34. michael, I was following the links, and using the projections in the report referenced - 2008. Going back to the older projections, he projected ~0.15C temperature decline from 2000-2010 (based on eyeballing figure 3). The 60-month moving average from CRU has fallen 0.05C since then, while GISS has increased by a similar value. When making comparison, it is nice to compare apples to apples.
    0 0
  35. Eric - this 'apples to apples' comparison is what was done in the post.
    "Between 2000 and 2010, Easterbrook's 1945-1977 scenario (which we call "Easterbrook A") projected a cooling of approximately 0.19°C, versus a cooling of 0.38°C over this period in his 1880-1915 scenario (Easterbrook B). The observed temperature change from 2000 to 2010, on the other hand, is approximately 0.12°C warming, according to the Wood for Trees Temperature Index, which is the average of the four main temperature data sets (HadCRUT3, GISTemp, RSS, and UAH)....In short, over the first decade of his global cooling projections, Easterbrook has already been wrong by between 0.3 and 0.5°C."
    0 0
  36. #23 skywatcher What observations are you referring to? The UAH satellite record is showing +0.2C per decade since 1980. How is 2-4.5C rise related to current observations? And what exactly are you talking about with the term "climate disruption"?
    0 0
  37. #36: climate sensitivity to doubled CO2, I wasn't entirely clear about that. So far we have most of about 0.8C due to a 35% CO2 rise, with more in the pipeline, so well in that ballpark for 2-4.5C rise. More info at Climate sensitivity is low. More info about climate disruption at Jef Masters' recent post - extremes of heat (high temperatures), drought (more evaporation) and flood (more available water vapour) appear to be increasing as predicted, and all this after relatively modest warming of 0.7C to present. I'd call that disruption when it causes food (wheat) prices to spike, as well as the obvious damage caused, and it's only expected to get worse with continued warming.
    0 0
  38. This article of Easterbrook is similar to this chinese article Periodic oscillations in millennial global mean temperature and their causes in which they just keep combining solar cycles and some marine influences untill they find a more or less good fit for the temperatures the last 1000 years. Of course by adding enough cyclic events you can fit any curve (probably in 2030 they will publish an article with maybe 20 cycles to fit the temperatures) but the link between correlation and causality becomes unexisting.
    0 0
  39. #37 skywatcher How do you separate warming from natural climate variability and CO2 rise? How do you know that most of the warming is from CO2 rise? I still think that climate sensitivity is lower than model predictions, based on current observations. I'm reading Jeff Masters post, an interesting collection of weather events. Snowmageddon? Negative AO and El Nino. The moisture plume for the Feb. 6, 2010, storm stretched from the eastern Pacific, all the way up the U.S. east coast. And from what I read, the 2010 Russian drought was an episode of atmospheric blocking, all within the realm of natural climate variability. What about the tornado outbreaks this spring, was all that from global warming too?
    0 0
  40. thepoodlebites - "How do you separate warming from natural climate variability and CO2 rise?" See the post and references here. The rest of your post belongs on the Extreme weather thread; it's off topic in this one.
    0 0
  41. poodle #39 - current observations are consistent with a sensitivity of 3°C for 2xCO2. If you use the IPCC range of transient climate sensitivity values, CO2 alone has caused 0.5 to 1.5°C warming so far, most likely 1°C - more than observed due to aerosols and other cooling effects offsetting some of that warming. That physics is how we know CO2 is causing the warming, aside from the anthropogenic warming 'fingerprints'.
    0 0
  42. #40 KR So you are using model predictions to prove that the observed warming is mostly from CO2 rise? And I'll move to the extreme weather thread but let us remember that weather is not the same as climate, and single events are not the same as trends.
    0 0
  43. thepoodlebites - I have replied on the far more appropriate How do we know more CO2 is causing warming thread. Please leave this thread for discussions of previous climate predictions and how they have worked out.
    0 0
  44. Hi Dana, This may have been addressed, but going by Easterbrook's "predictions" it is not clear to em what he thinks climate sensitivity to doubling CO2 is. From what I can gather they suggest that sensitivity is very close to zero, in which case that would be ludicrous.
    0 0
  45. Albatross: Well, yes. Check out this paper from his home page: http://myweb.wwu.edu/dbunny/research/global/CO2_atmospheric-carbon-dioxide.pdf
    0 0
  46. stefaan: Yes, you can add more and more cycles, sub-cycles, and epi-cycles until your simulation provides quite an accurate reproduction of past behaviour. Such models almost invariably fail the prediction test - which I believe was one of the key reasons for the downfall of the geocentric model of the solar system - as time went by, more and more sub-cycles were needed to account for the variance between model and reality, until the whole house of cards collapsed, to be replaced by the heliocentric model which was described by a few (relatively) simple equations, and which allows fairly accurate prediction centuries into the future. I think the term 'house of cards' is accurate in that example, as it was all based on, and completely relied on, one fundamental assumption, that the Earth was the centre of the universe. Observation showed that fundamental assumption was incorrect, and additional complexities were added in to the model (with no basis in physical science whatsoever) in order to account for that error. In the climate science field, however, there are multiple foundations (e.g. CO2 absorption spectra, black body radiation, conservation of energy) which are so thoroughly tested by experiment and observation that it would be very improbable for any of them to be overturned at this point in time. Tamino has a good post covering another 'skeptic' prediction that turned out to be not-so-good - this time from the 2009 NIPCC report regarding arctic sea ice. The last graph is a cracker - especially when you consider most of that data was available at the time the NIPCC report was written!
    0 0
  47. Dhogaza @45, Thanks for that link. Oh dear, that document does not do Easterbrook any credit at all. He even invokes the "in the past temperature lead CO2 so there is nothing to worry about" myth, the "it has cooled since 1998" myth, the "CO2 comprises a tiny fraction of the atmosphere so is not a big player" myth. Easterbrook also makes this claim: "The greenhouse effect of CO2 decreases exponentially, so the rise in atmospheric CO2 from about 0.030% in 1950 to .038% in 2008 could have caused warming of only about 0.1° C." Maybe Dana will chime in at this point. Dana?
    0 0
  48. Albatross - from these projections it's unclear what Easterbrook thinks about climate sensitivity, since he completely neglects CO2. Of course, the fact that he neglects CO2 does suggest that he thinks climate sensitivity to it must be near zero. From dhogaza's link, if Easterbrook thinks an increase from 300 to 380 ppm should have caused 0.1°C warming, he thinks sensitivity to doubled CO2 is 0.3°C. This is indeed ludicrously low, even more extreme than Lindzen, Spencer, and Christy.
    0 0
  49. Thanks Dana. I suspected as much, but 0.3 C?! Good grief. Now figure this. He claims climate sensitivity is low, well practically non-existent in fact. But then look at the huge decadal-scale perturbations in global temperatures in his graphs that he attributes to solar and, worse yet, internal climate modes. Said perturbations are greater in amplitude (> ~0.5 C) than anything observed in the global SAT record since 1850. Yet at the same time he would have us believe that the climate system is insensitive to selected external forcings such as CO2. This is junk science (by deniers of AGW) at its best.
    0 0
  50. Yes, any projection which completely neglects physics the way Easterbrook has done can accurately be described as 'junk science'.
    0 0

1  2  Next

You need to be logged in to post a comment. Login via the left margin or if you're new, register here.


The Consensus Project Website

THE ESCALATOR

(free to republish)


© Copyright 2024 John Cook
Home | Translations | About Us | Privacy | Contact Us