What The Science Says:
Hocker is claiming that his model shows that the long-term upward trend in CO2 is explained by temperature, when his methods actually removed the long-term trend. In today's world, the greatly increased partial pressure of CO2 from fossil fuel emissions causes a flux of CO2 from the atmosphere to the oceans. Observations show the oceans are a "sink" rather than a source of CO2 in the atmosphere
Climate Myth: Warming causes CO2 rise
'Differentiating the CO2 measurements over the last thirty years produces a pattern that matches the temperature anomaly measured by satellites in extreme detail. That this correlation includes El Niño years, and shows that the temperature rise is causing the rise in CO2, rather than the other way around.' (Lon Hocker)
A new article by Lon Hocker at the website "Watts Up With That?" examines the relationship between global temperature and CO2 over the last three decades. The article's conclusion is concisely summarised in its title: The temperature rise has caused the CO2 increase, not the other way around. This conclusion would be rather startling if it were true, since the scientific consensus is that CO2 is currently acting as a "forcing" that warms the climate. How does Hocker reach this conclusion, and is it reasonable?
The data used in Hocker's analysis are monthly atmospheric CO2 measurements at Mauna Loa (obtained from NOAA) and satellite-measured temperature data for the lower troposphere (from UAH, apparently using a subset of the global data over the oceans only). The temperature data are recorded as anomalies, or differences between the actual temperature and the long-term mean.
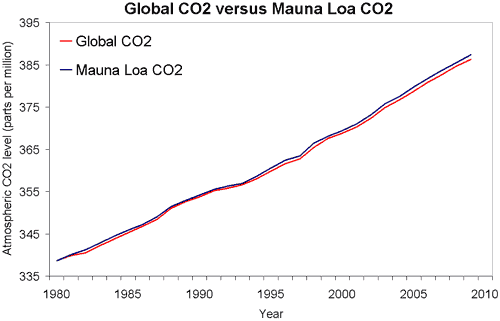
The Mauna Loa CO2 data show a long-term increase in atmospheric CO2 concentration. The Mauna Loa data are the longest high-quality CO2 record, dating back to 1958. While one might think that the side of a volcano might not be the best place to measure CO2, in fact the procedures used at Mauna Loa compensate for any contamination by volcanic gases. As shown in Figure 1, since 1980 we have had global CO2 data from a network of stations, and these data show that the Mauna Loa trend is very representative of the global trend in CO2.

Figure 1: Global atmospheric CO2 (NOAA) versus Mauna Loa CO2 (NOAA).
Hocker begins his analysis by calculating the first derivative of the CO2 data. He does this using the difference between the CO2 measurement six months after a given month and the measurement six months before. (Calculating this difference over a 12-month interval effectively removes the seasonal variation in atmospheric CO2 concentration.)
At this point, alert readers may begin to glimpse the flaw in Hocker's methods. However, let's follow Hocker through to his conclusion.
He derives a simple model to estimate the temperature anomaly as a function of the derivative of CO2 concentration:
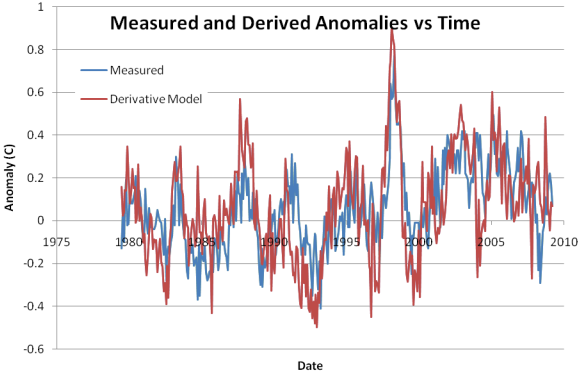
Hocker's Figure 2 shows a comparison of the observed and modeled global ocean temperature anomaly:

Figure 2. Comparison of global lower troposphere temperature anomaly over the oceans (blue line) to a model based on the first derivative of atmospheric CO2 concentration at Mauna Loa (red line). From Hocker 2010.
Looking at this figure, Hocker notes "There is a strong correlation between the measured anomaly and the Derivative model. It shows the strong El Niño of 1997-1998 very clearly, and also shows the other El Niño events during the plotted time period about as well as the satellite data does." He does not quantify the correlation between the two, but the squared correlation coefficient (r2) for the two time series is 0.36.
Let's pause here to consider the actual effect of Hocker's methods to this point. Taking the first derivative of the CO2 data removes the long-term trend in CO2 concentration, and shows the effect of short-term variability around that trend. Thus, it would be appropriate to conclude from this that short-term fluctuations in the overall upward CO2 trend are moderately well correlated with temperatures in the lower troposphere over oceans.
What Hocker actually concludes is quite different: "Using two well accepted data sets, a simple model can be used to show that the rise in CO2 is a result of the temperature anomaly, not the other way around. This is the exact opposite of the IPCC model that claims that rising CO2 causes the temperature anomaly."
In other words, Hocker is claiming that his model shows that the long-term upward trend in CO2 is explained by temperature, when his methods actually removed the long-term trend.
This is where the previously-mentioned alert readers will be nodding their heads and saying "Yes! We knew it!" The error that Hocker makes - taking the derivative of a time series to remove its long-term trend, then correlating a second data set with this derivative, and finally claiming the second data set explains the long-term trend - is exactly the same error that was recently discovered in a prominent "skeptical" paper by McLean 2009. McLean correlated an index of the El Niño/Southern Oscillation with the first derivative of temperature, while Hocker correlates temperature with the first derivative of CO2 concentration. Perhaps if Hocker were an avid reader of Skeptical Science, he would have been familiar with this error in McLean's analysis and would have avoided repeating it!
What else can be said about this subject? Well, it is true that the solubility of CO2 in seawater is a function of temperature, and all else being equal, as the ocean warms it will give off CO2 to the atmosphere. And in fact this is the mechanism by which a CO2 feedback amplified the temperature swings during the Pleistocene glacial/interglacial cycles. But in today's world, the greatly increased partial pressure of CO2 from fossil fuel emissions causes a flux of CO2 from the atmosphere to the oceans. This is known from decades of oceanographic surveys that show the oceans are a "sink" rather than a source of CO2 in the atmosphere (Takahashi 2009, Sabine 2004).
It's also interesting to note that climate scientists have known for at least three decades that short-term fluctuations in temperature (e.g., those associated with the ENSO cycle) are correlated with short-term fluctuations in the rate of increase of atmospheric CO2 (Bacastow and Keeling 1981). Section 7.3.2.4 of the IPCC AR4 Working Group 1 report discusses this in some detail.
Intermediate rebuttal written by ned
Update July 2015:
Here is a related lecture-video from Denial101x - Making Sense of Climate Science Denial
 |
The Skeptical Science website by Skeptical Science is licensed under a Creative Commons Attribution 3.0 Unported License. |