What The Science Says:
Economic assessments of proposed policy to put a price on carbon emissions are in widespread agreement that the net economic impact will be minor. The costs over the next several decades center around $100 per average family, or about 75 cents per person per week, and a GDP reduction of less than 1%. Moreover, the benefits outweigh the costs several times over, as real-world examples illustrate.
Climate Myth: CO2 limits will harm the economy
"Legally mandated measures for reducing greenhouse gas emissions are likely to have significant adverse impacts on GDP growth of developing countries [...] This in turn will have serious implications for our poverty alleviation programs." (Pradipto Ghosh)
Putting a price on carbon emissions is often discussed as one of the main solutions to anthropogenic global warming. Carbon dioxide is a pollutant and in economic theory, pollution is considered a negative externality – a negative effect on a party not directly involved in a transaction, which results in a market failure. The Stern Review on the Economics of Climate Change concluded that climate change represents "the greatest example of market failure we have ever seen."
Despite the economic benefits of addressing this market failure, many contrarians argue that putting a price on carbon emissions will cripple the economy. Such arguments generally focus solely on the costs associated with pricing carbon while wholly ignoring the benefits. For example, a Heritage Foundation analysis of the Waxman-Markey climate bill proposed in the US House of Representatives in 2009 concluded that the legislation would cost the average American family $1500 per year – a figure 10 times higher than any non-partisan economic analysis (see below).
The reason the Heritage estimate was so high is that it evaluated the costs of a carbon cap, and then ignored the distribution of those funds. When a price is put on carbon emissions, it creates a revenue stream. The funds which are generated from the carbon price can be distributed in any number of ways – usually through reductions in other taxes, investment in research and development of 'green' technologies, funding of energy efficiency programs, etc.
The Heritage Foundation report effectively assumed that the generated funds would disappear into a black hole. Their analysis was the equivalent of doing your household finances by adding up your expenditures while ignoring your income. It sure looks bad, but tells you nothing about your overall finances.
Here we will look at a few of the climate bills proposed by the US Congress which would have put a price on carbon emissions, and examine a number of economic analyses mainly by non-partisan economic groups which evaluated both the costs and benefits of each proposal.
Senators Lieberman and McCain introduced the Climate Stewardship and Innovation Act of 2007. This bill would have capped greenhouse gas (GHG) emissions at 22% below their 1990 levels in the year 2030, and 60% below 1990 levels in 2050. The Energy Information Administration (EIA) analyzed this bill using the National Energy Modeling System (NEMS), and the US Environmental Protection Agency (EPA) analyzed the bill as well.
Senators Lieberman and Warner introduced the Climate Security Act of 2008. The bill called for a steadily-declining GHG cap, reaching 15% below 2005 levels by the year 2020 and 70% below 2005 levels by 2050. It was analyzed by the EPA using results from two economic forecasting models: the ADAGE model developed at Research Triangle Institute (RTI) in North Carolina; and the IGEM model run by a consulting firm founded by Dale Jorgenson, a professor at Harvard. The Massachusetts Institute of Technology (MIT) analyzed this bill using their Emissions Prediction and Policy Analysis (EPPA) model, and the EIA and Congressional Budget Office (CBO) also analyzed the bill.
Congressmen Waxman and Markey introduced the American Clean Energy and Security Act of 2009. This bill would have reduced greenhouse gas emissions 17% below 2005 levels by 2020 and 83% by 2050. It was analyzed by the CBO, EPA, EIA, and Science Applications International Corporation (SAIC).
Senators Kerry and Lieberman introduced the Clean Energy Jobs and American Power Act. This bill would have reduced greenhouse gas emissions 17% below 2005 levels by 2020 and 83% by 2050. It was analyzed by the Peterson Institute, EPA, EIA.
Research groups (MIT, RTI, and the Department of Energy's Pacific Northwest National Laboratories [PNNL]) have also analyzed the economic impacts of a generic comprehensive, economy-wide climate policy to reduce GHG emissions 50-80% by the year 2050.
An analysis done by Google.org using McKinsey & Company's US Low Carbon Economics Tool evaluated the economic impact of various scenarios involving strong investment in green technologies, 'clean policy', and/or a price on carbon emissions from the power sector of $30 per ton.
These studies compare a particular climate policy scenario with a reference scenario corresponding to the model projection of business as usual (BAU) – that is, a world in which the economy continues on its current course with carbon emissions unchecked. All assume that a climate policy would be implemented in the year 2012, and most project economic impacts through the year 2050. The analyses evaluate the costs of reducing greenhouse gas emissions, but do not measure the resulting payoff – the benefits of averting dangerous climate change. Nor do they consider the ancillary benefits, such as the improved local air quality and reduced ocean acidification.
They merely model the economic impact of the climate policy to a BAU scenario where climate change does not impact the economy. Therefore, it is important to bear in mind that these analyses overestimate the policy impact on the economy as compared to a realistic BAU scenario in which climate change impacts the economy. These analyses should be viewed as a comparison between policy impacts and a scenario in which our understanding of the climate is wrong and the climate does not change significantly as GHG emissions continue to rise.
Since it is difficult to predict how much climate change will impact the economy, or how much climate change will be averted as a result of these policies (particularly since they may trigger similar GHG emission reduction policies by other countries), the comparison to an unrealistic BAU scenario is the best we can do.
The majority of these analyses find that the evaluated climate policies impact the US GDP by less than 1% as compared to BAU. The main exception is the IGEM analysis, which finds a 2.15% reduction in GDP for the Lieberman-Warner by bill by 2030, and a 3.59% reduction by 2050. The IGEM model is an outlier because it assumes when the price of energy (and other goods and services) rises, people will respond by choosing to work less than they otherwise would (EDF 2008). This is a counter-intuitive and illogical assumption, since increasing costs generally result in people working more to increase income correspondingly.
Another outlier was the SAIC analysis of Waxman-Markey, which was funded by the National Association of Manufacturers, which has strongly opposed climate legislation. The study incorporated some unrealistically conservative and pessimistic assumptions, for example that American companies will be unable to deploy clean energy and energy efficiency technologies in a timely manner. Nevertheless, the report concluded that by 2030, GDP would grow 95% as much under Waxman-Markey as compared to BAU.
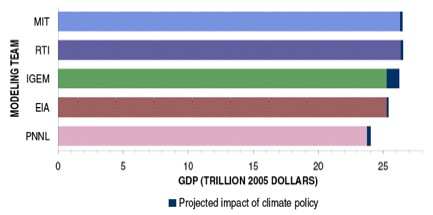
The MIT analysis in the generic 80% GHG emissions reductions below 1990 levels below 2050 (the scenario with the largest GHG emissions decrease) found that by 2030, GDP would increase by just 0.44% as compared to BAU.
Figure 1 and Table 1: Modeled Impacts of Climate Legislation on US GDP
| Legislation | GHG Reduction by 2050 | GDP loss vs. BAU by 2030 |
| Lieberman-McCain | 60% below 1990 levels | 0.23% |
| Lieberman-Warner | 70% below 2005 levels | 0.44-2.15% |
| Waxman-Markey | 83% below 2005 levels | 0.2-0.9% |
| Kerry-Lieberman | 83% below 2005 levels | 0.1-1.0% |
| Generic | 50% below 1990 levels | 0.47-0.81% |
| Generic | 80% below 1990 levels | 0.44% |
The Google.org analysis found that investment in green tech and carbon pricing would actually dramatically increase GDP. In fact, the study found that delaying significant investment in green tech by 5 years could cost the USA $2.3 to $3.2 trillion in GDP (Figure 2).
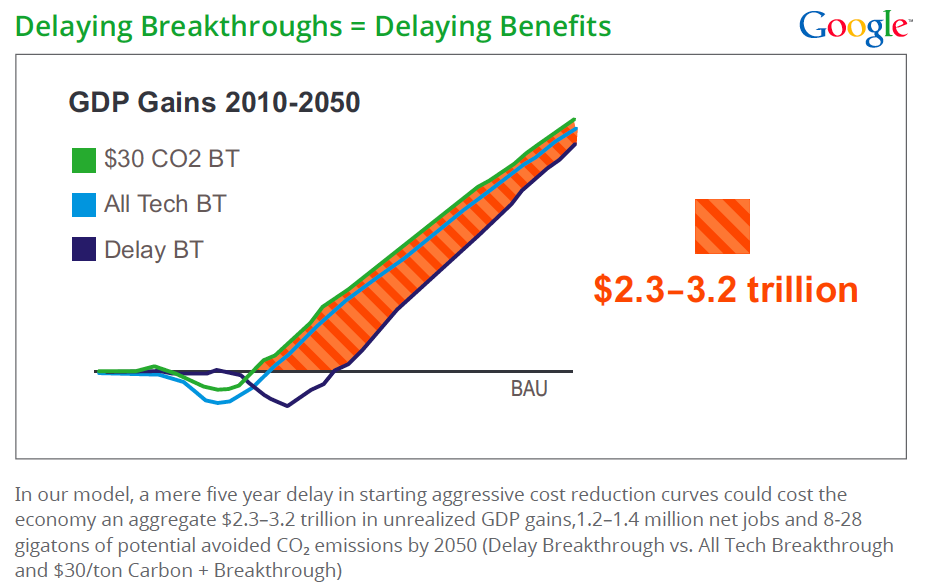
Figure 2: US GDP gains between 2010 and 2050 in three scenarios. The green scenario includes a $30 per ton price on utility sector CO2 emissions and strong investment in green tech to develop "breakthroughs" (BTs). the blue line depicts a scenario in which there is heavy investment in green tech without a carbon price. The purple line is a 5 year delay before significant investment in green tech. The red and orange area depicts the difference in GDP growth: $2.3 to 3.2 trillion lost in the 5 year delay scenario. Source: Google.org study
The CBO analysis of Waxman-Markey found that the bill would reduce the federal deficit by $9 billion by the year 2019. The CBO analysis of a similar bill proposed by Senators Kerry and Boxer found the bill would reduce the federal deficit by $21 billion by 2019 and "would not increase the deficit in any of the four 10-year periods following 2019." And the CBO also found that Kerry-Lieberman would decrease the deficit by $19 billion by 2020.
In the MIT analysis of Lieberman-Warner, the United States would spend $20 billion less on foreign oil in the year 2020, and $81 billion less in 2030. The Google.org analysis found that US reliance on petroleum products would decrease by nearly 50% by 2050 if we invest strongly in green tech and implement a carbon pricing system.
The EIA study of Lieberman-Warner found that the bill would add 42 cents per gallon to gas prices in 2030 as compared to BAU (a 12% increase). Analyses of Waxman-Markey found that it would increase gas prices 22 to 35 cents per gallon by 2030 (6 to 9%). The Peterson Institute analysis of Kerry-Lieberman found it would increase gas prices by approximately 10 cents per gallon (3%) by 2030.
Analyses of Waxman-Markey found that its impacts on monthly utility bills by 2030 ranged from a $5.60 decrease to a $2.80 increase. The Peterson Institute analysis of Kerry-Lieberman found that by 2030, monthly utility bills would range between a $0.67 decrease and a $2.62 increase.
The potential decrease in monthly electric bills is due to the energy efficiency programs established through the bill's provisions. Though energy prices are expected to increase modestly, energy consumption is expected to counteract these increases as households take advantage of these energy efficiency programs.
The Google.org study found that through electric car breakthroughs as a result of investment in green tech and carbon pricing, household energy bills (electric plus transportation fuel) would decrease 53% by 2050, by approximately $950 per year.
The analyses of Waxman-Markey concluded that the bill would cost the average American household between $84 and $160 per year by 2020, which corresponds to $0.67 to $1.28 per person per week. The majority of the increase comes through increased gasoline costs. The studies also concluded that the costs would be lower for lower income families. For example, the CBO analysis of Waxman-Markey concluded that families in the lowest income quintile would see a net decrease in average annual costs of about $125 in 2020 due to low-income assistance provisions (CBPP 2009).
Over the entire span of the Waxman-Markey bill (to 2050), EPA found the average annual cost would be $80 to $110 per household in current dollars (64 to 88 cents per person per week).
Although most economic analyses of these policy proposals only estimated the costs, a study by the New York University School of Law's Institute for Policy Integrity (IPI) also evaluated the benefits of Waxman-Markey by using a range of possible values for the social cost of carbon (SCC). SCC is effectively an estimate of the direct effects of carbon emissions on the economy, and takes into consideration such factors as net agricultural productivity loss, human health effects, property damages from sea level rise, and changes in ecosystem services. It is a difficult number to estimate, but is key to any cost-benefit analysis of climate legislation. Figure 2 from the IPI study illustrates how the direct benefits of Waxman-Markey compare to the costs for two economic models (ADAGE and IGEM) in relation to SCC in Figure 1.
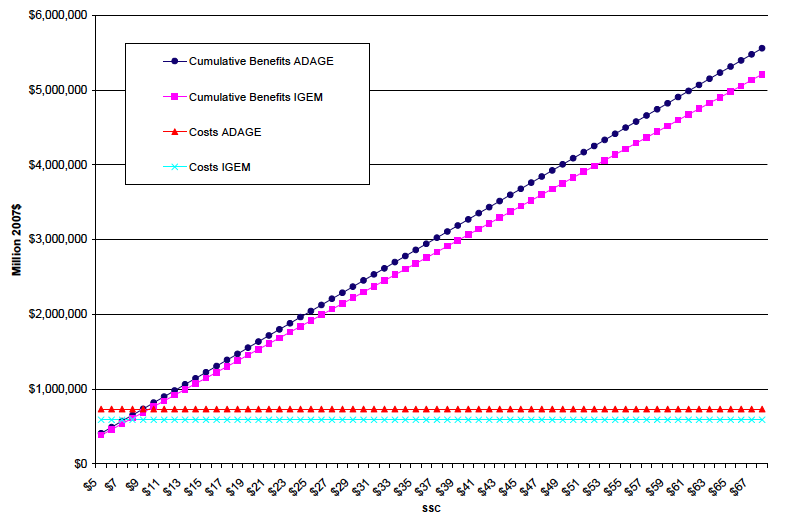
Figure 3: Costs (light blue and red points) and Benefits (dark blue and purple points) vs. SCC values ($ per ton of carbon dioxide) for H.R. 2454 using two economic models (ADAGE and IGEM)
As you can see in Figure 3, for an SCC of just $9 per ton of carbon dioxide, the direct benefits of H.R. 2454 match the costs. Estimated SCC values generally range from $19 to $68; therefore, IPI concludes that the direct benefits of Waxman-Markey outweigh the costs by a factor of 2 to 8, and would result in a net savings of at least $1 trillion by 2050. This neglects indirect benefits such as a reduction in co-pollutants and ocean acidification, and is thus a very conservative estimate.
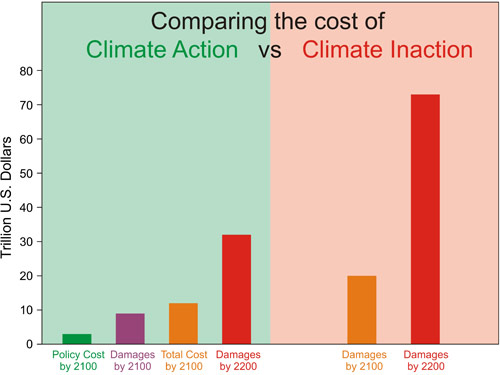
Figure 4: Approximate costs of climate action (green) and inaction (red) in 2100 and 2200. Sources: German Institute for Economic Research and Watkiss et al. 2005
In short, relative to the alternative (inaction and trying to adapt to the damaging consequnces of climate change), CO2 limits will help the economy. This is why there is a consensus among economists with expertise in climate that we should put a price on carbon emissions (Figure 5).
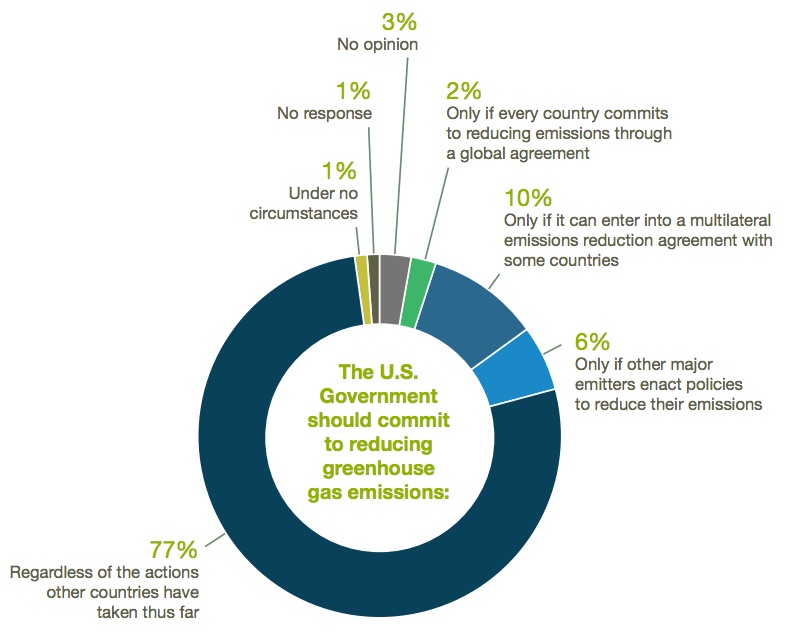
Figure 5: 2015 New York University survey results of economists with climate expertise when asked under what circumstances the USA should reduce its emissions
William Nordhaus is one of the foremost experts on climate economics. His research has frequently been misrepresented by climate "skeptics" (i.e. see here and here) to argue that CO2 limits will harm the economy. In February 2012, Nordhaus sought to set the record straight that the climate economics literature clearly indicates that CO2 limits will save money.
"My research shows that there are indeed substantial net benefits from acting now rather than waiting fifty years. A look at Table 5-1 in my study A Question of Balance (2008) shows that the cost of waiting fifty years to begin reducing CO2 emissions is $2.3 trillion in 2005 prices. If we bring that number to today’s economy and prices, the loss from waiting is $4.1 trillion. Wars have been started over smaller sums.
My study is just one of many economic studies showing that economic efficiency would point to the need to reduce CO2 and other greenhouse gas emissions right now, and not to wait for a half-century. Waiting is not only economically costly, but will also make the transition much more costly when it eventually takes place. Current economic studies also suggest that the most efficient policy is to raise the cost of CO2 emissions substantially, either through cap-and-trade or carbon taxes, to provide appropriate incentives for businesses and households to move to low-carbon activities."
[...]
"The claim that cap-and-trade legislation or carbon taxes would be ruinous or disastrous to our societies does not stand up to serious economic analysis. We need to approach the issues with a cool head and a warm heart. And with respect for sound logic and good science."
Ten northeastern states in the USA (Connecticut, Delaware, Maine, Maryland, Massachusetts, New Hampshire, New Jersey, New York, Rhode Island, and Vermont) implemented a carbon cap and trade system which will reduce their CO2 emissions from the power sector by 10% by 2018 in the Regional Greenhouse Gas Initiative (RGGI). The RGGI recently commissioned a study to examine the impacts of the system, and the results give us a real-world example which is broadly consistent with the economic study predictions of benefits outweighing costs.
The study found that by investing carbon funds in energy efficiency and renewable energy programs, the states achieved $3–4 savings for every dollar invested. The program also created thousands of jobs (18,000 job years – that is, the equivalent of 18,000 full-time jobs that last one year), and individuals and businesses who took advantage of the energy efficiency programs funded by the carbon pricing system actually saw their energy bills drop.
A subsequent study found that the RGGI carbon cap pricing system added $1.6 billion in value to the economies of participating states, set the stage for $1.1 billion in ratepayer savings, and created 16,000 jobs in its first three years of implementation. RGGI provides us with a real-world example of carbon pricing benefits exceeding the costs several times over.
A number of economic studies have also shown that the lack of adequate limits on air pollution (including CO2) results in what are known as "externalities" - costs which are paid indirectly (i.e. higher health care costs due to air pollution), but are not reflected in the market price of the product creating those external costs. Economists view this as a failing of the free market which should be rectified through an emissions pricing system. Two studies, Epstein et al. 2011 and Muller, Mendelsohn, and Norhaus 2011 (MMN11) estimated the external costs of coal power compared to its market price, and found that its emissions are under-regulated, and the US economy would benefit from an emissions pricing system (Figure 4).
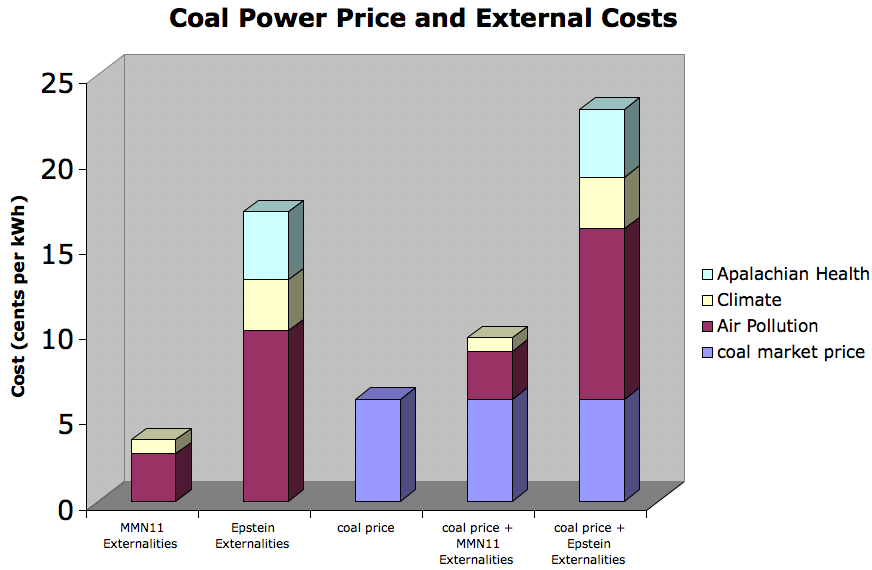
Figure 6: Average US coal electricity price vs. MMN11 and Epstein 2001 best estimate coal external costs.
To summarize, most of these economic analyses agree that a carbon pricing policy will reduce US GDP by less than 1% over the next 10–40 years as compared to an unrealistically optimistic BAU scenario in which climate change does not impact the economy. The analyses also concluded that the evaluated policies would reduce the federal deficit. Gas prices would rise somewhere between 3% and 12% over the next 20 years compared to BAU. Although energy prices would rise modestly, energy costs would be offset through increased efficiency. Total household costs would rise somewhere in the ballpark of 75 cents per person per week. Studies which conclude costs will be significantly higher either make unrealistic assumptions or only consider half of the picture.
In addition, energy independence and air quality would be improved. The reduction in GHG emissions would be a major step toward addressing both climate change and ocean acidification, although these beneficial impacts were not included in these economic analyses.
In short, even when compared to the perfect world where climate change has no impact on the economy, carbon pricing would have a very minimal economic impact, and would have several ancillary benefits. Compared to the real world in which unchecked increasing GHG emissions will certainly lead to numerous adverse economic impacts, putting a price on carbon emissions to reduce those impacts will almost certainly prove to be a net economic benefit. A cost-benefit analysis concludes that direct benefits of carbon pricing would outweigh the costs by a factor of at least 2, and would result in a net savings of at last $1 trillion by 2050.
 |
The Skeptical Science website by Skeptical Science is licensed under a Creative Commons Attribution 3.0 Unported License. |