There are several ways to take the temperature of the earth. We can use direct measurements by thermometers to measure air or sea surface temperatures. We can measure the temperature of the surface itself using infrared cameras, either from the ground or from space. Or we can use satellites to measure the microwave brightness of different layers of the atmosphere.
In a recent senate subcommittee hearing the claim was made that microwave brightness temperatures provide a more reliable measure of temperature change than thermometers. There are two issues with this claim:
Scientific arguments should be based in evidence, so the aim of this article is to investigate whether there is evidence for one record being more reliable than the other. If we want to determine which record is more useful for determining the change in temperature over time, we need to look at the uncertainties in the temperatures records.
Let's look at the period 1979-2012, covering the period from the beginning of the satellite record and ending 3 years ago. We will look at two datasets: the satellite data from Remote Sensing Systems (RSS), and a surface temperature dataset from the UK Met Office (HadCRUT4). The satellite data cover several layers of the atmosphere, so we'll use the data for the lowest layer, the 'TLT' or lower troposphere record, which measures temperatures over a region around 4 kilometers above the surface.
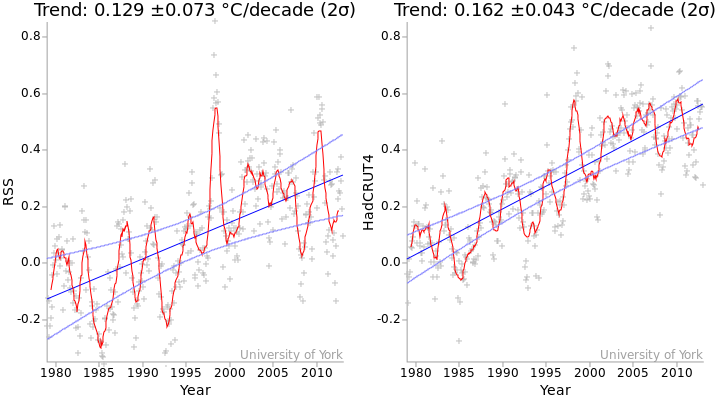
As a first step, we will calculate the trend for both the satellite and surface temperature data. The temperature changes and their trends are shown in Figure 1.

Figure 1: Temperature series for the period 1979-2012 for the RSS satellite record (left) and the HadCRUT4 surface temperature record (right). Grey crosses indicate monthly temperatures. Red lines are 12 month moving averages. The blue lines are the linear trends, and the light blue curves indicate the 2σ confidence intervals for the trends. The values of the trends and their standard errors are shown above the graph (method).
Whenever we calculate a parameter such as a least squares trend, we also try and determine the uncertainty in that parameter. And any software which can calculate the trend in a time series will always produce an error estimate attached to that value. The standard errors in the trends are indicated by the curves in Figure 1, these indicate the spread of likely trend values. The standard error is also given as a number, which is the value after the '±' symbol.
The standard error in the RSS trend is about 70% higher than the standard error in the surface trend. From this we might infer that the satellite data are less reliable. However, that would be an invalid inference. Here's why.
There is a problem. We tend to assume that the standard error in the trend is a measure of the uncertainty in that trend. But it isn't. The standard error in the trend comes from the 'wiggliness' of the data (i.e the deviation of the data from linearity) It is determined by the size of the error term ε(t) in the equation:
T(t) = α + βt + ε(t)
where t is time, T(t) is the temperature at a given time, α is the average temperature, β is the temperature trend, and ε(t) contains all of the remaining temperature variation which is not accounted for by the linear trend.
The equation says that the data consist of a constant, a linear trend, and everything else - where everything else is noise. In other words the standard error in the trend is not really a measure of uncertainty - it is a measure of deviation from linearity. The two can be equivalent, but only in the case where the data really do consist of a pure linear trend plus noise.
The problem is that the temperature data do not obey this assumption. The temperature data contain wiggles due to weather, El Niños, volcanoes and other factors. So the deviation from linearity is not just a function of the limitations of the measurement system, it also depends on the variations in the thing we are measuring. And because the two datasets are measuring different temperatures at different heights in the atmosphere, the variations are different - we know for example that the satellite data show a stronger El Niño variation than the surface data (Foster & Rahmstorf 2011).
So the standard error in the trend is not telling us primarily about the reliability of the data, but rather about variability in the observed part of the atmosphere. We can call this 'statistical uncertainty'. It is a good indication of the kind of variation we will see in future, but it is not a measure of the uncertainty in the observations.
The uncertainty in the observations and the way we use them to produce a surface temperature record is referred to as "structural uncertainty". Uncertainties in the observations play a role in the statistical uncertainty in the trend, but a secondary one.
We'll use a couple of thought experiments to clarify this issue.
Firstly imagine a planet with a perfect temperature observation system. We can measure the temperature of every point on the planet surface with perfect accuracy. So we also know the global mean temperature with perfect accuracy. And for any period, we can determine the trend in the temperatures with perfect accuracy.
But this planet still has weather, an El Nino cycle, and other temperature variations. So the temperature series has wiggles. Any trend we calculate will therefore also have a non-zero standard error, despite the fact that there is no uncertainty in the trend. In this case, the standard error in the trend overestimates the uncertainty in the observations.
Now let us consider a distant asteroid. It has no atmosphere and is in a circular orbit, so the temperature is constant. We have a real instrument on the asteroid, but the power supply is running down so there is some drift in the readings. The readings show a linear trend. Because the temperature history is linear, the standard error in the trend is zero. And yet we know that the observed trend is wrong. In this case the standard error in the trend underestimates the uncertainty in the observations.
So the standard error in the trend can overestimate or underestimate the observational uncertainties. It tells us something about the likely future variations in the trend, but not how much of that variation comes from uncertainties in the observations. So why do we use it? Because sometimes it is all we have.
If we really want to understand whether the satellite data are more reliable than the surface data or vice versa, we can't get that information from the temperature data alone, because they are not measuring the same thing and because some kinds of errors simply can't be detected from the global record alone. Instead we need to analyze the uncertainties in the observations themselves and in how they are combined to produce the temperature record.
This requires a detailed understanding of how the temperature records are put together, and so are generally performed by the temperature record providers.
The surface temperature record is comparatively simple - land temperatures, sea surface temperatures and weather station homogenizations can all be produced with a few hundred lines of computer code. By analyzing the source data we can estimate some of the uncertainties for ourselves. I outline one such test in this lecture:
This analysis must be combined with other techniques to assess the uncertainties in the surface temperature record arising from issues such as incomplete coverage or incorrect homogenization. The UK Met Office assesses these sources of uncertainty and uses them to produce an ensemble of 100 possible versions of the temperature record (Morice et al. 2012). By looking at the variation between members of the ensemble, we get an indication of the uncertainty in the record over the region covered by the observations. (Additional sources of uncertainty including changes in coverage and partially correlated errors slightly increase the uncertainties.)
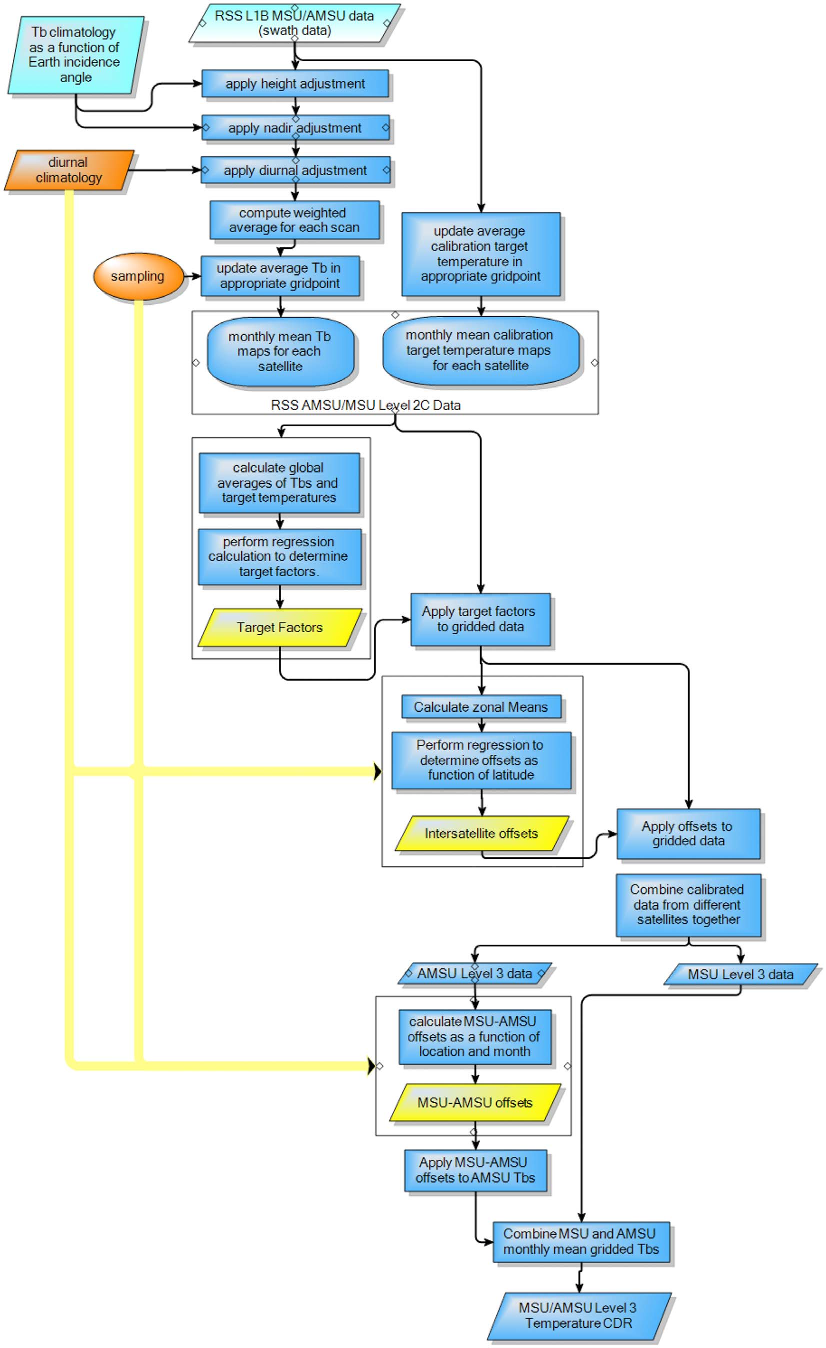
The satellite record is much more complex, requiring multiple corrections to the records from individual satellites, as well as cross calibration between the different satellites. The complexity of the calculation (Figure 2) makes it harder for us to assess it for ourselves. However RSS, one of the satellite record providers, also produce an ensemble of temperature records (Mears et al. 2011). By comparing the spread of the ensembles, we can compare the scale of the known uncertainties in the HadCRUT4 surface temperatures and the RSS satellite temperatures.

Figure 2: Flowchart of the processing algorithm for the RSS satellite data, from Mears et al. (2011)
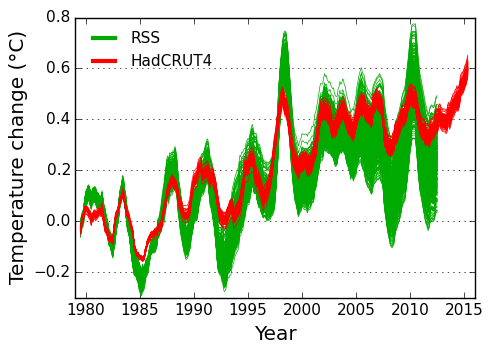
All of the ensemble members for the two datasets are shown in Figure 3 for the period 1979-2012 (i.e. the end of the RSS ensemble data). The RSS satellite ensemble shows a much greater spread than the surface temperature ensemble. The ensemble spread also shows some interesting variations, mostly associated with the introduction or withdrawal of different satellites.

Figure 3: Spread in the satellite and surface temperature ensembles over time. Each line shows one possible temperature reconstruction from the ensemble (12 month moving average). All of the series have been aligned to a zero baseline for the 10 year period 1979-1988, so that the increasing spread after that period gives an indication of the variability in the trend. The HadCRUT4 ensemble omits some sources of uncertainty: I estimate the spread in the trends should be increased by 7%. (Stand-alone version of this graph)
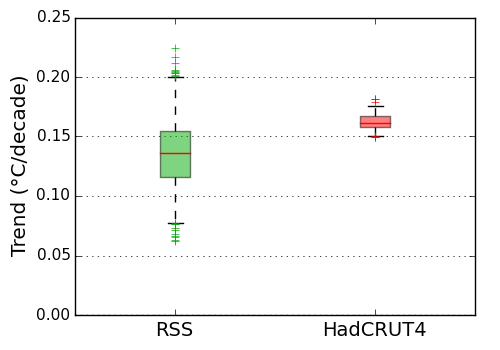
We can also compare the spread in the trends for the two ensembles for the period 1979-2012 (Figure 4). We don't expect the trends to be the same because they are measuring different things. However the spread of the ensemble trends tells us about the known uncertainties in the trends produced by that method. The spread of the trends in the satellite temperature ensemble is about five times the spread of the trends in the surface temperature ensemble. The known uncertainties in the observations and processing method suggest that the surface temperature trends are much more reliable than the satellite temperature trends.

Figure 4: Uncertainty in the temperature satellite and surface temperature trends, estimated from the RSS and HadCRUT4 ensembles. The boxes show the mean and interquartile range of the trends on 1979-2012 in each ensemble. Whiskers indicate the 95% interval (2.5%-97.5%). Crosses indicate outliers. The HadCRUT4 ensemble omits some sources of uncertainty: I estimate the spread in the trends should be increased by 7%. (Stand-alone version of this graph)
Of course the validity of the ensemble trend uncertainty estimates is dependent on the record providers having correctly identified all of the sources of uncertainty in the observations and methods. It is possible that currently unknown sources of uncertainty might change the picture. Different versions of the temperature record from NASA and NOAA show differences with the HadCRUT4 record, only some of which are explained by the HadCRUT4 ensemble.
More recently, corrections have been made to the sea surface temperature record to correct for the introduction of weather buoys as a major source of data. The UK Met Office and NOAA have both produced their own corrections which differ in some fine details. These will therefore increase the uncertainty in the surface record.
Carl Mears of RSS has produced some new work on uncertainties in the satellite temperature record which are likely to increase rather than decrease the uncertainties. There are also significant differences between versions of the satellite record from different providers, and even between different versions from the same provider. So it currently looks as though uncertainties in the satellite trends will continue to be substantially higher than the uncertainties in the surface temperature trends.
To summarize, on the basis of the best understanding of the record providers themselves, the surface temperature record appears to be the better source of trend information. The satellite record is valuable for its uniform geographical coverage and ability to measure different levels in the atmosphere, but it is not our best source of data concerning temperature change at the surface.
I would like to thank Carl Mears of Remote Sensing Systems (RSS) for reviewing this article, and the Skeptical Science team for helpful comments.
John Kennedy of the Hadley Centre has noted that the HadCRUT4 ensemble doesn't include all the known uncertainties. I estimate the additional uncertainties increase the spread in the trends in the HadCRUT4 record by about 7%. The text has been updated as noted here.
Posted by Kevin C on Monday, 11 January, 2016
 |
The Skeptical Science website by Skeptical Science is licensed under a Creative Commons Attribution 3.0 Unported License. |