If we don’t change direction soon, we’ll end up where we’re heading
These words come from the Executive Summary of the World Energy Outlook 2011 (WEO11), just published by the International Energy Agency (IEA). The study incorporates the most recent data on global energy trends and policies, and investigates the economic and environmental consequences of three scenarios over the 2010 to 2035 time period. This is an important document that should be widely read but, unfortunately, the full report costs €120 for a single-user 650-page pdf. Some key graphs and fact sheets are provided for free.
The WEO11 report is a commentary on the assumptions and output of the World Energy Model (WEM) in the IEA's words: a large-scale mathematical construct designed to replicate how energy markets function and is the principal tool used to generate detailed sector-by-sector and region-by-region projections for various scenarios. A detailed description of the WEM is available here. The IEA updates their model and analysis every year, since important and unpredictable developments — a tsunami in Japan, the Arab Spring, new technologies in natural gas production — change the model’s boundary conditions significantly. In 2012, we can look forward to: an election in which the world’s largest economy may elect a government that denies the urgency and even the reality of climate change; further unrest in the Middle East; developments in renewable and fossil-fuel technology; and an unfolding economic crisis in Europe. And those are just some of the more foreseeable events that will make a new WEO study needed next year. In comparison, climate modellers have it easy.
In the 2011 Outlook, the IEA explored three scenarios.
To summarize: the IEA base case imagines a ideal world in which governments do what they say they will do; the optimistic case explores what needs to be done if we heed the advice of the more conservative climatologists; and the pessimistic case shows what happens if our governments just carry on doing what they have always done.
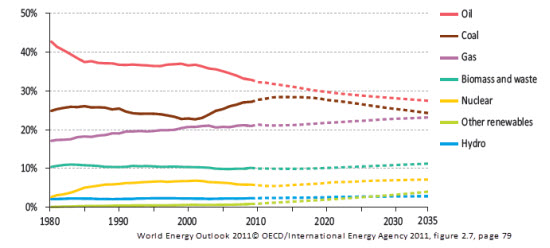
Figure 1, taken, like all the figures in this post, with permission from WEO2011, shows the projection for the energy mix for the New Policies Scenario. Note that the values are the proportions of the energy shares and not the absolute amounts of energy, the absolute amounts of oil and coal demand continue to climb over the period.

Figure 1: Shares of energy sources in world primary energy demand in the New Policies Scenario.
The graph shows that the relative importance of coal and oil will decline, while the use of natural gas rises. Non fossil-fuel energy sources gain slowly, but steadily, in importance. The relative changes reflect the influence of the policy assumptions in this scenario (among them, applying carbon taxes of $30-45 per tonne of CO2 before 2035). However, mainly because of assumptions of population and economic growth, total energy consumption rises over the 2009-2035 period by approximately 40%, despite modelled increases in energy intensity (energy used per dollar of GDP).
The IEA does not foresee any major problems associated with depletion of fossil fuel resources over this time period. New technologies for the extraction of natural gas from shales herald what the IEA refers to (notwithstanding concerns about aquifer contamination and other environmental impacts) as a “Golden Age of Gas” Unconventional oil production (bitumen sands) and emerging light-tight oil production technologies will make up for declines in conventional oil production that result from resource exhaustion and underinvestment in the major oil producing areas.
The New Policies Scenario would result in an atmospheric concentration of CO2 equivalent of about 650 ppm, which is expected to result in equilibrium warming of more than 3.5°C. Once warming has reached these levels, according to authors cited by the IEA, the world will be committed to disruptive climate changes, a damaging sea-level rise and greatly increased probabilities of triggering feedbacks in the global carbon cycle (for example, in the Arctic and the Amazon Basin).
Stabilizing atmospheric CO2 levels at 450 ppm is only achievable with the application of policies that are more aggressive than the policies in the base case. For example, the 450 Scenario envisages developed-country carbon taxes in the range $20-45 per tonne in 2020, rising to $95-120 for all countries by 2035.
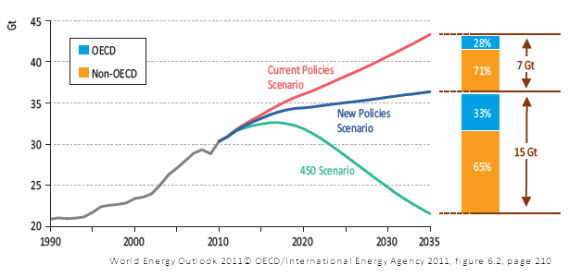
Figure 2: World energy-related CO2 emissions per year by scenario.
The 450 scenario assumes that global emissions will decline to 1990 levels by 2035, with approximately 67% of the reductions, relative to the other scenarios, coming from non-OECD countries. Over the 2010-2035 period, the 450 scenario involves a 141 GT reduction in cumulative emissions relative to the New Policies Scenario and a 212 GT reduction relative to the Current Policies Scenario.
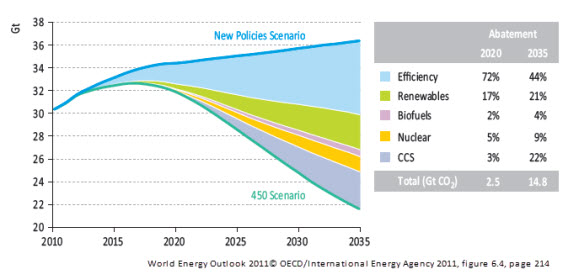
Figure 3: World energy-related CO2 emissions abatement in the 450 Scenario relative to the New Policies Scenario.
The IEA path to 450 is shown in Figure 3. Large contributions to abatements arise from efficiencies and renewable energy sources but large impacts come from nuclear energy and carbon capture and storage (CCS). After the accident at Fukushima, public acceptance of nuclear energy has fallen, for example, leading Italy to abandon its plans for building new nuclear plants and Germany to accelerate its plans to phase out its nuclear plants. If this trend away from nuclear energy persists, then its contribution to the 450 plan will not be realized. The IEA prepared an additional case, The Low Nuclear Case, to model this eventuality. To reach the 450 target without more nuclear power will require bigger increases in efficiencies, greater deployment of renewables and a very wide deployment of CCS to make up for increased uses of gas and coal in power generation.
Although CCS has been demonstrated as a feasible technology in pilot projects, there are doubts about the scalability, safety and the degree of public acceptance of the technology. The large carbon taxes envisaged in the 450 Scenario should help overcome the problem of the economic viability of CCS, but many other obstacles remain, any one of which could easily delay, restrict or prevent the widespread deployment of CCS, rendering the IEA’s path to 450 unfeasible.
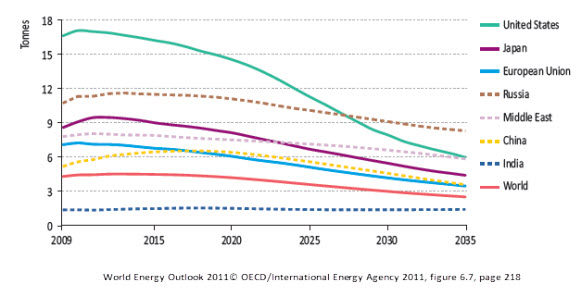
Figure 4: Energy-related CO2 emissions per capita in the 450 Scenario by region.
Emissions per capita will decline everywhere, but the biggest relative and absolute per capita reductions occur in the USA. Developing country per-capita reductions generally start declining after 2020. The biggest source of abatement in the 450 Scenario in all countries is in the electrical power sector.
Concerns about the interactions between energy supplies and human welfare are not just confined to climate change. Chapter 13 of WEO is devoted to the problem of providing energy to the poorest people on the planet, the 1.3 billion without access to electricity, as well as to the 2.7 billion people, nearly 40% of humanity, who do not have clean cooking facilities in their homes. Electricity brings light, communications and refrigeration, benefits that those of us in prosperous counties have taken for granted for many decades. But perhaps the biggest environmental welfare issue of all is the use of biomass (wood, charcoal and dung) as cooking and heating fuels.
A recent article in Science Magazine estimates that primitive household fires contribute to nearly two million deaths annually from indoor air pollution, making this a worse health problem than malaria. The IEA report estimates that by 2030, biomass smoke will result in more premature deaths than HIV/AIDS. This is a problem that can be dealt with the deployment of simple and cheap technology—efficient stoves—albeit on a massive scale. As this article by Stephen Leahy shows, not only would resolving this problem lead to fewer deaths from respiratory illnesses, but it would result in a big reduction in black carbon pollution and help reduce climate change.
Even though they are expressed as round-number integers, climate and emission targets can't really be defined with any precision: a little more than 450 ppm might be safe; a little more than two degrees of warming might not lead to climate disaster; we might still have a decade rather than the IEA's five years to dither around. On the other hand, perhaps 350 ppm, a limit that we have now passed, should have been our target; carbon cycle feedbacks may have started to kick in already (e.g., the Amazon, Arctic). Perhaps we had five years to act twenty years ago.
What we do know is that we are near or past the limits. We also know that deploying the policies and the technologies that we need will take time to bear fruit. And that the bad infrastructure choices we make today will be with us for many years.
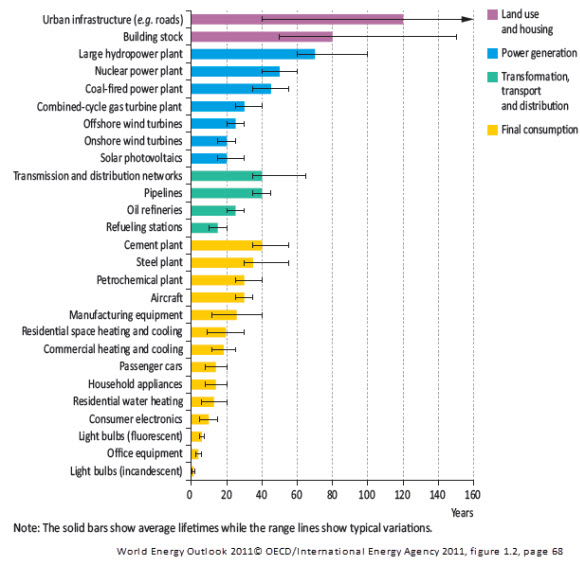
Figure 5: Typical lifetime of energy-related stock.
The headline conclusion of the WEO11 report is that, while the 450 target is still achievable, our chances of success are decreasing with every year of delay, and that, by 2017, the target could be out of reach. Countries have been ready to announce targets but less ready to agree to binding commitments and, faced with the recent economic turmoil, have tended to push climate-related issues down their priority lists. Policy procrastination has consequences:
Our limits are uncertain. Our models and best-laid plans won't survive unscathed from their first contact with reality. But, as the WEO11 report makes clear, we do know exactly when to act: now.
Posted by Andy Skuce on Wednesday, 16 November, 2011
 |
The Skeptical Science website by Skeptical Science is licensed under a Creative Commons Attribution 3.0 Unported License. |