Climate Science Glossary

Term Lookup

Enter a term in the search box to find its definition.

Settings

Use the controls in the far right panel to increase or decrease the number of terms automatically displayed (or to completely turn that feature off).

Term Lookup

Settings


All IPCC definitions taken from Climate Change 2007: The Physical Science Basis. Working Group I Contribution to the Fourth Assessment Report of the Intergovernmental Panel on Climate Change, Annex I, Glossary, pp. 941-954. Cambridge University Press.

Home Arguments Software Resources Comments The Consensus Project Translations About Support

Twitter Facebook YouTube Mastodon MeWe

RSS Posts RSS Comments Email Subscribe


Climate's changed before
It's the sun
It's not bad
There is no consensus
It's cooling
Models are unreliable
Temp record is unreliable
Animals and plants can adapt
It hasn't warmed since 1998
Antarctica is gaining ice
View All Arguments...


Username
Password
New? Register here
Forgot your password?

Latest Posts

Archives

Amazon Drought: Heat Stress Linked To Mass Tree Die Off In 2005 and 2010

Posted on 27 October 2011 by Rob Painting

In 2005 & 2010 the Amazon rainforest experienced two "once-in-a-century" droughts, adding to concerns that the rainforest may undergo massive die-back in the 21st century under global warming

When discussing the potential for die-back of the Amazon rainforest, attention is often focused on reductions in rainfall, for obvious reasons; however, rising temperatures may also be a threat to the future prospects of the Amazon, as some research suggests that tropical rainforests exist near a high temperature threshold.

As if to underscore this potential threat, a recent peer-reviewed paper (Toomey 2011) finds that, aside from reduced rainfall, greater-than-normal surface temperatures in the 2005 and 2010 extreme droughts very likely contributed to a mass die-off of trees.

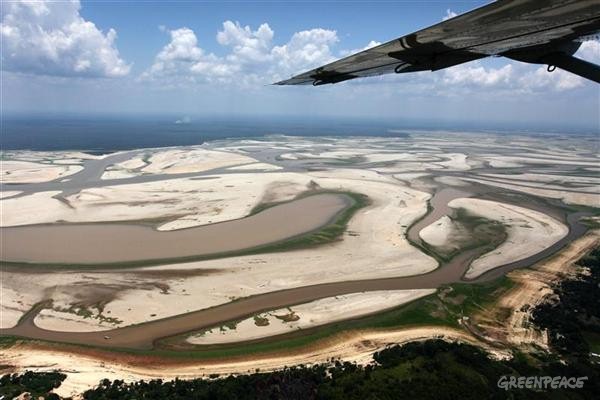
Figure 1 - 2010 drought in the Amazon, illustrating the severity of reduced rainfall experienced in parts of the basin. Picture from Greenpeace International.

Anomalous heat and tree death 

Unlike earlier studies which have used satellite-detected greeness products (EVI) as an indicator of forest health, and because of prior problems with this method, Toomey (2011) considered another method. They compared satellite-based temperature and rainfall data with a network of Amazon rainforest (on-the-ground) observation plots (RAINFOR), to determine changes during the 2005 drought (plot observations were not available for 2010). 

They confirm the results of two prevous studies (Lewis [2011]) & (Xu [2011]), which found that the 2010 drought was much worse than the 2005 (once-in-a-century) drought, and that reductions in rainfall affected a larger area in 2010 (left-hand column in figure 2). But they also discovered that surface temperatures (temperature anomalies) were greater in the 2010 drought and covered a far larger area of the Amazon (right-hand column in figure 2).    

Figure 2 - The change in mean monthly maximum climatological water deficit (i.e. a measure of water stress in the rainforest) in mm, and September monthly temperature anomalies (°C) in (a & b) 2005, and (c & d) 2010. From Toomey (2011). 

The significance of these heat anomalies is that in their statistical analysis, the study authors found that the greater-than-normal daytime temperatures of the 2005 drought explained 39% of the tree die-off. They also found that the additive effects of heat and moisture stress explained more of the tree die-off (65%) than rainfall deficits alone. It is therefore likely that the larger heat anomalies in 2010 (See figure 3) also go a long way toward explaining the greater tree die-off experienced that year.       

Figure 3 - Frequency histograms of day and nighttime thermal anomalies at peak drought for all drought-affected areas. The 2.5th, 25th, 50th, 75th and 97.5th percentiles are shown in descending order (left-hand side) for each histogram. (e.g for Sept daytime 2005, 2.5% of observations fall below a thermal anomaly of -1.68°C, 25% fall below -0.08°C, 50% fall below 0.5°C, and so on) 

Excessive heat the cause, not a symptom

Trees are responsible for recycling a lot of water, especially in the rainforest where the evaporative loss from trees causes considerable cooling of surface temperatures (think of how sweating causes your skin to cool). So the higher temperatures could be a result of trees dying and reducing the total evaporative cooling in the droughted areas. 

To determine the direction of causality, the authors examined the relationship between NVDI (a satellite-based measure of rainforest health) and temperature anomalies in 2010 (this isn't possible with ground-based RAINFOR observations).  They found the decline in rainforest health lagged that of the temperature anomalies by a month, suggesting that heat stress may be killing trees.

A dry, hot future for the rainforest?

As discussed in other SkS posts on the Amazon (see green box at bottom), the warming tropical Pacific and Atlantic Ocean are expected to shift rainfall away from the rainforest, especially during the dry season, causing it to suffer more frequent and more intense droughts in the future. This is supported by observations that a major drought in 1995, plus the 2005 and 2010 episodes were largely caused by warming in the tropical Atlantic Ocean (Espinoza [2011]).

Unlike earlier warm periods in Earth's past, the Amazon rainforest faces a combination of future stresses which it has never had to endure before. These will be discussed in detail in a future post, but the most obvious stressor is the speed at which tropical regions are warming.

With temperatures in the tropics rising at a rate twice that of the global average (0.26°C per decade) since the 1970's (Malhi & Wright [2004]), the prospect of a high temperature threshold for rainforest trees gives genuine concern that the Amazon rainforest may be approaching a tipping point, where it abruptly dies back and is replaced by savannah.

Related SkS posts: The 2010 Amazon Drought, Drought in the Amazon: A Death Spiral? part 1: seasons, , part 2: climate models & part 3:2005 & 2010 droughts.

0 0

Printable Version  |  Link to this page

Comments

Comments 1 to 18:

  1. Suggested reading: "2010 Amazon drought released more carbon than India's annual emissions," Mongabay, Oct 9, 2011 To access this informative article, click here.
    0 0
  2. That sounds scary!!
    0 0
  3. On the greenpeace image, it would be nice if they had before and after images. Negro River looks like being a quite shallow one, one can't really see the perspective (or the height of the sant/silt banks) on that image.
    0 0
  4. jyyh - agreed. I couldn't find any pics that I was really after. A before and after montage would be great. No go with tree die-off pics either.
    0 0
  5. "With temperatures in the tropics rising at a rate twice that of the global average (0.26°C per decade) since the 1970's" I'm confused. I thought it was the polar regions that were warming twice the global average. I read many global warming articles that said the tropics are warming more slowly than the rest of the planet. Why are the tropics warming faster than the rest of the planet if they don't have the same feedbacks like the retreat of snow and ice that the Arctic and mid-latitudes have?
    0 0
  6. I don't deny that the rainforest is in stress from multiple causes. That said, I would not have used the image from Greenpeace unless it could be linked to a 'boots on the ground' study of that exact location. The Rio Negro has what is probably the world's most spectacular meander system. The flood plain / meander system is constantly migrating, so it will always be possible to find drier and wetter areas. Compare for example these Wikimapia images of a farming area and an area from which the river is in retreat due to the meander system dynamics. I repeat: I do not dispute the central theme of this SkS article, I merely point out that Greenpeace may well have cherry-picked the images shown on its web site. I would have shown images of areas away from the river which show stronger and less ambiguous signs of drought stress.
    0 0
  7. Karamanski, I didn't see a proposed explanation for the accelerated tropical warming on a quick skim through Malhi & Wright 2004. However, note that while ice albedo feedback would obviously be much less in the tropics than in the Arctic the reverse would be true for water vapor feedback. So long as Arctic temperatures remain near freezing there will be virtually no water vapor feedback in that region. 100% relative humidity at 0 C is about 4.8 g/m^3 100% relative humidity at 5 C is about 6.8 g/m^3 100% relative humidity at 40 C is about 51.1 g/m^3 100% relative humidity at 45 C is about 65.4 g/m^3 An increase from 0 C to 5 C yields only an additional 2 g/m^3 of possible water vapor... while an increase from 40 C to 45 C yields an extra 14.3 g/m^3. Thus, we can see that the amount of water vapor which the atmosphere can hold increases in both total amount and rate of increase as the temperature goes up. Of course, the greenhouse warming of water vapor is logarithmic and thus DEcreases in rate as the total amount increases... and the figures above are for maximum possible humidity while actual values would usually be lower. So there are considerable complexities around the water vapor feedback. However, it might be the case that the polar regions will experience accelerated warming due to the most pronounced ice-albedo feedback while the tropics do due to the most pronounced water vapor feedback. Or maybe it is something else. The paper seems to suggest that tropical temperatures are highly influenced by ENSO. Perhaps ocean heating is causing stronger ENSO swings which in turn caused the recent pronounced tropical heating.
    0 0
  8. Great summary, Rob. Having it in hand last Feb would have made it a lot easier to write my article on Lewis' research. Amazon Drought Accelerating Climate Change The important point is that new growth will not compensate for the die off. In an earlier article about a World-Bank-sponsored metastudy researchers warned about this, especially when combined with deforestation. The Amazon is shrinking fast. The REAL Amazon-gate: On the Brink of Collapse Reveals Million $ Study
    0 0
  9. Karamanski @ 5 - as CBD has discussed, Malhi & Wright suggest it may be related to ENSO, but other studies also suggest the cutting down of large tracts of tropical forest (lower evaporative cooling) may play a part. I've not read anything definitive on it. logicman @ 6 - many Amazon River systems were at their lowest level ever recorded. I tend to have a bit more faith in Greenpeace than you. Stephen Leahy @ 8 - thanks. I've a few more posts lined up on the Amazon over the coming months. I'll eventually link them together via a summary at the end, and this will serve as a rebuttal. Hopefully this will help public understanding when the next extreme drought occurs, because it is definitely not appreciated by the public at large that tropical rainforests (and the many insects and animals that live in them) are in great danger. They have evolved to thrive in a cooler climate, have a very narrow heat tolerance threshold, and are now having to adapt to unprecedented change. Their future is hugely uncertain.
    0 0
  10. For what it's worth, my take on that picture is that the blue patch in the upper left is ocean. This then would be is a beach/delta area, and for all I know the white stuff is sand. This picture is also the opposite of what I'd expect, in the sense that in the American desert, vegtation clusters around a river, while at a distance the ground is bare. This is in no way a criticism of objective efforts to track Amazon drought or the reality of it....I'm just wondering about the picture itself.
    0 0
  11. Dave123, If you follow the link to the Greenpeace page, you find that's a picture of the Rio Negro during its lowest ever recorded level. If you look at the Rio Negro, you find it's in the very heart of the Amazon (see map below). As such, the "ocean" you see in the distance is tropical forest.
    0 0
  12. Dave123, Look at the pictures here.
    0 0
  13. Dave123, And here. I particularly like the picture of the boat resting on the dried up river bed.
    0 0
  14. Well, I did follow the link to greenpeace, but obviously I wasn't diligent enough
    0 0
  15. Dave, In the desert there is a shortage of water so the trees grow near the water. In the rain forest there is plenty of water so trees grow everywhere. The river washes away the trees in the river bed, so when the river is low there is bare sand next to the river. Think it through before you suggest there is a problem with the picture.
    0 0
  16. Sphaerica - thanks. What's with the "lowest Amazon river levels ever recorded" skeptics? Is it because it's a Greenpeace photo? Anyway see: The drought of 2010 in the context of historical droughts in the Amazon region - Marengo (2011). One of the papers I'll cover in future posts.
    0 0
  17. Dave 123 - the ocean you "see" is the Green Ocean
    0 0
  18. Dave - my thanks for your overview of the droughts and their causation of tree-death rates. One additional aspect perhaps worth considering is droughts' stressing of trees leading to death in future years - as I know occurs with temperate species - which would notably raise the rate of dieback. The data I'd really like to see in future articles on this issue are the current projections of dieback/wildfire CO2e emissions - which are potentially more than problematic as I understand it. I recall that the I(G)PCC got as far as indicating that under BAU global forest cover might change from a sink to a source later this century, but, given both the other interactive feedbacks' acceleration and the inevitable warming due to the 'sulphate parasol's' loss if anthro GHG outputs are controlled, that appears characteristically understated given forests' present climatic destabilization. One aspect on which data seems scarce is the destination of the carbon that the Amazon forest is assumed to be sequestering. In a 60-million-year system with only a foot of soil under it, can that sequestration be measured by the volume transported down the Amazon river and deposited on the seabed ? Moreover, it would be good to read how the net intake of CO2 compares with the net output of CH4 from swamps and from anaerobic decay within fallen trees - in terms of CO2e. I suspect that there may be information from the Amazon Forest's degradation that causes major surprises in future years. Regards, Lewis
    0 0

You need to be logged in to post a comment. Login via the left margin or if you're new, register here.


The Consensus Project Website

THE ESCALATOR

(free to republish)


© Copyright 2024 John Cook
Home | Translations | About Us | Privacy | Contact Us