Tom Wigley and Ben Santer have published a new paper in Climate Dynamics entitled A probabilistic quantification of the anthropogenic component of twentieth century global warming (hereinafter WS12). The paper seeks to clarify this statement about human-caused global warming in the 2007 IPCC report:
"Most of the observed increase in global average temperatures since the mid-20th century is very likely due to the observed increase in anthropogenic greenhouse gas concentrations"
As WS12 notes, this statement has been criticized by various individuals, including Pat Michaels in testimony to US Congress and Judith Curry. Some of these criticisms stem from a failure to understand that the term "very likely" has a specific numerical definition, meaning greater than 90% probability. Some stem from the fact that the other terms used in the IPCC attribution statement like "most" and "mid-20th century" are somewhat vague.
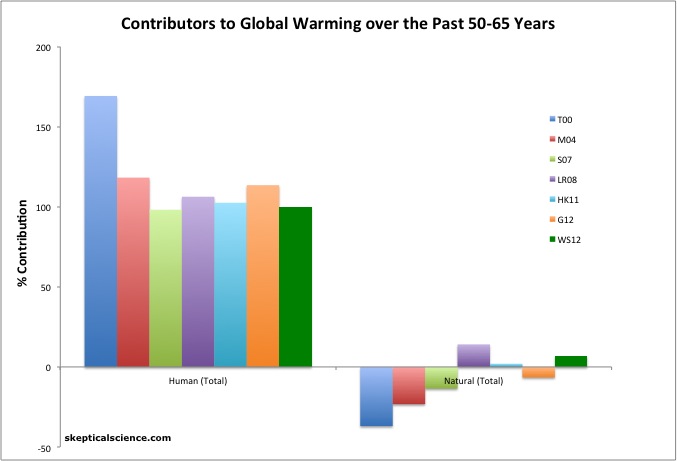
WS12 attempts to add specificity to these more vague phrases by quantifying the magnitude of the human contribution to global warming in probabilistic terms. Their overall result (dark green in Figure 1) is consistent with the rest of the global warming attribution scientific literature.
Figure 1: Net human and natural percent contributions to the observed global surface warming over the past 50-65 years according to Tett et al. 2000 (T00, dark blue), Meehl et al. 2004 (M04, red), Stone et al. 2007 (S07, light green), Lean and Rind 2008 (LR08, purple), Huber and Knutti 2011 (HK11, light blue), Gillett et al. 2012 (G12, orange), and Wigley and Santer 2012 (WS12, dark green).
Since the 2007 IPCC report examines radiative forcings (global energy imbalances caused by factors like an increasing greenhouse effect) up to 2005, WS12 considers the timeframes 1950–2005 and 1900–2005 in their analysis. They use global mean surface temperature data from GISS, NCDC, HadCRUT4, and HadCRUT3v, and use climate sensitivity values (the total amount of warming in response to a doubling of atmospheric CO2, including feedbacks) of 1.5°C, 3°C, and 6°C. This accounts for the most likely value based on the current body of scientific research (3°C) as well as the very likely low (1.5°C) and high (6°C) possible values (90% confidence interval).
The paper also includes a new analysis of the uncertainty associated with the aerosol forcing. Aerosols are particulates released during fossiil fuel and biomass combustion which have an overall cooling effect on global temperatures by blocking sunlight. WS12 estimates the aerosol forcing at -1.10 ± 0.57 Watts per square meter (W/m2). This is a substantially narrower range of likely values than in the 2007 IPCC report, which put the value at -1.1 W/m2 with a range of -0.2 to -2.7 W/m2 (total aerosol + black carbon on snow Figure 2).
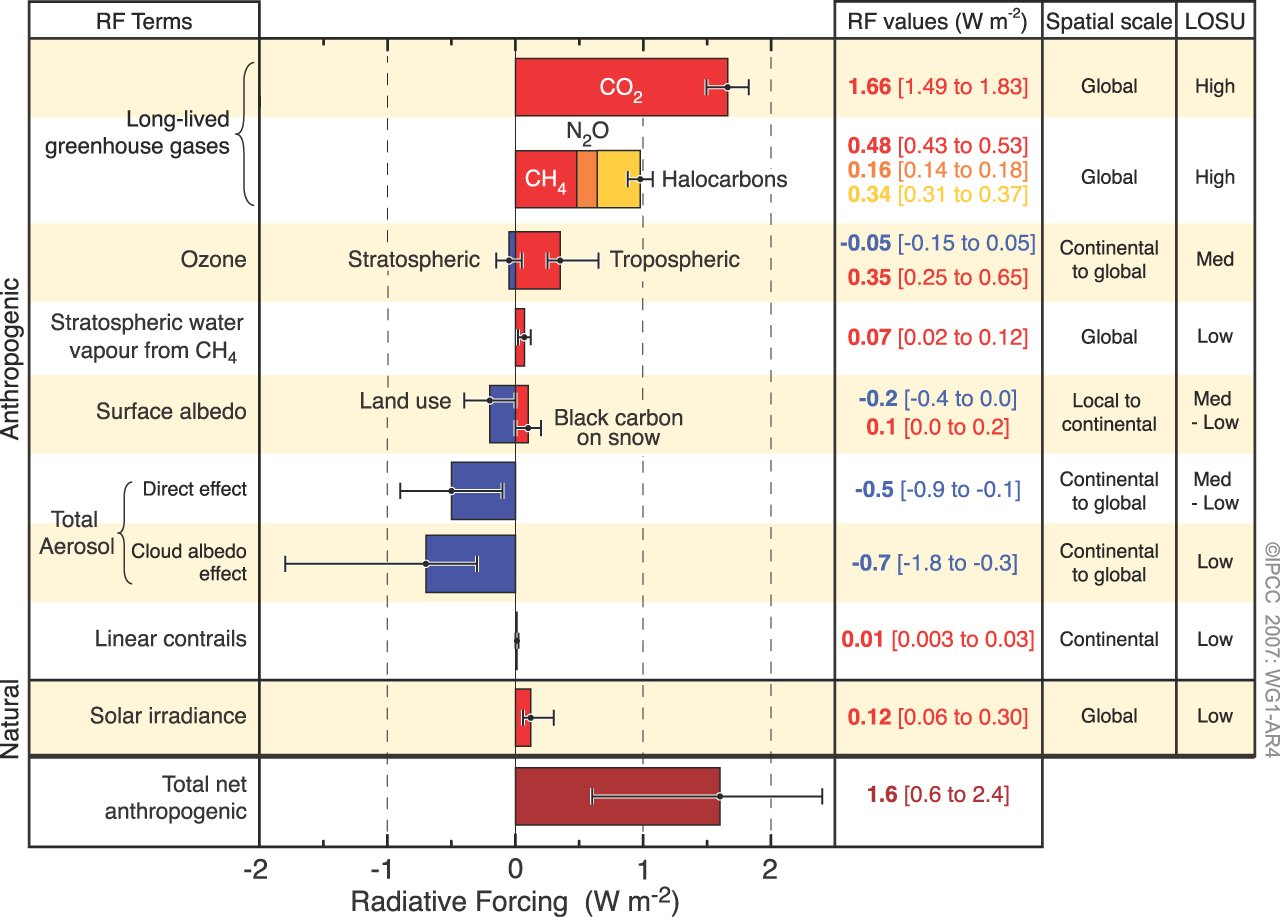
Figure 2: Global average radiative forcing in 2005 (best estimates and 5 to 95% uncertainty ranges) with respect to 1750. Source (IPCC AR4).
WS12 uses a very simple global climate model (version 5.3 of the MAGICC coupled gas-cycle/upwelling-diffusion energy balance model) which does not simulate internal natural variability to avoid any "contamination" of the model signal by internally generated noise. The authors ran the model simulations with a range of low, medium, and high aerosol forcing and climate sensitivity values, also including the well-known radiative forcing associated with greenhouse gases (shown in Figure 2).
The paper goes through their analysis step by step, beginning with the most simple analysis and then adding more and more complexity in each step.
The results of the simple model simulation runs only considering the main human climate influences (greenhouse gases and aerosols) are shown in Figure 2. The two best fits to the data involve combintions of low aerosol forcing and low (1.5°C) climate sensitivity (Figure 3a), and mid aerosol forcing and mid (3°C) climate sensitivity (Figure 3b). However, as Fasullo and Trenberth (2012) most recently demonstrated, the lower climate sensitivity values are unlikely to reflect the real world, and there is only a 5% probability that real-world sensitivity is 1.5°C or lower for doubled CO2.
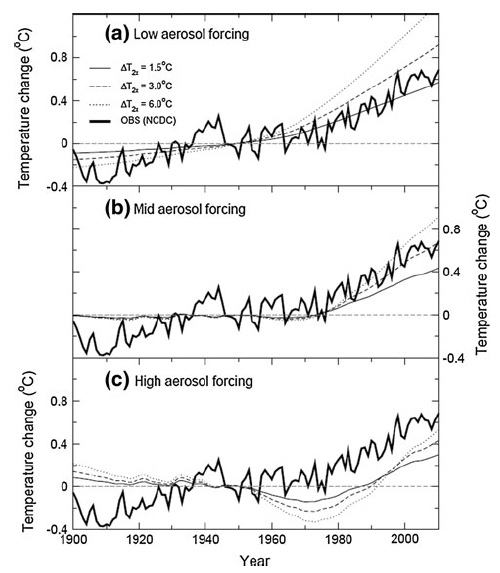
Figure 3: Simulated and observed global-mean temperature changes from 1900 for anthropogenic forcing with different magnitudes of aerosol forcing and climate sensitivity. The ‘‘Mid’’ aerosol forcing case corresponds to the best-estimate forcings given in the 2007 IPCC report. Each panel shows results for climate sensitivities of 1.5, 3.0 and 6.0°C. Observed data, from NCDC, are annual means relative to 1946–1954. Model data are zeroed on 1950. The decadal variability evident in the high aerosol forcing case is due to fluctuations in aerosol emissions. Figure 2 from WS12.
WS12 notes that in Figure 3b (mid aerosol forcing), the simulations match the observed 'mid-century cooling' very well for all climate sensitivity values, with the aerosol cooling forcing offsetting the greenhouse gas warming forcing until about 1975. The warming from 1975 to 2005 is also simulated accurately in Figure 3b, especially for the 3°C climate sensitivity model runs, as the warming grenhouse gases begin to dominate over the cooling from aerosols. However, the warming during the early 20th Century isn't simulated in most model runs, which indicates that it has a natural component not captured in these anthropogenic-only simulations.
WS12 provides a summary of the scientific literature regarding the causes of the early 20th Century warming. Increasing solar activity accounted for some, but not all of the warming during this timeframe. Other research has concluded that the Atlantic Meridional Overturning Circulation (AMOC) and specifically an increase in the rate of formation of North Atlantic Deep Water (NADW) played a role, although there are not good NADW measurements prior to 1957, so this is somewhat speculative.
WS12 also ran their model simulations just considering the greenhouse gas forcing without the aerosol forcing to determine the greenhouse gas contribution to the observed warming. Figure 4 shows that except for very low probability climate sensitivity values of 1.5°C or lower, greenhouse gases account for more warming than has been observed (meaning that aerosols and natural effects have had a net cooling effect, offsetting some of the greenhouse warming).
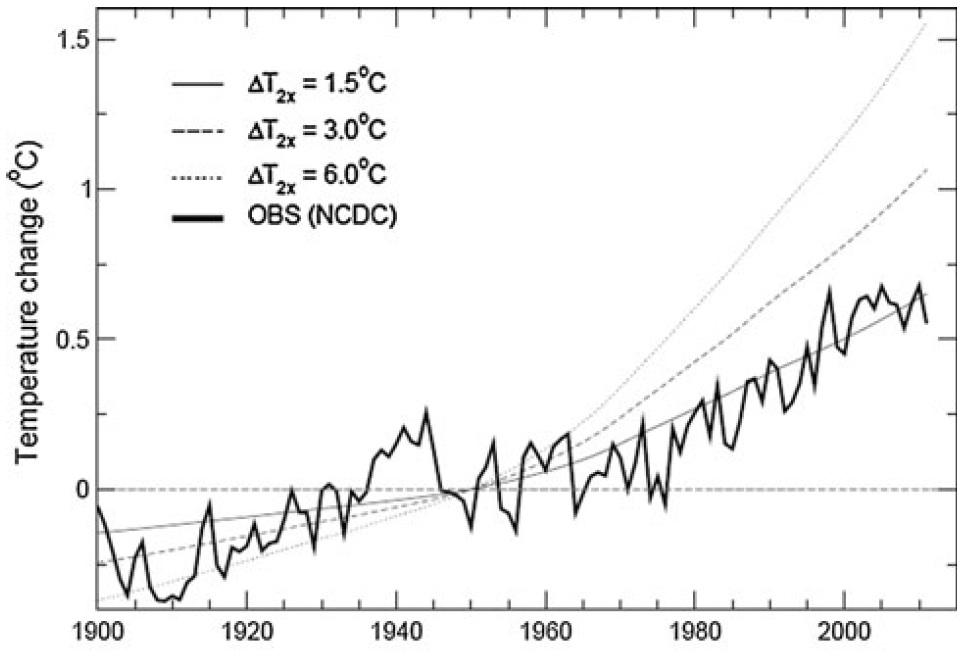
Figure 4: Simulated and observed global mean surface temperature changes from 1900 for greenhouse gas forcing alone, for different values of the climate sensitivity (1.5, 3.0 and 6.0°C). Observed data, from NCDC, are annual means relative to 1946–1954. Model data are zeroed on 1950. Figure 3 from WS12.
WS12 then adds more complexity into their analysis, defining probability distribution functions for climate sensitivity, ocean heat uptake, and total aerosol forcing, and compare their simulations to observational data with the influence of the El Niño Southern Oscillation (ENSO) removed, since their model does not account for internal variability. They first test the IPCC statement that
"It is likely [66–90% probability] that increases in greenhouse gas concentrations alone would have caused more warming than observed..."
Figure 5 presents the cumulative probability distribution functions (solid lines) for temperature changes over the 1900–2005 (black) and 1950–2005 (gray) timeframes, compared to the observed temperatures (dashed lines), for greenhouse gases only (a) and all human-caused raditive forcings (b). For the climate sensitivity distribution function, WS12 uses a log-normal distribution with a median of 3.0°C and a 90% confidence interval of 1.5–6.0°C.
Figure 5a shows that the probability that the model-estimated greenhouse gas component of warming is less than the observed trend over either timeframe is approximately 7%. Figure 5b shows that the probability that humans (greenhouse gas warming plus aerosol cooling) caused at least 100% of observed warming for 1900-2005 is 22%, and the probability of humans causing at least 100% of warming for 1950–2005 is 39%. These results suggest that natural effects probably account for some of the observed warming over these timeframes.
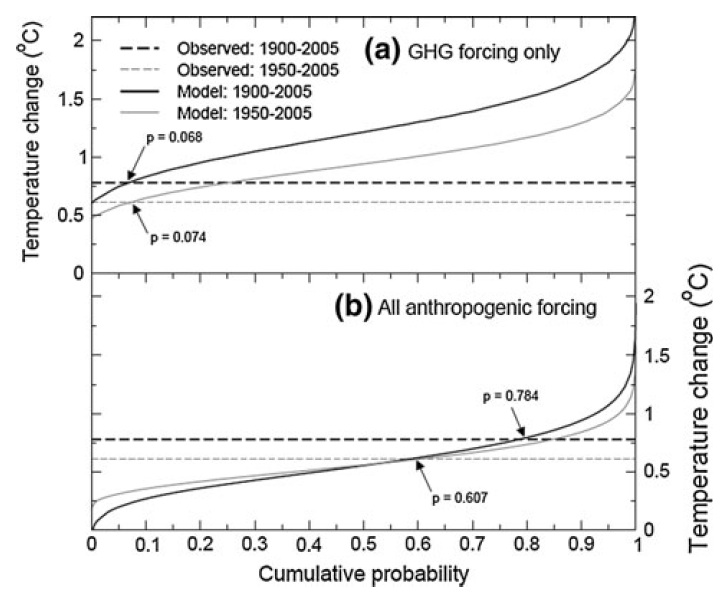
Figure 5: Cumulative distribution functions for temperature changes over 1900–2005 and 1950–2005 for a) greenhouse gases (GHG)-only and b) all anthropogenic forcings. Observed data are from NCDC, with ENSO effects removed. All changes are estimated using the robust trend. Figure 4 from WS12.
WS12 thus concludes that the first IPCC statements about greenhouse gas warming are far too conservative (emphasis added).
"Using IPCC terminology, therefore, it is very likely that GHG-induced warming is greater than the total warming observed over this 56-year period (i.e., the model GHG-only trend is not just greater than ‘‘most’’ of the observed warming, but very likely greater than the full amount of observed warming)."
In their simulations for 1950–2005, the 90% confidence interval of warming using all-anthropogenic forcings 0.308–0.937°C (50–152% of observed warming), while the greenhouse gas-only warming 90% confidence interval is 0.582–1.397°C (94–227% of observed warming). Therefore, the IPCC statement should either say
"Most of the observed increase in global average temperatures since the mid-20th century is very likely due to the observed increase in anthropogenic greenhouse gas concentrations human climate influences."
or
"Most At least 94% of the observed increase in global average temperatures since the mid-20th century is very likely due to the observed increase in anthropogenic greenhouse gas concentrations"
The next step in the WS12 analysis is to incorporate changes in solar and volcanic activity (but not in AMOC or NADW, for which data are not available in the early 20th Century, as noted above). The results are shown in Figures 6 and 7.
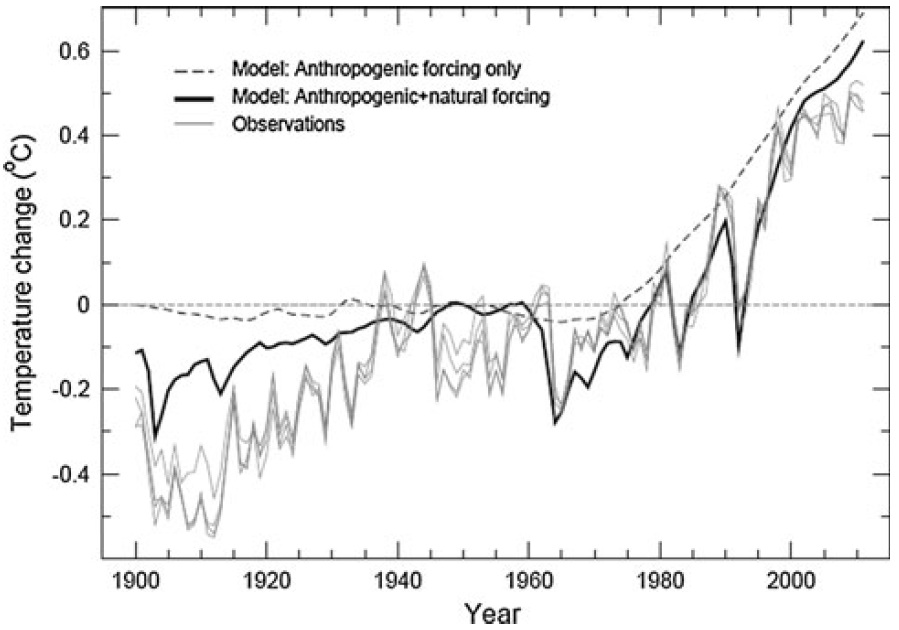
Figure 6: Estimates of global mean surface temperature change from observations, compared with median model simulations of the response to anthropogenic forcing only, and the response to forcing by combined anthropogenic and natural factors. Model results are relative to 1950. Observations have been zeroed to have the same mean as the ‘‘anthropogenic + natural forcing’’ result over 1950–2005. The plot shows annual-mean values; on a monthly timescale the volcanically induced cooling signals are larger. Figure 5 from WS12.
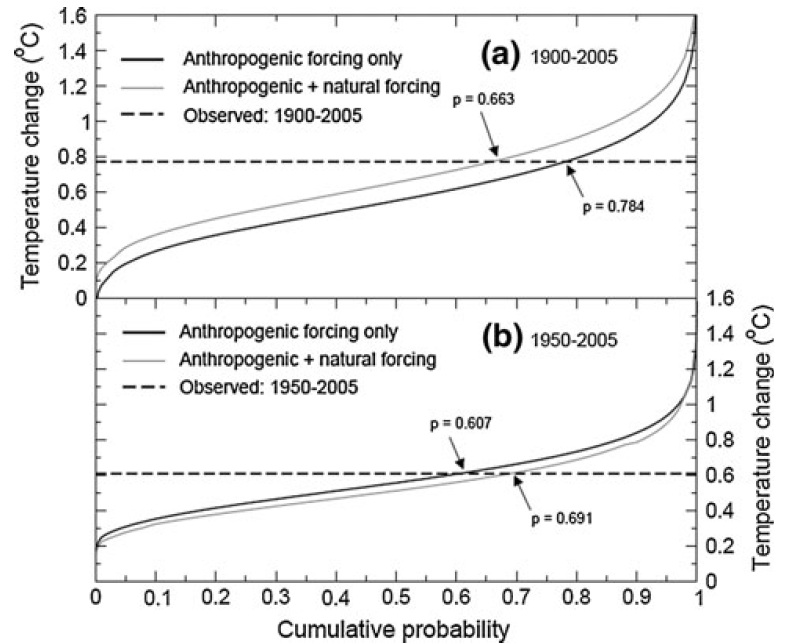
Figure 7: Cumulative distribution functions for global mean surface temperature changes over 1900–2005 and 1950–2005. Results for anthropogenic forcing only (Figure 5b) are compared with those for combined anthropogenic and natural (solar plus volcanic) forcing. The observed changes are from the NCDC data set with ENSO effects removed. Figure 6 from WS12.
Incorporating these natural factors does not change the 1950–2005 result very much. The probability that the observed warming exceeds the model-predicted warming (Figure 7b) actually increases from 61% to 69% (a "perfect" result would be 50%). However, for 1900–2005, the probability that the observed warming exceeds the model-predicted warming (Figure 7a) is decreased from 78% to 66% when accounting for these natural factors.
WS12 summarizes their results as follows.
"Here, the probability that the model-estimated GHG component of warming is greater than the entire observed trend (i.e., not just greater than ‘‘most’’ of the observed warming) is about 93%. Using IPCC terminology, therefore, it is very likely that GHG-induced warming is greater than the observed warming. Our conclusion is considerably stronger than the original IPCC statement."
Thus quite contrary to the myth that the IPCC is "alarmist", WS12 finds that the IPCC has been far too conservative in attributing the observed global warming to human greenhouse gas emissions. In fact their central estimate is that humans are responsible for 100% of the observed global warming for the 1950–2005 timeframe, with greenhouse gases responsible for 160% (Figure 8).
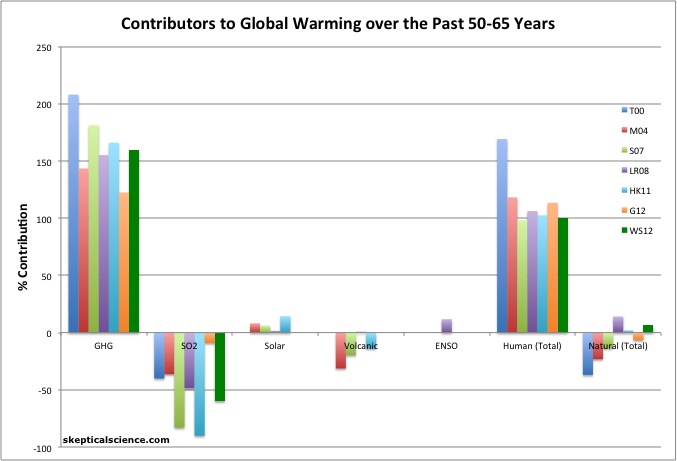
Figure 8: Percent contributions of various effects to the observed global surface warming over the past 50-65 years according to Tett et al. 2000 (T00, dark blue), Meehl et al. 2004 (M04, red), Stone et al. 2007 (S07, green), Lean and Rind 2008 (LR08, purple), Huber and Knutti 2011 (HK11, light blue), Gillett et al. 2012 (G12, orange), and Wigley and Santer 2012 (WS12, dark green).
As Figure 8 shows, the body of scientific literature is still very consistent in finding that grenhouse gases have most likely caused more warming than has been observed over the past half century, which means that the IPCC has been too conservative in attributing global warming to human greenhouse gas emissions. In addition, without human influences on the climate, there would likely have been little change in the average global surface temperature over the past 50 years. Instead, surface temperatures have warmed approximately 0.65°C since 1960.
Note: this post has been incorporated into the rebuttal to the myth that the IPCC is "alarmist"
Posted by dana1981 on Tuesday, 20 November, 2012
 |
The Skeptical Science website by Skeptical Science is licensed under a Creative Commons Attribution 3.0 Unported License. |