Climate Science Glossary

Term Lookup

Enter a term in the search box to find its definition.

Settings

Use the controls in the far right panel to increase or decrease the number of terms automatically displayed (or to completely turn that feature off).

Term Lookup

Settings


All IPCC definitions taken from Climate Change 2007: The Physical Science Basis. Working Group I Contribution to the Fourth Assessment Report of the Intergovernmental Panel on Climate Change, Annex I, Glossary, pp. 941-954. Cambridge University Press.

Home Arguments Software Resources Comments The Consensus Project Translations About Support

Twitter Facebook YouTube Mastodon MeWe

RSS Posts RSS Comments Email Subscribe


Climate's changed before
It's the sun
It's not bad
There is no consensus
It's cooling
Models are unreliable
Temp record is unreliable
Animals and plants can adapt
It hasn't warmed since 1998
Antarctica is gaining ice
View All Arguments...


Username
Password
New? Register here
Forgot your password?

Latest Posts

Archives

Fasullo and Trenberth Find Evidence in Clouds for High Climate Sensitivity

Posted on 13 November 2012 by dana1981

A new paper published in Science by Fasullo and Trenberth of the National Center for Atmospheric Research (FT12) takes an interesting approach to determine which climate models best simulate changes in cloud cover.  Equilibrium climate sensitivity (ECS) is defined as the total global surface warming that will occur as a result of a doubling of atmospheric CO2 once the planet reaches a new energy equilibrium.  On Earth it can take several centuries to reach a new energy equilibrium because of the slow response of the oceans. 

The value for ECS obtained from global climate models varies by approximately a factor of two, with the ECS of models used in the 2007 IPCC report ranging from 2.1 to 4.4°C for doubled CO2.  This model sensitivity range is an emergent property of the models themselves, and arises due to the different approximations of physical processes which are built into each model.  However, this senstivity range has not changed significantly over the past two decades, despite climate models undergoing constant revisions.

Consensus of Evidence on Climate Sensitivity

It's important to note here that the full body of scientific evidence with regards to climate sensitivity - not just from models, but also from past climate changes thousands, tens of thousands, and even millions of years ago paints a very consistent picture that ECS falls somewhere in this range of about 2 to 4.5°C average global surface warming in response to an energy imbalance equivalent to that caused by a doubling of atmospheric CO2 (Figure 1).

Various estimates of climate sensitivity

Figure 1: Distributions and ranges for climate sensitivity from different lines of evidence. The circle indicates the most likely value. The thin colored bars indicate very likely value (more than 90% probability). The thicker colored bars indicate likely values (more than 66% probability). Dashed lines indicate no robust constraint on an upper bound. The IPCC likely range (2 to 4.5°C) and most likely value (3°C) are indicated by the vertical grey bar and black line, respectively.  Adapted from Knutti and Hegerl (2008).

Clouds Are an Important But Uncertain Feedback

Clouds and the feedback they exert by changing the Earth's reflectivity (albedo) are one of the primary factors in determining ECS, but the magnitude of the cloud feedback remains a fairly large uncertainty.  In fact, when climate contrarians like Richard Lindzen argue that climate sensitivity is low, they most frequently do so by arguing that clouds provide a large negative feedback, in which case they would offset much of the increased greenhouse effect and thus dampen future global warming.  Similarly, Spencer and Braswell (2011) treated clouds as an 'internal forcing' which they believe effectively behaves as a negative feedback.  However, Trenberth, Fasullo, and Abraham (2011) identified a number of problems in the Spencer and Braswell paper which render its conclusions incorrect and unsupportable.

Indeed as FT12 note, there is a growing body of evidence that in reality clouds act as a modest positive feedback, slightly amplifying global warming.  This is also consistent with most model simulations of the cloud feedback, but there remains a fairly wide spread in the possible value of this feedback.  Unfortunately, as FT12 discuss, the currently available observational cloud data are not very good.

"Constraining simulated clouds is a challenge, however, as clouds are complex and difficult to observe. The historical record is plagued by errors associated with the drift and failure of satellites, inconsistencies in the detection of clouds, and instrument biases. Moreover, clouds can vary not just in their bulk characteristics but also in their microphysical properties, for which global observations are lacking generally, and considerable uncertainty persists regarding the feedbacks of various cloud types that may occur in a changing climate."

Thus rather than examining clouds directly, FT12 take a different approach and instead look at the conditions in which clouds form. 

"Variations in clouds and relative humidity (RH) are inherently linked in nature, and the approach here is motivated by the fact that models generally use RH to parameterize clouds"

FT12 Methodology and Results

In a somewhat similar fashion to Spencer and Braswell (2011), FT12 compare simulations from multiple global climate models  to satellite observational data, and draw conclusions about climate sensitivity based upon model correlation to the real world.  However, FT12 show the results of all model runs, whereas Spencer and Braswell omitted the results of models with intermediate ECS, among other problems with their methodology.

FT12 use satellite data from the NASA Atmospheric Infrared Sounder (AIRS) and Clouds and the Earth's Radiant Energy System (CERES) to examine the relationship between seasonal changes in relative humidity (RH) in the dry subtropics and the Earth's albedo via cloud cover.  Karen Shell describes the process in a Science Perspective.

"In boreal summer, the location of maximum solar heating moves north, resulting in air ?ow across the equator. Warm, moist air rises, loses water through rain, moves north or south, and descends in the high-pressure subtropical zones as relatively dry air. The decreased RH makes condensation, and hence cloud formation, less likely. More sunlight is absorbed, leading to warming."

In particular, FT12 note that in the atmospheric layer at which the pressure is about 500 hectoPascals (hPa), there is a strong relationship between RH and clouds.  This is illustrated in Figure 2, which shows distinct broad atmospheric dry zones in the subtropics around 500 hPa in blue, compared to where climate models expect them to broaden in a warmer climate (dashed lines, with poleward broadening depicted by the two black arrows).

FS12 fig 2

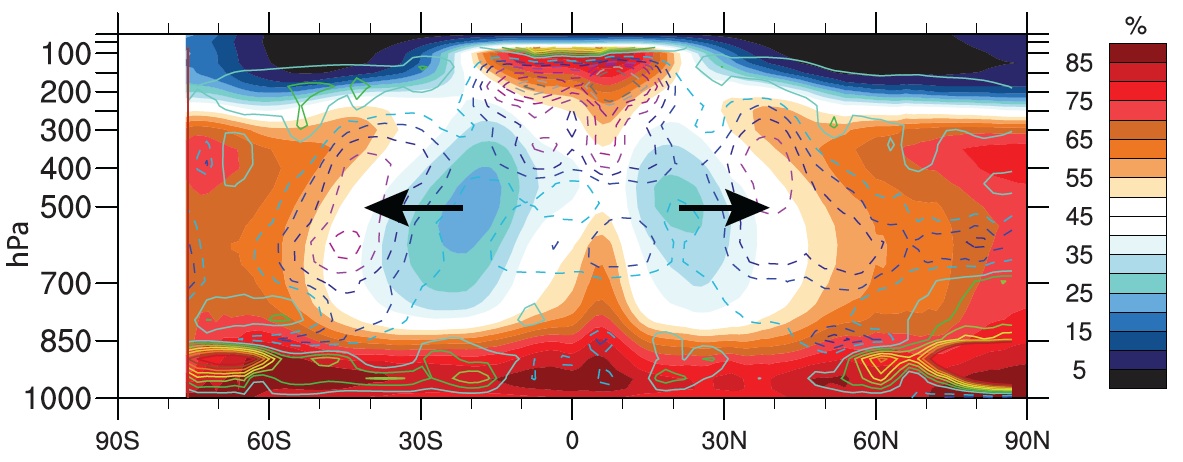
Figure 2: The zonal height structure over ocean of observed climatological annual mean RH from AIRS (2002–2007) (color scale), with model mean projected changes in cloud amount from the CMIP3 model archive (contour lines, 0.5% intervals, dashed for cloud loss). The cloud loss in a warming climate at about 40°N/S coincides with broadening of the dry zones, as indicated by the arrows.  Figure 2 from FT12.

FT12 then examine the correlation between ECS and model simulations of RH over all latitudes during a warming 21st Century.  In Figure 3, the latitudes at which the change in flux of infrared radiation at the top of the atmosphere is strongly correlated to ECS are depicted in red, including at subtropical latitudes.

FS12 fig 3a 

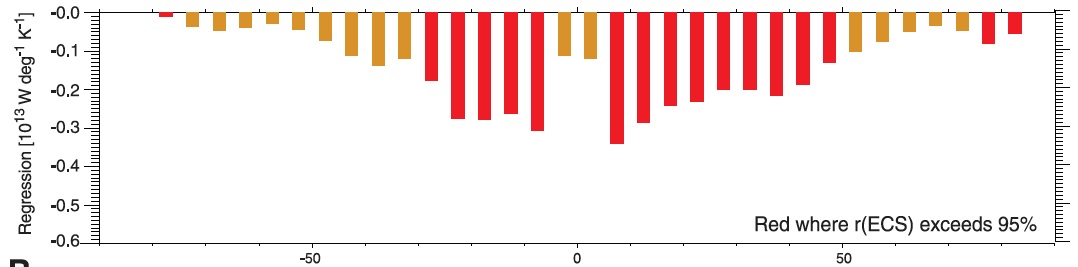
Figure 3: Median change in simulated top-of-atmosphere net shortwave flux as a function of latitude under 21st-century warming in CMIP3 SRES A1B projections. Red bars denote latitudes at which the change in net shortwave flux correlates with ECS at the 5% confidence limit.  Figure 3a from FT12.

A similar correlation can also be seen in present-day simulations in Figure 4, which shows the correlation between simulated May-August RH and model ECS for the period of 1980 to 1999.  The dark blue and dark red regions show the strongest negative and positive correlations, respectively, between RH and ECS.  The peak correlations are labeled in the dry (D) and moist (M) zones.

FT12 fig 3b 

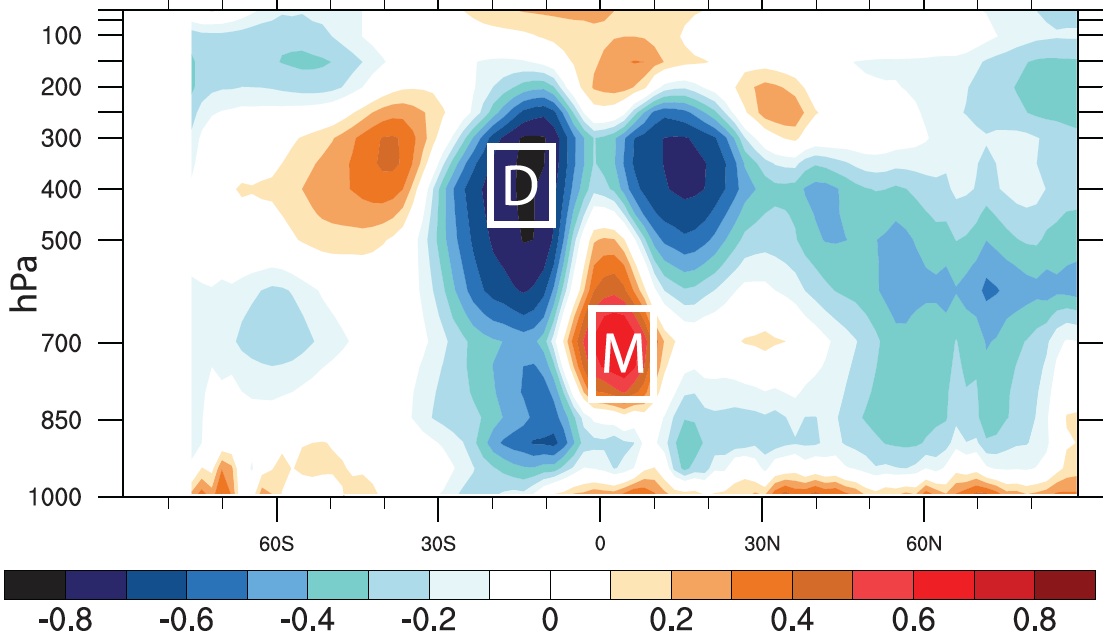
Figure 4: Zonal mean vertical structure of the correlation between present-day (1980–1999) simulated RH over ocean from May to August in CMIP3 models and ECS. Boxed regions highlight peak positive and negative correlations in the moist (M) and dry (D) zones, respectively, where the statistical significance of the relationships exceeds the 1% confidence limit.  Figure 3b from FT12.

High Sensitivity Models Best Simulate RH and thus Cloud Changes

FT12 note that "The correlations with RH are not only statistically significant but of sufficient magnitude to explain a considerable fraction of the variance in ECS across models."  They then examine the moist and dry regions in Figure 4 with the strongest correlations between RH and ECS to determine which models (and which ECS values) most accurately simulate the RH in those moist and dry zones (Figure 5).

FS12 fig 4

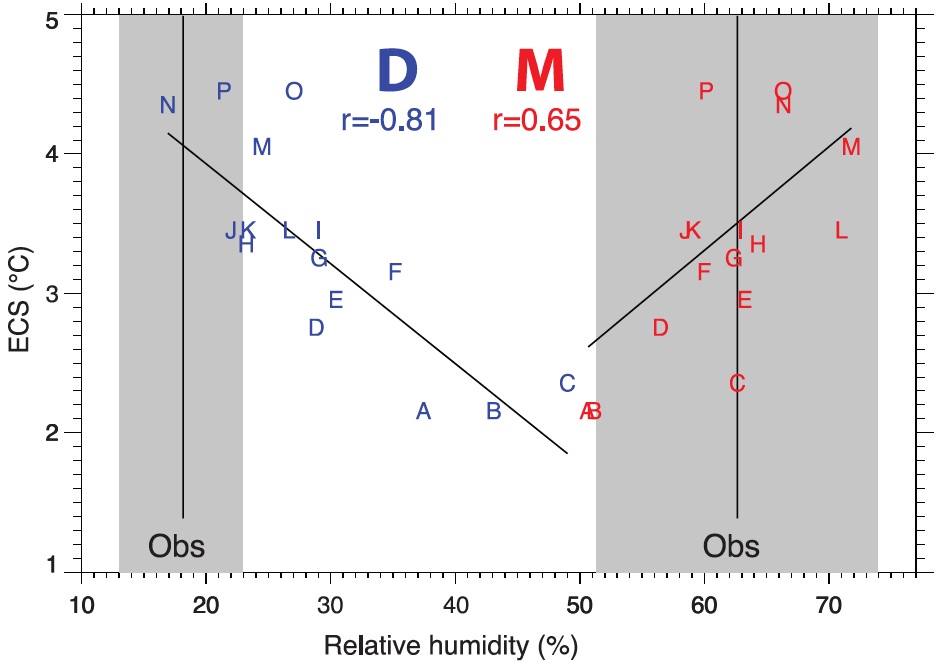
Figure 5:  Scatterplot of present-day simulated zonal mean RH over ocean from May to August in the dry (D) and moist (M) zones (Fig. 3) versus ECS. Mean observed values (vertical black lines) and their range (gray) are based on values from AIRS retrievals and the MERRA and ERA Interim reanalyses. Letters denote individual model runs from coupled 20th century runs. The correlations with ECS for each region are shown and indicated by the least-squares regression line. Observations and model values are based on climatologies from 1980 to 1999, except for AIRS, which is based on 2002–2007 data.  Figure 4 from FT12.

The range of RH uncertainty (the gray areas in Figure 5) is smaller for the dry region than the moist.  While the climate model RH simulations all fall within the range of observed values in the moist region, many of the models - specifically those with lower ECS - fall well outside of the range of observed RH values in the dry region.  From this, FT12 conclude as follows.

"These results suggest a systematic deficiency in the drying effect of either subsident circulations or spurious mixing of moister air into the region in low-sensitivity models that directly relate to their projected changes in cloud amount and albedo. Although the lower-sensitivity models are clearly at odds with observations, extrapolating the consequences of these model biases to climate sensitivity is nontrivial"

"...the results strongly suggest that the more sensitive models perform better, and indeed the less sensitive models are not adequate in replicating vital aspects of today’s climate. The correct simulation of the vertical structure of RH and clouds should be a prerequisite for developing confidence in projections for the future."

What it all Means - Catastrophe if We Don't Change Course

In short, while FT12 does not provide a specific measurement of climate sensitivity, it does suggest that the climate models with lower sensitivity (and 'low' here refers to approximately 2 to 3°C surface warming in response to doubled CO2, not the ridiculously low estimates of 1°C or less proposed by contrarians like Lindzen) are not accurately representing changes in cloud cover, and are therefore biased.  Climate models with higher sensitivity - in the 3 to 4.4°C ECS range for doubled CO2 - more accurately simulate the observational RH data and thus the response of subtropical clouds to climate change.

A climate sensitivity on the higher end of the likely range obviously does not bode well for the future of the climate.  As Fasullo told The Guardian, "our findings indicate that warming is likely to be on the high side of current projections." 

In terms of warming over the 21st Century, we are currently on track with IPCC emissions scenario A2, which corresponds to about 4°C warming above pre-industrial levels by 2100 if ECS is around 3°C for doubled CO2.  Note that's the warming models expect by the year 2100, but at that point there will still be a global energy imbalance, and thus additional warming will remain 'in the pipeline' until the planet reaches a new equilibrium.  An even higher ECS would correspond to even more warming, but anything greater than 4°C would almost certainly be catastrophic.

FT12 adds to the body of scientific evidence that we need to take serious action to reduce greenhouse gas emissions as soon as possible.  We still have time to change course and avoid climate catastrophe, but the evidence is building that time is running out fast.

0 0

Printable Version  |  Link to this page

Comments

Comments 1 to 20:

  1. Grim reading indeed. I've always hoped that sensitivity would converge at a value no higher than 3 C, although my guts have always thought that it would be higher. FS12 seems to imply that it could be appreciably higher than 3 C which, combined with the almost complete lack of action to date in addressing carbon emissions, bodes ill for our children and the biosphere in which they will live - such as that 'living' will be. I've said as much before and I'll say it again - an emergency response to AR5 is our last chance, else all our subsequent activities will simply be as aimless as Deck-chair Thimblerig on the Titanic.
    0 0
  2. The result of this study is indeed pessimistic if it concludes ECS > 3K However, Hansen 1988 was using ECS 4.2K, and it was shown to have overestimated the amount of current warming (Hansen's scenario B which turned out to be on track so far). Lesson learned from Hansen 1988 is: ECS should be 3.0K for his 1988 model to be spot on. Details were discussed here So, in the end, I'm not convinced that FS12 results are robust and bad news are inevitable. How do you reconcile FS12 with Hansen 1988?
    0 0
  3. chriskoz: The two results are pretty much independent - indeed now you have raised it, I think that adjustment of the Hansen'88 results on the basis of ECS is probably invalid. Over decadal timescales, climate response is represented by transient response (TCR), not ECS, and assuming the two covary is not necessarily warranted. Indeed Hansen & Sato (2011) speculates that TCR in models may be a bit off because the rate of ocean overturning is underestimated. AR4 finds signficiantly different TCR from pure physics models (~1.6) and empirically adjusted models (~2.2). (This is all from memory, I may have some of the details wrong). So Hansen'88 is dependent on TCR, whereas FS12 is classifying models by ECS. It would be really interesting to reclassify the models by TCR and see if the result is the same. It would also be really interesting to revisit the Hansen'88 discussion looking at the TCR of Hansen's '88 model. I don't know if they were reporting TCR at the time, however if someone has the forcings and the temperature projections for each scenario I could make a good estimate. It's a lot of work for a purely historical question though - given all the exciting current problems to work on I can't get very excited about it.
    0 0
  4. Early Pliocene: ~350ppm from range of papers. 3-5C hotter from general range of estimates. ECS for 100 years presuming all feedbacks being equal over the milenia time scales the earth has cooled 3-5C, for a 70ppm /175 ppm = 0.4 of a halving, therefore a halving produces ~7.5C cooling, ~60% occurs in a hundred years, so that is 4.5C in a 100 years, or a 100 year ECS of 4.5C at the lower estimates. So not really a great surprise that the CS is higher than thought and might also explain why the models have underestimating, melt, tropical expansion, extremes and so on. And also the permafrost melt is going to release lots fo CO2 for sure now as well. 350ppm, we are at 395ppm. What is the carbon budget? or How much more carbon is anyone prepared to spend?
    0 0
  5. First I want to say that the following is a product of my extreme pessimism and I want any who read this to know that I think we need to keep improving models and I applaud what Trenberth and others are doing and I expect them to keep it up… "...past climate changes thousands, tens of thousands, and even millions of years ago." That is what influences me. That is what I think about when I ponder what the future holds. Models are really important but they will always be an approximation of the real world. With better computers and better models we will get better predictions from the models. Climate changes thousand or tens of thousands of years ago are not in our league. In the past 800,000 years CO2 levels did not get much above 300 ppmv. Now about 3 million years ago, during the mid-Pliocene, CO2 was in our league. It was in the range of what we are currently at, about 390 to 400 ppmv. At equilibrium, the climate was about 2 to 3 degrees warmer and sea level was 35 meters higher than today. At that time the continents were in the same basic relative positions as today and ocean currents were mostly as today. That period of time has been extensively studied over the past 30 years or so with climate change in mind and the interpretation is solid. (I see that ranyl just mentioned the Pliocene warming. It is good to know that the information is out there so others can be informed) So, for me, all this talk about limiting warming to 2 degrees, or limiting sea level rise, or stopping the glaciers and ice sheets from melting, is all a bunch of fantasy arm-waving bureaucratic BS. The longer we wait to do anything the worse we can expect the outcome to be but we have already ensured a very bad outcome. We have the International Energy Agency making statements like: "No more than one-third of proven reserves of fossil fuels can be consumed prior to 2050 if the world is to achieve the 2 °C goal” Good luck with the magical temperature brake bureaucratic hogwash. Good luck with all the “we can prevent catastrophe” rah rah cheerleading. Since we are really doing nothing and since the best we can hope for is some sort of inadequate slowing of emission, not ending them, atmospheric concentrations will just keep rising. Sure, some sort of unforeseen process to take CO2 out of the atmosphere may come along but all I can think of when I hear that is: If wishes were horses, beggars would ride.
    0 0
  6. M Tucker @5, the temperatures and sea levels of the Pliocene represent the Earth System Climate Sensitivity, ie, the temperature response to forcing after all glaciers and ice sheets have reached equilibrium, and any changes to vegetation have also reached equilibrium. It is some consolation that the Charney (Equilibrium) Climate Sensitivity is between one and two thirds of the Earth System Response. The Charney Climate Sensitivity is the response after all rapid feedbacks (clouds, snow cover, water vapour etc) have reached equilibrium, but without changes to the albedo from the melt back of ice sheets or changes in land cover, and represents a good estimate of the near term (100-200 years) climate response to a change of forcing. The reason this is significant is that a large part of the additional CO2 added to the atmosphere by humans is drawn down into the ocean over a time scale of 200 hundred years. If we keep CO2 concentrations below 450 ppmv by 2050, and effectively cease all emissions thereafter, by 2250 CO2 concentrations will reduce to about 325 ppmv. After that it takes thousands of years for additional reductions in CO2, so we will face the full Earth System Response to the 325 ppmv; but only the Transient Climate Response (approx two thirds of the Charney Response) or the Charney (Equilibrium) Response at worst, to the full 450 ppmv. The upshot is that keeping the temperature increase below 2 degrees C is still a viable target, but we must act now. This is the time for urgency, not despair.
    0 0
  7. Even with the optimistic CS of 3C and dated models that excessively draw down CO2 (so hide warming), 450ppm still only gives a 50:50 chance of avoiding 2C or a 50:50 chance of being just about below 2C (>95% being above 1.8C), and a 50:50 chance of being above above as well with a much larger tale so 3-4C easily possible. Now with a CS higher than 3C and well 450ppm means no chance at all of avoiding 2C and lets face it 1.5C is looking mighty scarey considering what is already occuring, Arctic sea ice, total changes in weather patterns and weather extremes weekly, and so on and so on. And in my previous post, my ECS was the 100 year as it was 60% of the total warming, (Hansen more recently estimated 80% so my estimates are optimistic), and thus why 350ppm gives 1.8C to 3C, and 350ppm is the most realistic estimate not 390-400ppm and 3-5C is the most reasonable estimates from most proxies for the Pliocene, (deep water tropical give 2-4C as per Hansen), but even that is no comfort as CO2 in the early Pliocene was still 350ppm and thus 20-25m sea level rise, no ice NH and a totally different climatic system in terms of tropcial boundaries etc....and look at what weather we are getting already! We have a carbon debt not a budget and that needs facing up to and asap. And don't forget the mass extinction human activities has also induced which is accelerating as well. Just pointing it all out. 450ppm for me even at 50:50 optimistic estimates is far to much risk considering the stakes, indeed 1.5C seems like an amount that is going to push the adaptive capacity of the human civilzation (e.g. New York would have to be moved for sure). Also the ascertions about the albedo changes taking eons are more hope than reality. I would suggest people read the meltfactor blog, consider the very large size of the Arcitc ocean and the very high summer insolation levels, consider the rapid loss of snow cover in occuring also, consider the rapidly changing albedo on Greenland due to surface water, and so on...and also consider that the alebedo shift from now to the Pliocene was basically just the Greenalnd Ice sheet and seasonal ice covers of snow and ice, not the large ice sheets of the last ice age. I agree we must act now, but also we have to accept we have a carbon debt not a budget.
    0 0
  8. Tom Curtis @6, thanks for your response. If I am not mistaken we are increasing atmospheric CO2 at a rate of between 2 to 3 ppmv per year. What is the rate CO2 is taken up by the oceans? Given the response the world has show to even slow CO2 emissions, I’m thinking we will reach 450 before 2050. I’m also thinking the oceans and the atmosphere will continue to warm as we go forward. Warmer oceans means less CO2 will go into solution. In fact some scientists have said the oceans are even now absorbing less. So, now taking an optimistic pov, I wonder how much do we need to reduce emissions by in order to keep CO2 below 450 by 2050? And I am aware that we cannot just cut emissions while we continue to cut down the forests. We must take the forests into account with the bookkeeping. Now, going back to my natural pessimistic state, since we have already seen an alarming amount of ice melting with much less than 2 degrees of warming, I wonder what we will see as we approach the magic 2 degree number? I wonder how much more will the desert climate zones expand? I wonder how much more extreme will the already extreme weather events become? That said Tom, I sure hope we are able to at least keep the warming at or below 2 degrees regardless of what sort of climate change results from that. I sure hope someone has found the temperature brake and is keep their hand on it.
    0 0
  9. M Tucker @8, we are currently increasing atmospheric CO2 at an average rate around 2 ppmv. If we reduce that rate by 2.6% per annum (necessary to reduce the emissions to zero by 2050), we will increase the atmospheric concentration of CO2 to about 430 ppmv. Of course, if we do not start making significant reductions, we will overshoot the 450 ppmv mark well before 2050. The oceans do in fact absorb less as they warm, but so far the difference is small. Indeed, currently a greater fraction of human emissions are absorbed than in the early twentieth century, presumably because the increased absorption due to imbalanced partial pressures of CO2 has exceeded the reduction in absorption due to a warming ocean. Consequently, this effect is unlikely to represent a tipping point between now and 2050. The increased outgassing from tundra and marine clathrates is a different and more concerning problem. Currently, however, the emissions are small compared to human emissions and we can hope that they remain that way if we keep temperatures under 2 C.
    0 0
  10. Tom Curtis at #9 said: "The increased outgassing from tundra and marine clathrates is a different and more concerning problem. Currently, however, the emissions are small compared to human emissions and we can hope that they remain that way if we keep temperatures under 2 C." We can hope, but hope is not likely to stop the physics, biology and chemistry that is driving tundra and clathrate melt (unfortunately). There was an excellent discussion here a couple weeks ago of a new paper on permafrost feedback (MacDougal et al. iirc) that concluded that just the CO2 from the top 3 meters of permafrost melting would lead to CO2 levels remaining at about current levels _even if all CO2 from ff burning stopped completely next year_. Action to stop carbon un-sequestration is imperative, but we should remain honest about how dire the conclusions from the science seem to be getting.
    0 0
  11. wili@10, I assume you're referring to This study. I don't have access to full text so I cannot have an opinion about it. So I have some questions about the validity of their conclusions: 1. From the abstract:
    "We show that the additional surface warming generated by the feedback between permafrost carbon and climate is independent of the pathway of anthropogenic emissions"
    How come? We know from logarithmic dependency between CO2 and dT, that in case anthropogenic emissions are large, the extra emissions from permafrost will be relatively minor. 2. They are talking long-term equilibrium (by 2300AD) warming due to positive permafrost feedback. Do they also consider negative feedback in land-cover (i.e. the land occupied by permafrost will become lush forest that will bind back the CO2 emitted)? 3. IMO, the equilibrium/earth system response CO2 level and T increase depend largely on carbon cycle perturbation. In that context, the FF carbon (100Ma old) perturbation is far more significant than the perturbation from melting permafrost C (just 1000s yold).
    0 0
  12. Kevin@3, Thanks for the clarification. Indeed, I can see now & agree that Hansen 1988 was considering TCR (decade time-scale) rather than ECS (centennial time-scale) as in FS12, so direct comparison of those two makes little sense.
    0 0
  13. chriskoz@11, Good to see someone taking an active interest in this important study. At your point one, you say: "the extra emissions from permafrost will be relatively minor." I assume by this you mean "extra heating from emissions from permafrost will be relatively minor" If so, then, yes, if we have already thoroughly cooked the planet by burning fossil fuels, the extra carbon released from the permafrost will only manage to singe it a bit further. As to your #2, tall vegetation in that region can actually serve to increase local warming, since it sticks up above the snow cover and changes albedo in the fall and spring. (This is effect is already underway in some areas.) Also, keep in mind that the carbon that could be released from this one source (terrestrial permafrost) is equivalent to all the carbon in all the terrestrial plants that now exist. So a bit more plant matter above ground is not going to re-sequester enough carbon to make up for the massive amounts that will be lost from the permafrost. Recall that much of the tundra is much thicker than three meters. So it becomes a surface-versus-volume problem, and volume here, of course, wins out. As for #3, I never said that permafrost carbon was more 'significant' than the permafrost carbon, whatever exactly that would mean. Just that, as I read their graphs, the MacDougal article seems to indicate that even at a climate sensitivity of 3 degrees C per doubling of CO2, and even just counting this one major carbon feedback (CO2 from top 3.5 meters of terrestrial permafrost), we end up with continued high levels of atmospheric CO2 for at least two centuries into the future, even if we stop all further burning of fossil fuels essentially immediately. --That isn't going to happen--not by a long shot --There are of course many other powerful carbon feedbacks that must be added to the equations and the graphs, even if we don't know exactly how strong they will be --The article above suggests that the climate sensitivity is closer to 4.5 than 3, which, according to the MacDougal article, spells _rising_ atmospheric CO2 levels for at least two centuries even if we stop burning fossil fuels tomorrow, and even if we only consider this one major carbon feedback (both being entirely unrealistic, of course). Again, thanks for your interest. And I'd be very much happy to be shown to be wrong on any of my points. So I would appreciate you (or anyone) taking a critical look at the whole matter and ideally telling me I have missed some crucial point or misunderstood some crucial concept. Best, wili
    0 0
  14. Chris Dudley at the open thread at RealClimate point out: "I missed this originally but it turns out that raypierre does not put a lot of stock in the new study by Trenberth and Fasullo. He ‘described the paper as “another useful data point on the spectrum of estimates of cloud sensitivity,” though not “an absolute game changer.” He pointed out, for example, that the correlation between water vapor and clouds was drawn from short-term seasonal fluctuations. Researchers cannot be certain that those same correlations would hold true in response to a doubling of carbon dioxide in the atmosphere in the future, Dr. Pierrehumbert added. “The whole problem is really the nature of the observations,” he said. “We don’t have long enough satellite records of cloud observations to really do this kind of study by directly looking at which models get the low clouds right, so we try to indirectly run around the inadequacies of the satellite record.”’" http://green.blogs.nytimes.com/2012/11/08/a-new-tweak-for-global-warming-predictions/
    0 0
  15. Question here...perhaps slightly OT but I do not have the expertise of most folks here so please bear with me. If you look at the graph on the Berkeley Earth web site that is called the "Global Land Surface Temperature 12-Month Moving Average" you see data fit to a function that follows volcanoes and is otherwise logarithmic. (1) There is one excursion of the data from the fit that is a broad peak centered at about 1940. Do you guys know what this is? Could it be the (possibly existing, possibly not existing) Atlantic multudecadal oscillation? If not the AMO what is it? (2) I have picked many points from this graph from regions away from the volcano dips and plotted the temperature increase versus log to the base two CO2 concentration ratio. I get a lovely straight line, excellent fit to the points, with climate sensitivity of close to 3 degrees C. I have an invitation to give a talk on AGW at a place which often invites denialgate types like Monckton. One or more of these characters might be in my audience.I would like to say that the BEST data shows experimentally that there is a short term C.S. of close to 3.0 degrees C. Therefore "clouds, shmouds" ....the cloud effects invoked by Spenser/by Lindzen are irrelevant to the over all picture.. A 3 degree C.S. comes from the BEST data. Also, you no longer really need a simulation to make the point. You get a C.S. of 3 degrees C from the BEST data experimentally. By you real climatologists here , is my point then valid from the argument I give?
    0 0
  16. wili@13, I think you're exaggerating the findings of MacDougal article, and unnecessarily compare it to the FT12, which is subject of this thread. Especially, with respect to your assertion:
    "The article above suggests that the climate sensitivity is closer to 4.5 than 3, which, according to the MacDougal article, spells _rising_ atmospheric CO2 levels for at least two centuries even if we stop burning fossil fuels tomorrow"
    This article is about ECS, while permafrost feedback within next two centuries will be driven by the temperatures from today till say 2050 (permafrost feedback is that slow) thus transient sensitivity influences permafrost. In general, I agree with you that permafrost feedback will be dreadful and unstoppable once started. But I think MacDougal whom you base your opinion on, overestimated the rate of permafrost melt. From their abstract I read "permafrost soils will release between 68 and 508 Pg carbon by 2100", although I don't know under what conditions, and what dynamics (not stated). Wheareas this study quantifies the permafrost feedback as 190 ± 64 Pg C by 2200. And that is under the assumption of scenario A1B, unlike whay you are suggesting above. So, a pessimistic anthropogenic warming essentially without curtailing FF. If we "stop all further burning of fossil fuels essentially immediately" as you are suggesting above, then CO2 levels out much smaller & anthropo warming will be lower, therefore perma feedback my be insignifficant. So, my botomline take on it is: current permafrost C flux is very small, it can grow to apocalyptic size under A1-type scenario but there is not point to despair yet: if we avoid such scenario by quick and efficient cease of FF emissions, we can also aviod permafrost feedback. The are large uncertainties about the precise modeling of PF. MacDougal apears to have estimated it on a high side. As usual, the insurance principle applies to thie PF scenario: the bigger the threat the more comprehensive insurance policy is needed, i.e. stop the FF emissions now because PF may kick in.
    0 0
  17. Thanks for the link to that article, christkoz. Basically, we end up with competing claims, both by legitimate researches. Without the full scientific background to fully evaluate the merits, I tend to assume the most recent science is likely to be an improvement on previous science. But it is surely important not to place too much weight on any one study, one way or the other. John Doe has a link to the whole (short) MacDougall article--about the 18th comment down: http://tamino.wordpress.com/2012/10/04/oh-shit/#comments Here's hoping that your article and interpretation is right.
    0 0
  18. Will @13 You assume that carbon released from thawing permafrost will be in the form of CO2. In the case of releases from peatlands and marshes, this is likely due to the presence of methanotrophic bacteria associatied with sphagnum mosses. However releases from shallow clathrate and yedoma, particularly where covered by a shallow water surface, typical of the Siberian continental shelf off-shore and thermokarst landscapes on-shore, will reach the atmosphere as CH4. It is already doing so. CH4 is a far more potent greenhouse gas with a GWP of 72 over its first 20 years in the atmosphere. Its continued and accelerating emission will certainly exacerbate AGW far more significantly than believed by those who remain wedded to the fiction that we can limit AGW to no more than 2°C by 2100.
    0 0
  19. Hi Ag, Above you wrote of me: "You assume that carbon released from thawing permafrost will be in the form of CO2." In fact, I assume no such thing. It was MacDougall et al. who chose to restrict themselves to only CO2 emissions from only terrestrial permafrost, and only from the top 3.5 meters of that (in some places it is much much deeper, nearly a mile deep, iirc). And they restricted their study in this way quite consciously. IIRC, they have a section in the paper where they explain that their results are likely quite conservative, precisely because they left out the sources you mention, along with some other things. It apparently is still too much to try to factor in all the very real carbon feedbacks that you mention and get a robust, reliable result, I guess. That is what I (but apparently it was just me) found to be so terrifying about their findings-- Adding just this narrow additional carbon feedback, and assuming an almost certainly too conservative 3 degrees C climate sensitivity for a doubling of carbon, and making the entirely unrealistic hypothetical assumption that we will stop all ff emissions of CO2 starting 2013-- making all these unrealistically happy assumptions, they still come to the conclusion that atmospheric CO2 levels will remain at the extremely high levels that they are at now for as far out as they could look (about two centuries). >If you add any fraction of any of the other enormous carbon sources that we know for a certainty will start to kick in soon if they have not done so already, >or if you raise climate sensitivity even slightly (as proposed very reasonably by Lunt et alia 2010, for example), >or if you make the blindingly obvious point that all CO2 emissions from burning fossil fuels will not, in fact, end next year ...if you wiggle the least tiny bit toward what we know absolutely to be pretty indisputable reality on any one of these fronts, then MacDougall, as far as I can see, puts us solidly past a crucial tipping point into what I would call runaway global warming: where even if we stop all further human caused emissions, atmospheric CO2 levels--and so global temperatures--continue to rise into the indefinite future--but not forever, obviously--because of the feedabacks that are already starting to kick in (it's not just me, actually; Steven Chu uses essentially this definition of runaway global warming in a video talk he did on the subject). By the way, though your figure of 75 x CO2 is widely used and it still shows up on, for example, Wikipedia (last I checked), Schindell et alia (2006) claims a global warming potential for methane of 105 times that of CO2 over 20 year intervals (35x over century time periods). So, by and large, I agree with you, and then some. What I continue to be most puzzled by, however, is the failure of most monitoring devices in the Arctic region to consistently detect the kinds of increases in atmospheric methane levels one would expect based on reports of scientists like Semiletov, Shakhova and others of enormous kilometer wide plumes of methane exploding form the ocean, and seas "bubbling as if boiling" with methane. I hope the monitors are right and these reports and scientists were wrong, because otherwise we can truly expect this year's extreme weather to not just be the new normal, but become rapidly more extreme essentially every year for centuries or millenia--no matter what we do (or more like manage to stop doing).
    0 0
  20. Will … Thanks for your comments More recent work, eg. Reisinger et al (2011) suggests GWP for CH4 of ~86 this century and I think this value is broadly accepted. I was just being conservative by sticking with the IPCC value of 72. I agree with your analysis and concern about the adequacy of monitoring CH4 emissions and regional atmospheric concentration in the Arctic. Regarding emissions, I note that recent descriptions of plumes emerging from the East Antarctic Continental Shelf are based on reliable eye-witness accounts. I also note that Dr Shakhova and others have repeatedly called for improved, continuous monitoring of CH4 in the Arctic, particularly along the Russian coast. To-date, her calls in this regard appear to have been ignored, though I predict that as CH4 emissions increase, as they will, this will be rectified.
    0 0

You need to be logged in to post a comment. Login via the left margin or if you're new, register here.


The Consensus Project Website

THE ESCALATOR

(free to republish)


© Copyright 2024 John Cook
Home | Translations | About Us | Privacy | Contact Us