A new study by Jones, Stott, and Christidis of the UK Met Office (Jones et al. 2013) examines the causes of global warming by using global climate model simulations from the World Climate Research Programme’s Coupled Model Intercomparison Project phase 5 (CMIP5) and comparing those model results to observed global surface temperatures. CMIP5 is one of the largest collaborative efforts for bringing together climate model data for access by climate scientists across the world. The prior phase, CMIP3 was used heavily in studies included in the 2007 Intergovernmental Panel on Climate Change (IPCC) Fourth Assessment Report, while CMIP5 is used in many studies evaluated in the upcoming IPCC Fifth Assessment report, due out in 2013.
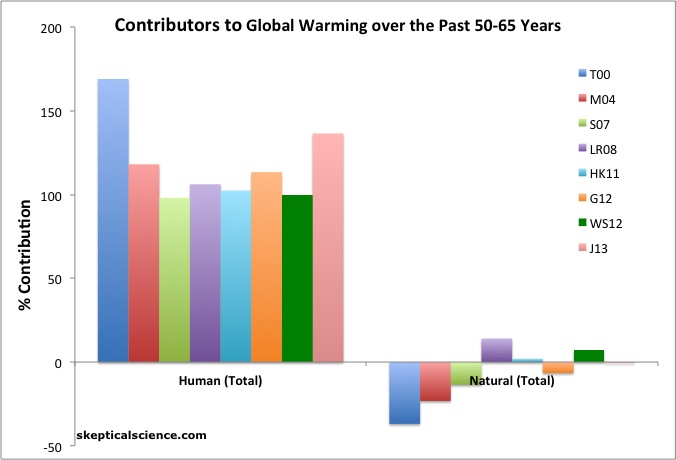
Over the past 60 years (1951–2010), the study finds that global average surface temperatures have warmed 0.6°C, while in climate models, greenhouse gases caused between 0.6 and 1.2°C surface warming. This was offset by a cooling from other human influences (mainly from aerosols) of 0 to 0.5°C. These results are consistent with all prior studies of the causes of global warming (Figure 1).
Figure 1: Net human and natural percent contributions to the observed global surface warming over the past 50-65 years according to Tett et al. 2000 (T00, dark blue), Meehl et al. 2004 (M04, red), Stone et al. 2007 (S07, light green), Lean and Rind 2008 (LR08, purple), Huber and Knutti 2011 (HK11, light blue), Gillett et al. 2012 (G12, orange), Wigley and Santer 2012 (WS12, dark green), and Jones et al. 2013 (J12, pink).
The climate model runs considering all external influences on global surface temperatures (mainly greenhouse gases, aerosols, the sun, and volcanic eruptions) simulate the observed temperature changes accurately (Figure 2).
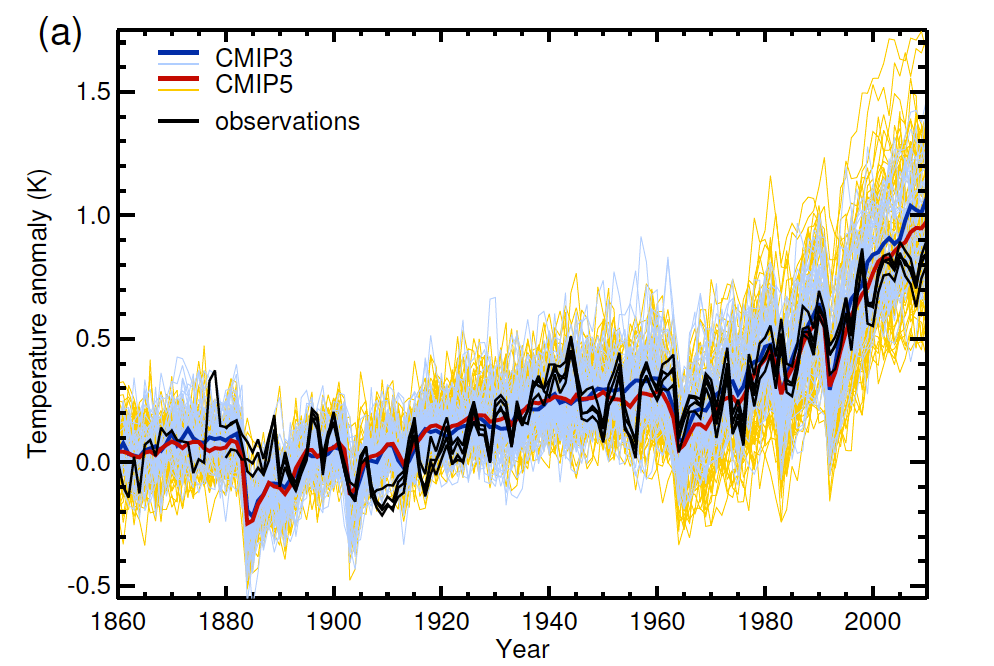
Figure 2: Global annual mean surface air temperature for CMIP3 (thin blue line) and CMIP5 (thin red line) for all external temperature influences (forcings) compared to the four observational datasets (black lines). The weighted ensemble average for CMIP3 (blue thick line) and CMIP5 (red thick line) are estimated by given equal weight to each model’s ensemble mean. All model and observed data have same spatial coverage as HadCRUT4. The baseline is 1880–1919. Figure 4a from Jones et al. 2013.
The average of the models does overestimate the observed surface warming over the past decade. This is why the sum of human and natural contributions from Jones et al. 2013 exceeds 100% in Figure 1 – because the modeled warming slightly exceeds the observed warming.
As we have previously discussed, this is mainly due to the preponderance of El Niño events in the 1990s and La Niña events in the 2000s. This internal variability has had a cooling effect on recent surface temperatures (though not of overall global temperatures) which is not captured in the average of the model simulations. However, it is within the range of all individual model simulations, as is evident by the fact that the observational data in Figure 2 (black) falls within the envelope of CMIP5 model simulations (yellow).
The study also runs simulations for just natural temperature influences (Figure 3), and just greenhouse gas temperature influences (Figure 4).
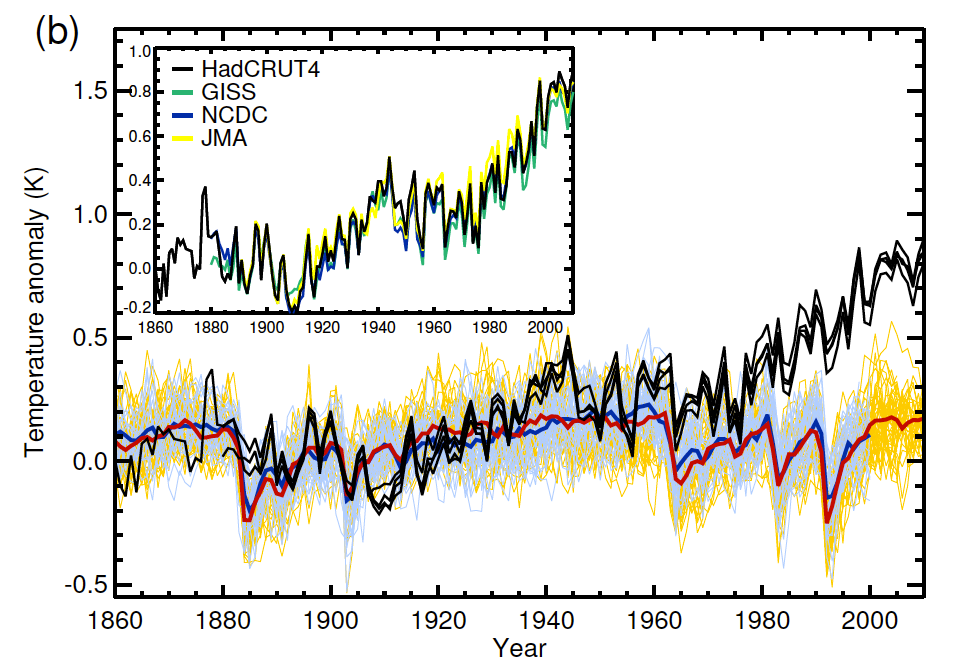
Figure 3: Global annual mean surface air temperature for CMIP3 (thin blue line) and CMIP5 (thin red line) for all natural external temperature influences (forcings) compared to the four observational datasets (black lines). The weighted ensemble average for CMIP3 (blue thick line) and CMIP5 (red thick line) are estimated by given equal weight to each model’s ensemble mean. All model and observed data have same spatial coverage as HadCRUT4. The baseline is 1880–1919. Figure 4b from Jones et al. 2013.
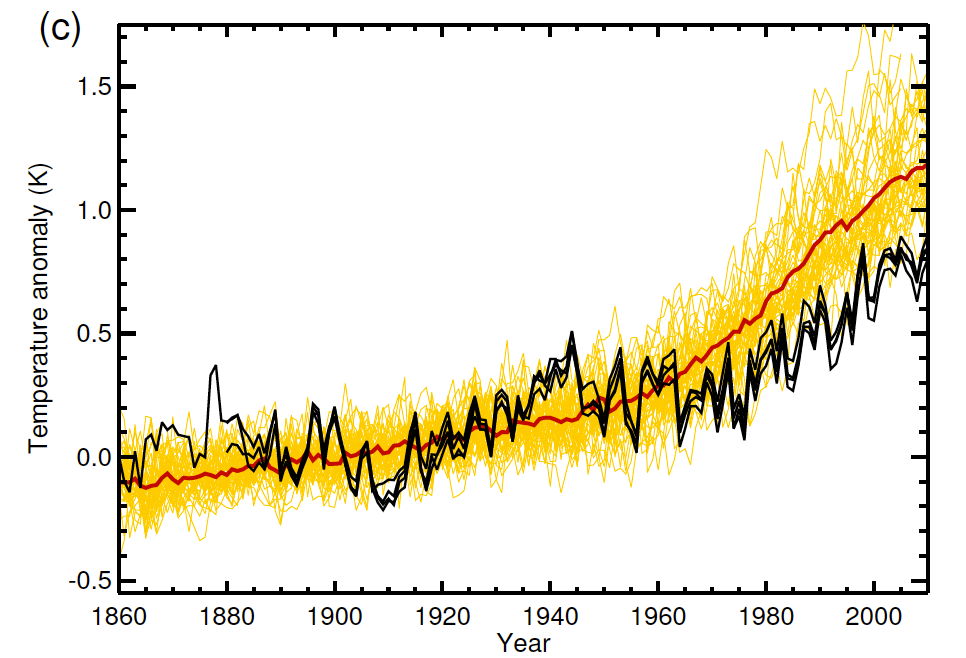
Figure 4: Global annual mean surface air temperature for CMIP5 (thin red line) for greenhouse gas temperature influences (forcings) compared to the four observational datasets (black lines). The weighted ensemble average for CMIP5 (red thick line) is estimated by given equal weight to each model’s ensemble mean. All model and observed data have same spatial coverage as HadCRUT4. The baseline is 1880–1919. Figure 4c from Jones et al. 2013.
The main messages from these two figures are that natural temperature influences cannot account for the observed global warming, especially over the past 50 years, and that greenhouse gases have caused more warming than has been observed, meaning that the net non-greenhouse gas effect is a cooling one (mainly from human aerosol emissions).
The study notes that the spread of CMIP5 model runs is a bit larger than the CMIP3 envelope (yellow vs. blue in Figure 2), possibly because models now include
"...a much wider exploration of aerosol uncertainty than previously carried out in models that now include a much more sophisticated treatment of aerosol physics.
Despite this wider spread of model results, calculations of attributable temperature trends based on optimal detection support previous conclusions that human-induced greenhouse gases dominate observed global warming since the middle part of the 20th century."
Overall, Jones et al. (2013) concludes that greenhouse gases have caused between 100% and 200% of the observed global surface warming over the past 60 years, and other human influences (primarily aerosols) have offset a significant percentage of that warming via cooling effects. Natural temperature influences have had a very slight cooling effect, and natural internal variability appears to have had a fairly significant cooling effect over the past decade, but little temperature influence over longer timeframes.
The results of this study are consistent with the wide body of evidence supporting the settled science that human greenhouse gas emissions are the dominant cause of the current global warming.
Posted by dana1981 on Monday, 18 March, 2013
 |
The Skeptical Science website by Skeptical Science is licensed under a Creative Commons Attribution 3.0 Unported License. |