Climate Science Glossary

Term Lookup

Enter a term in the search box to find its definition.

Settings

Use the controls in the far right panel to increase or decrease the number of terms automatically displayed (or to completely turn that feature off).

Term Lookup

Settings


All IPCC definitions taken from Climate Change 2007: The Physical Science Basis. Working Group I Contribution to the Fourth Assessment Report of the Intergovernmental Panel on Climate Change, Annex I, Glossary, pp. 941-954. Cambridge University Press.

Home Arguments Software Resources Comments The Consensus Project Translations About Support

Twitter Facebook YouTube Mastodon MeWe

RSS Posts RSS Comments Email Subscribe


Climate's changed before
It's the sun
It's not bad
There is no consensus
It's cooling
Models are unreliable
Temp record is unreliable
Animals and plants can adapt
It hasn't warmed since 1998
Antarctica is gaining ice
View All Arguments...


Username
Password
New? Register here
Forgot your password?

Latest Posts

Archives

The human fingerprint in global warming

What the science says...

Select a level... Basic Intermediate Advanced

Fundamental physics and global climate models both make testable predictions as to how the global climate should change in response to anthropogenic warming. Almost universally, empirical observations confirm that these 'fingerprints' of anthropogenic global warming are present.

Climate Myth...

It's not us

'What do the skeptics believe? First, they concur with the believers that the Earth has been warming since the end of a Little Ice Age around 1850. The cause of this warming is the question. Believers think the warming is man-made, while the skeptics believe the warming is natural and contributions from man are minimal and certainly not potentially catastrophic à la Al Gore.' (Neil Frank)

Surface Temperature Change

Back in 1988, NASA's James Hansen made some of the first projections of future global warming with a global climate model (Hansen 1988). He created 3 scenarios which he called Scenarios A, B, and C which used various possible future greenhouse gas emissions levels. Scenario A used a model with accelerating greenhouse gas emissions, Scenario B had linearly increasing emissions, and Scenario C had emissions leveling off after the year 2000. None of these models ended up matching greenhouse gas emissions exactly right, but the radiative forcing (energy imbalance) in Scenario B was closest, too high by about 10% as of 2009. Additionally, the climate sensitivity in Hansen's 1988 model (4.2°C global warming for a doubling of atmospheric CO2) was a bit higher than today's best estimate (3°C warming for CO2 doubling).

Hansen's Scenario B projected a global warming trend from 1984-2009 of 0.26°C per decade. The actual trend as measured by surface temperature stations over that period was about 0.2°C per decade. When corrected for the 10% smaller radiative forcing than Scenario B and the higher climate sensitivity in Hansen's models, his study projected the global warming over the ensuing 25 years almost perfectly.

Meehl et al. (2004) took a different approach. Instead of projecting future surface temperature change, they used climate models to attempt to attribute past temperature changes in a method known as 'hindcasting' (as opposed to forecasting). In their study, Meehl et al. show that natural forcings cannot account for the increase in global temperatures in the second half of the 20th century, and that models using both natural and anthropogenic forcings model the temperature change over the 20th century most accurately.

"The late-twentieth-century warming can only be reproduced in the model with anthropogenic forcing (mainly GHGs), while the early twentieth-century warming is mainly caused by natural forcing in the model (mainly solar)."

Meehl 2004 figure

Figure 1: Anthropogenic plus natural vs. just natural radiative forcing temperature change vs. observed global surface temperature increase (Meehl 2004)

A number of studies using a variety of different statistical and physical approaches have, like Meehl 2004, estimated the human and natural contributions to global warming.  They universally find that humans are the dominant cause of the observed global warming over the past 150 years, 100 years, 50 years, 25 years, etc.  In fact, many conclude that natural effects have actually been in the cooling direction in recent decades (Figure 2).

attribution 50 yr

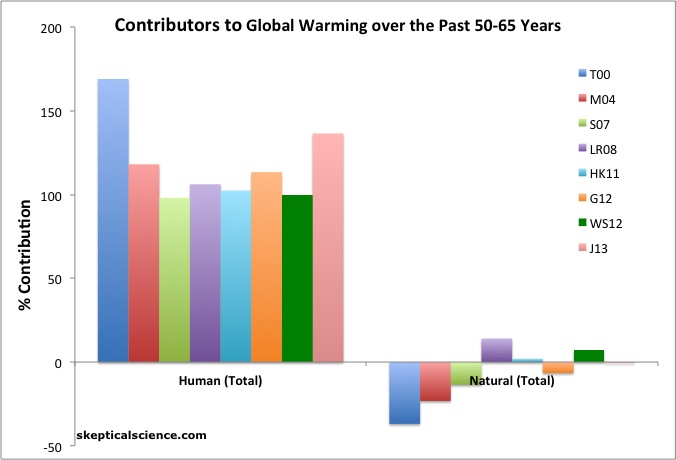
Figure 2: Net human and natural percent contributions to the observed global surface warming over the past 50-65 years according to Tett et al. 2000 (T00, dark blue), Meehl et al. 2004 (M04, red), Stone et al. 2007 (S07, light green), Lean and Rind 2008 (LR08, purple), Huber and Knutti 2011 (HK11, light blue), Gillett et al. 2012 (G12, orange), Wigley and Santer 2012 (WS12, dark green), and Jones et al. 2013 (J12, pink).

Stott (2003) took yet another approach, examining surface temperature changes region-by-region across the planet and comparing them to how climate models predicted they should have changed. Stott found that regional temperature changes could also be traced back to anthropogenic global warming.

"The causes of twentieth century temperature change in six separate land areas of the Earth have been determined by carrying out a series of optimal detection analyses. The warming effects of increasing greenhouse gas concentrations have been detected in all the regions examined, including North America and Europe….Our results show significant anthropogenic warming trends in all the continental regions analyzed. In all these regions, greenhouse gases are estimated to have caused generally increasing warming as the century progressed, balanced to a greater or lesser degree, depending on the region, by cooling from sulfate aerosols in the middle of the century."


Stott 2003

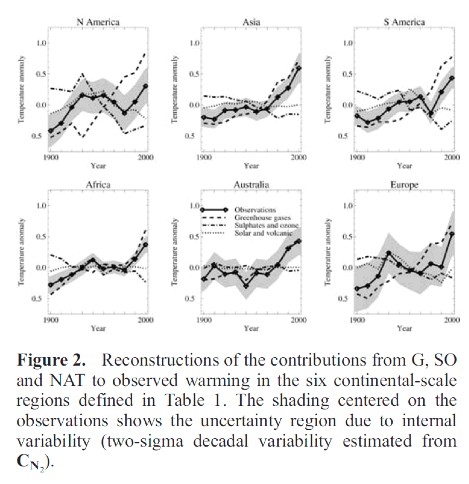
Figure 3: Regional surface temperature changes (Stott 2003)

More warming at night than day

Climate models predict that as a consequence of anthropogenic global warming, the planet should warm more at night than during the day. This is also known as a decreasing diurnal temperature range (DTR – the difference between minimum and maximum daily temperature). Braganza et al. (2004) investigated the changes in DTR over the past 50 years and concluded as follows:

"Observed DTR over land shows a large negative trend of ~0.4°C over the last 50 years that is very unlikely to have occurred due to internal variability. This trend is due to larger increases in minimum temperatures (~0.9°C) than maximum temperatures (~0.6°C) over the same period. Analysis of trends in DTR over the last century from five coupled climate models shows that simulated trends in DTR due to anthropogenic forcing are much smaller than observed. This difference is attributable to larger than observed changes in maximum temperatures in four of the five models analysed here, a result consistent with previous modelling studies."

Essentially Braganza et al. found that that while DTR is decreasing as expected by climate models, it’s decreasing more than they predicted because daytime temperatures are increasing less than they predict, possibly because the models omit changes in the Earth’s reflectivity from factors like cloudcover and land use change. Here you can see the observed changes in maximum, minimum, mean global temperature, and DTR vs. predictions by the four climate models used in the study.

Braganza 2004

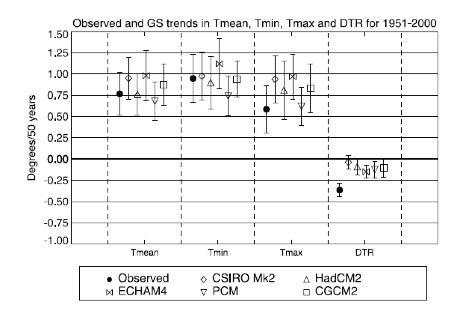
Figure 4: Observed vs. modeled temperature trends (Braganza et al. 2004)

Stratospheric Temperature Change

As the lower atmosphere warms due to an enhanced greenhouse effect, the upper atmosphere is expected to cool as a consequence. The simple way to think about this is that greenhouse gases are trapping heat in the lower atmosphere. Since less heat is released into the upper atmosphere (starting with the stratosphere), it cools.

Jones et al. (2003) investigated the changes in temperature over the past 4 decades at both the near surface (troposphere) and stratosphere layers, and compare them to changes predicted by a coupled atmosphere/ocean general circulation model, HadCM3. They concluded as follows.

"Our results strengthen the case for an anthropogenic influence on climate. Unlike previous studies we attribute observed decadal-mean temperature changes both to anthropogenic emissions, and changes in stratospheric volcanic aerosols. The temperature response to change in solar irradiance is also detected but with a lower confidence than the other forcings."

Tropopause Height

The tropopause is the atmospheric boundary between the troposphere and the stratosphere. Observations indicate that the tropopause height has increased several hundred meters over the past 3 decades. Santer et al. (2003) investigated the causes of this change and concluded as follows.

"Comparable increases are evident in climate model experiments. The latter show that human-induced changes in ozone and well-mixed greenhouse gases account for ~80% of the simulated rise in tropopause height over 1979–1999. Their primary contributions are through cooling of the stratosphere (caused by ozone) and warming of the troposphere (caused by well-mixed greenhouse gases). A model predicted fingerprint of tropopause height changes is statistically detectable in two different observational (“reanalysis”) data sets. This positive detection result allows us to attribute overall tropopause height changes to a combination of anthropogenic and natural external forcings, with the anthropogenic component predominating."

Santer 2003

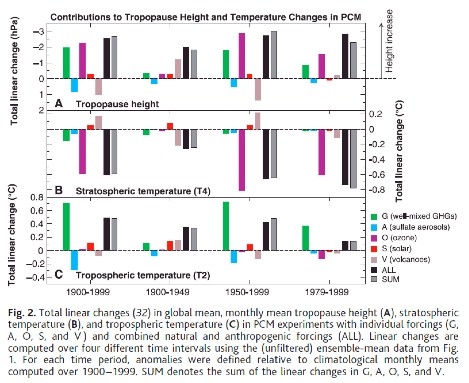
Figure 5: Changes in temperature and tropopause height in response to various radiative forcings (Santer et al. 2003)

Upper Atmosphere Temperature Change

The layers above the stratosphere are expected to cool as a result of global warming as well, for similar reasons (less heat reaching higher levels as it’s trapped in the lower atmosphere). Jarvis et al. (1998) investigated changes in the thermosphere and ionosphere in 1998 and concluded as follows.

"The estimated long-term decrease in altitude is of a similar order of magnitude to that which has been predicted to result in the thermosphere from anthropogenic change related to greenhouse gases."

Laštovicka et al. (2006) arrived at a similar conclusion.

"The upper atmosphere is generally cooling and contracting, and related changes in chemical composition are affecting the ionosphere. The dominant driver of these trends is increasing greenhouse forcing, although there may be contributions from anthropogenic changes of the ozone layer and long-term increase of geomagnetic activity throughout the 20th century. Thus, the anthropogenic emissions of greenhouse gases influence the atmosphere at nearly all altitudes between ground and space, affecting not only life on the surface but also the space-based technological systems on which we increasingly rely."

Lastovicka 2006

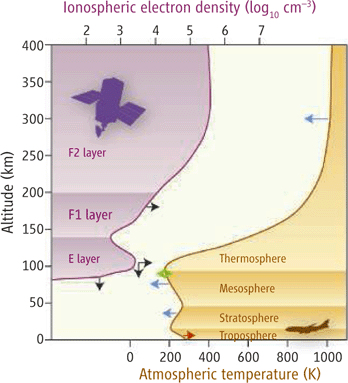
Figure 6: Atmospheric temperature and Ionospheric electron density vs. Altitude (Laštovicka et al. 2006)

Ocean Heat Content

Ocean heat content has increased significantly over the past 40 years. In fact, approximately 84% of the total heating of the Earth system over that period has gone into warming the oceans. Barnett et al. (2005) investigated the cause of this warming signal, and concluded as follows.

"[the increase in ocean heat content] cannot be explained by natural internal climate variability or solar and volcanic forcing, but is well simulated by two anthropogenically forced climate models. We conclude that it is of human origin, a conclusion robust to observational sampling and model differences. Changes in advection combine with surface forcing to give the overall warming pattern. The implications of this study suggest that society needs to seriously consider model predictions of future climate change."

Barnett 2007

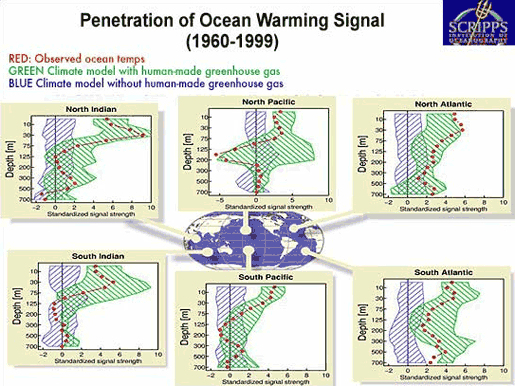
Figure 7: Modeled vs. Observed Ocean Temperature Changes

Sea Level Pressure

Gillett et al. (2003) compared observed changes in sea level pressure with those predicted by four coupled ocean–atmosphere climate models and concluded as follows.

"Here we detect an influence of anthropogenic greenhouse gases and sulphate aerosols in observations of winter sea-level pressure (December to February), using combined simulations from four climate models. We find increases in sea-level pressure over the subtropical North Atlantic Ocean, southern Europe and North Africa, and decreases in the polar regions and the North Pacific Ocean, in response to human influence….Overall, we find that anthropogenic greenhouse gases and sulphate aerosols have had a detectable influence on sea-level pressure over the second half of the twentieth century: this represents evidence of human influence on climate independent of measurements of temperature change."

Precipitation

Zhang et al. (2007) showed that models using natural + anthropogenic forcings do a much better job of matching observed precipitation trends than either natural or anthropogenic alone. The correlation with natural forcings alone is extremely weak - only 0.02. With anthropogenic alone is 0.69, and with both combined is 0.83 over the past 75 years.

"We show that anthropogenic forcing has had a detectable influence on observed changes in average precipitation within latitudinal bands, and that these changes cannot be explained by internal climate variability or natural forcing. We estimate that anthropogenic forcing contributed significantly to observed increases in precipitation in the Northern Hemisphere mid-latitudes, drying in the Northern Hemisphere subtropics and tropics, and moistening in the Southern Hemisphere subtropics and deep tropics. The observed changes, which are larger than estimated from model simulations, may have already had significant effects on ecosystems, agriculture and human health in regions that are sensitive to changes in precipitation"

Infrared Radiation

Increase in downward longwave radiation

Anthropogenic global warming is caused by an increase in the amount of downward longwave infrared radiation coming from greenhouse gases in the atmosphere. Philipona et al. (2004) measured the changes and trends of radiative fluxes at the surface and their relation to greenhouse gas increases and temperature and humidity changes measured from 1995 to 2002 at eight stations of the Alpine Surface Radiation Budget (ASRB) network. They concluded as follows.

"The resulting uniform increase of longwave downward radiation manifests radiative forcing that is induced by greenhouse gas concentrations and water vapor feedback, and proves the "theory" of greenhouse warming with direct observations."

Evans et al. (2006) took it a step further, performing an analysis of high resolution specral data which allowed them to quantitatively attribute the increase in downward radiation to each of several greenhouse gases. The study went as far as to conclude,

"This experimental data should effectively end the argument by skeptics that no experimental evidence exists for the connection between greenhouse gas increases in the atmosphere and global warming."

Decrease in upward longwave radiation

As the concentration of greenhouse gases in the atmosphere increases, we expect to see less infrared radiation escaping at the top of the atmosphere. Satellite observations have confirmed that the decrease in upward longwave radiation matches well with model predictions, including in Harries et al. 2001, Griggs & Harries 2004, and Chen et al. 2007, the latter of which concluded:

"Changing spectral signatures in CH4, CO2, and H2O are observed, with the difference signal in the CO2 matching well between observations and modelled spectra."

Increased greenhouse effect -  models vs observations
Figure 8: Increased greenhouse effect from 1970 to 2006. Black line is satellite observations. Red line is modeled results (Chen et al. 2007)

Increased top of the atmosphere energy imbalance

This increase in downward and decrease in upward infrared radiation is expected to create an enery imbalance. Trenberth et al. (2009) used satellite data to measure the Earth's energy balance at the top of the atmosphere (TOA) and found that the net imbalance was 0.9 Watts per square meter. (Wm-2) This figure is consistent with the calculations in Hansen et al. 2005 using ocean heat data.

"The predicted energy imbalance due to increasing greenhouse gases has grown to 0.85 ± 0.15 W/m2"

Trenberth 2009

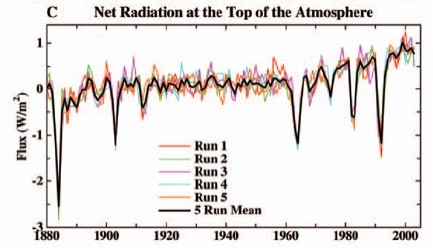
Figure 9: TOA Radiation (Trenberth et al. 2009)

Murphy et al. (2009) obtained a similar result.

"About 20% of the integrated positive forcing by greenhouse gases and solar radiation since 1950 has been radiated to space. Only about 10% of the positive forcing (about 1/3 of the net forcing) has gone into heating the Earth, almost all into the oceans. About 20% of the positive forcing has been balanced by volcanic aerosols, and the remaining 50% is mainly attributable to tropospheric aerosols. After accounting for the measured terms, the residual forcing between 1970 and 2000 due to direct and indirect forcing by aerosols as well as semidirect forcing from greenhouse gases and any unknown mechanism can be estimated as 1.1 ± 0.4 Wm-2."

Murphy 2009

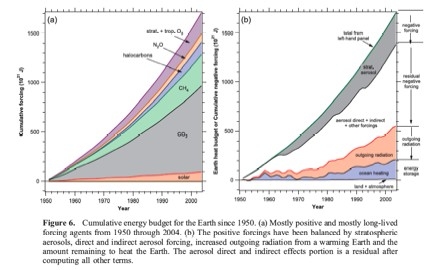
Figure 10: Cumulative energy budget for the Earth since 1950 (Murphy et al. 2009)

This is an impressively wide variety of global and regional climate change observations strongly matching the changes predicted by climate models and providing clear fingerprints of human-caused climate change.

Advanced rebuttal written by dana1981

Last updated on 11 July 2015 by MichaelK. View Archives

Printable Version  |  Offline PDF Version  |  Link to this page

Argument Feedback

Please use this form to let us know about suggested updates to this rebuttal.

Further reading

Professor Scott Mandia has a detailed explanation of why more CO2 causes stratospheric cooling that is well worth a read.

Denial101x video

Here is a related lecture-video from Denial101x - Making Sense of Climate Science Denial

Comments

1  2  3  4  5  Next

Comments 1 to 25 out of 114:

  1. What about stratospheric cooling? An increasing greenhouse effect means the surface and the troposphere should be warming, but the stratosphere should be cooling (because the troposphere is trapping more heat and stopping it from reaching the stratosphere). Satellite and weather balloon measurements indeed show a cooling trend in the stratosphere, the opposite of what would be expected if the Sun was causing global warming. And it looks like it isn’t caused by ozone depletion either.
  2. It seems very strange that the big umbrella arguments (“It’s not happening”, “It’s not us”, etc) are so far down the list. Why don’t all the instances of each sub-argument count towards the tally of its parent?
    Response: Initially when I submitted skeptic articles, I did include the umbrella arguments but I stopped doing it fairly early on - was just a bit tedious and I decided to focus on the specific argument being made. If anything, over time, I've even been dividing sub-arguments into sub-sub-arguments and getting narrower with the focus.

    I think I prefer this way - otherwise "It's not happening" and "It's not us" will be #1 and #2 which is a bit too general for my liking.
  3. I covered the stratosphere and other upper atmospheric layer cooling in the Advanced rebuttal, James.
  4. Will somebody please post a link to a paper that concludes that an increased greenhouse effect should increase Tmin faster than Tmax. That claim is NOT supported by the papers that are posted here. Instead the papers that are used as references either A) Don't attempt to attribute DTR changes or B) They attribute DTR changes to clouds, aerosols, or land surface changes. e.g Paragraph 15 of the paper cited above Braganza, K., D. J. Karoly, and J. M. Arblaster (2004), Diurnal temperature range as an index of global climate change during the twentieth century, Geophys. Res. Lett., 31
  5. Ptbrown31, the shrinking differential between day/night temperatures is entirely implicit in the mechanism of GHGs. You might ask yourself, how could it not be true that more "efficient" concentrations of GHGs in the atmosphere could leave evening temperatures unchanged? As to finding papers, you'll find plenty of links by via : Google Scholar
  6. doug_bostrom "You might ask yourself, how could it not be true that more "efficient" concentrations of GHGs in the atmosphere could leave evening temperatures unchanged?" Of course I am not implying that increased greenhouse gasses would leave evening temperatures unchanged I am implying that I do not think that there is an obvious reason that an increased greenhouse effect should increase evening temperature MORE than daytime temperatures. The Earth emits LW radiation at all times of day and in fact it emits MORE LW radiation during the day. So why is it "entirely implicit in the mechanism of GHGs"? Furthermore, I have indeed looked for papers in various search engines and I have consistently found that the literature attributes the changes in DTR to changes in one of a) clouds b) aerosols or c) land albedo. Here is another example: Stone, D. A., and A. J. Weaver (2002), Daily maximum and minimum temperature trends in a climate model, Geophys. Res. Lett., 29(9), 1356, doi:10.1029/2001GL014556. ABSTRACT: The recent observed global warming trend over land has been characterised by a faster warming at night, leading to a considerable decrease in the diurnal temperature range (DTR). Analysis of simulations of a climate model including observed increases in greenhouse gases and sulphate aerosols reveals a similar trend in the DTR of −0.2°C per century, albeit of smaller magnitude than the observed −0.8°C per century. This trend in the model simulations is related to changes in cloud cover and soil moisture. These results indicate that the observed decrease in the DTR could be a signal of anthropogenic forcing of recent climate change.
  7. 1. Humans are currently emitting around 30 billion tonnes of CO2 into the atmosphere. Check 2. Oxygen levels are falling as if carbon is being burned to create carbon dioxide. OK 3. Fossil carbon is building up in the atmosphere. (We know this because the two types of carbon have different chemical properties.) OK 4. Corals show that fossil carbon has recently risen sharply. I get it. 5. Satellites measure less heat escaping to space at the precise wavelengths which CO2 absorbs. Makes sense. Are they also checking to see if the waves that water vapor blocks are escaping less/more? 6. Surface measurements find this heat is returning to Earth to warm the surface. Duh 7. An increased greenhouse effect would make nights warm faster than days, and this is what has been observed. Pretty much the norm for warmer periods. More water vapor available does the same thing. We had a warm period this summer that was all about higher nighttime temps. We also had some of the the highest ever average dewpoints. 8. If the warming is due to solar activity, then the upper atmosphere (the stratosphere) should warm along with the rest of the atmosphere. But if the warming is due to the greenhouse effect, the stratosphere should cool because of the heat being trapped in the lower atmosphere (the troposphere). Satellite measurements show that the stratosphere is cooling. OK 9. This combination of a warming troposphere and cooling stratosphere should cause the tropopause, which separates them, to rise. This has also been observed. OK 10. It was predicted that the ionosphere would shrink, and it is indeed shrinking. OK again, now let's go back into the models and try it with water vapor.
    Response: Regarding 5, yes, they are checking to see if the waves that water vapor blocks are escaping less/more. Regarding your "now let's go back into the models and try it with water vapor": The models most certainly do already include water vapor. See Water Vapor Is The Most Powerful Greenhouse Gas, and then Humidity Is Falling. [fixed broken link]
  8. > fossil carbon ... we know this ... > the two types of carbon have > different chemical properties. Erm, well, that's not how; isotopes can behave slightly differently in chemical reactions, but http://www.realclimate.org/index.php/archives/2004/12/how-do-we-know-that-recent-cosub2sub-increases-are-due-to-human-activities-updated/
  9. Continuing a reply to a comment here. "if one presupposes that human activity in some way affects the temperature of the Earth" Let's think of some things that human activity affects that we might agree on. I won't bother to provide citations for these things; you can find them quite easily if you want: a. ozone - remember that 'hole' that we could close by restricting CFC use? b. smog - air pollution controls have successfully reduced smog problems (caused in part by auto exhaust) in Los Angeles. Look also at successful pollution controls in central Europe put in place in the early 90s. c. acid rain - caused by SO2 emissions from industrial activity, reduced by scrubbers. d. dust clouds/storms - over farming in the US dust bowl; coal-fired power plants and urban pollution in Asia. e. CO2 -- there are a lot of studies measuring 'urban CO2 domes' that are directly tied to daily, weekly and seasonal traffic patterns. Of course, there is all that annual CO2 input from fossil fuel consumption. f. clouds - we know how to 'seed' clouds and make rain, at least in limited areas. How many of these human activities 'affect the temperature of the Earth' in some way? Some might say they all do. Here's what the experts say (I've quoted this a number of times and will continue quoting it wherever necessary until John says enough): Weather in a given region occurs in such a complex and unstable environment, driven by such a multitude of factors, that no single weather event can be pinned solely on climate change. In that sense, it's correct to say that the Moscow heat wave was not caused by climate change. However, if one frames the question slightly differently: "Would an event like the Moscow heat wave have occurred if carbon dioxide levels had remained at pre-industrial levels," the answer, Hansen asserts, is clear: "Almost certainly not." The frequency of extreme warm anomalies increases disproportionately as global temperature rises. "Were global temperature not increasing, the chance of an extreme heat wave such as the one Moscow experienced, though not impossible, would be small," Hansen says.
  10. I read that most of the CO2 from fuel emissions is located at the upper reaches of the troposphere. Is that true? If it is true, how can claims be made that the extra CO2 is causing faster plant growth? thanks if you have any links for this. Gail
  11. #10: "located at the upper reaches of the troposphere." That seems unlikely as the increasing concentrations are measured at surface stations with a wide variety of elevations, notably Mauna Loa at 3400 m. But it would be helpful to know where you read that, because I've seen everything from 'they are well-mixed' to 'they are at highest concentrations near the surface'.
  12. I read this: "The second problem is that the excess CO2 in question is located at the top of the lower troposphere where it does not nourish any plants." Which was based on this: http://www.realclimate.org/index.php/archives/2007/06/a-saturated-gassy-argument/ But I think this was my misinterpretation. It's the "CO2 in question" meaning, the CO2 that contributes to heating, not "most' of the CO2. "Among other things, the new studies showed that in the frigid and rarified upper atmosphere where the crucial infrared absorption takes place, the nature of the absorption is different from what scientists had assumed from the old sea-level measurements" thanks.
  13. #12: "the excess CO2 in question is located at the top of the lower troposphere" I can't find that particular line in the excellent RC article you reference. That article deals with CO2 effect saturation, a topic addressed here on SkS.
  14. From a comment here. "industrial aerosol emissions are mitigated somewhat during the last three decades. Therefore the actual climate sensitivity to carbon dioxide should be considerably less" Not sure why you're mixing your aerosols with your CO2 sensitivity. But if, by mitigated, do you mean that the ongoing increase in the magnitude of annual CO2 emissions of +0.67 Gtons/year worldwide somehow indicates a slowdown?
  15. #13 muoncounter at 11:33 AM on 30 December, 2010 Not sure why you're mixing your aerosols with your CO2 sensitivity. If you gave a thought to it, you'd be absolutely sure. BTW, the other thread is continued here.
  16. You can't average temperature readings (impossible due to physics) so can't really prove temperatures are increasing. We simply do not know enough to make extreme statements that changes are the result of humans- the total Earth weather system(s) has only studied intensively for 40 years compared to the Earth existing for 30+ million years so only 4 "fingerprints" are real evidence. The rest are changes.
    Response: [Daniel Bailey] You have me at a loss for what to say (and that never happens). All I can say is that you are not even wrong. I recommend that you start here, then go see the big picture, then top it off with a proper demonstration on how to compare temperature records.
  17. cloa513, could you provide more details of the difficulties due to physics, relating to average temperature readings. Also, what makes you state that the earth has existed for "30+ million years" ? Why not write '4.5+ billion years' - the reality ? Do you think it is nearer to 30 million years old ?
  18. @cloa513: "You can't average temperature readings" Sure you can.
  19. #16: "the total Earth weather system(s) has only studied intensively for 40 years compared" Wow. Aside from being factually incorrect (weather and indeed climate science is more than 40 years old): We've only gone into space since the '60s, not even a mere 50 years. So by your illogic, we cannot know anything about what happened before we went into space? However, moon rocks are much older than even '30+ million years' (try 3.5 Byears). We study those moon rocks, as we study signals in the universe that are almost as old as the universe itself! Please, for your own self-respect if nothing else, stop making statements things like that.
  20. I find your knock-down attributions of warming to anthropogenic causes less than convincing. Perhaps you could clarify a couple of things? 1. More fossil fuel carbon in the air. Presumably you mean 'more light isotope carbon in the air'. How is this light carbon attributed to human emissions? It is trivially easy to think of other causes of a 12C signal -- disruptions of the biosphere will alter the flux of isotopes and change the absolute values, a minute warming will enable methanophages to devour clathrates which have been building up for millennia. Etc -- if I remember correctly I found five possible changes which could give this signal - six if you count the burning of fossil fuels. So, without post hoc ergo propter hoc reasoning, how do we know that the signal is anthropogenic? 2. Fossil fuel carbon in coral. I have the same objection to this one: there is a light carbon signal. How do you assign it to fossil fuel burning? 3. Less oxygen in the air. Well, the methanophages would cause that, as would a major disruption of C-fixing, oxygen-producing plankton. There has been a fall in plankton population of 40% in the last seventy years. Does it not seem more reasonable that oxygen use by civilisation is dwarfed by the huge fluxes found in nature? Having seen a flow diagram of CO2 with an uncertainty of +- 70 Gt in the value of export to deep ocean reservoirs, my take on the whole affair is that we are like a little boy peeing into a reservoir during a cloudburst and worrying about whether we will cause the dam to burst. It's warming. CO2 levels are rising. Attribution please. Your assertions above do not reach the standard of proof. Julian Flood
    Response: [Daniel Bailey] Here's a recent study with data you can download & play with, so you can see for yourself.
  21. Julian Flood@20 Are you questioning the attribution of the observed rise in atmospheric CO2 to anthropogenic emissions? If so, you don't need isotopic arguments to establish that the attribution is correct. The principle of conservation of mass requires that if both man and the natural environment are carbon sources (i.e. emissions exceed uptake) then the annual increase in atmospheric CO2 must be greater than anthropogenic emissions (our uptake is negligible), as it is the sum of the net anthropogenic and natural contributions. This is observed not to be the case, atmospheric CO2 is rising at a rate about 45% of anthropogenic emissions, so the natural environment must be a net sink, and hence is not causing the observed rise. That particular piece of attribution is rock solid. The fact that the long term rise in atmospheric CO2 has been steady at 45% of anthropogenic emissions would be abit of a coincidence if the observed rise were natural and nothing to do with us!
  22. Dikran Marsupial at 06:52 AM on 30 January, 2011 wrote quote Julian Flood@20 Are you questioning the attribution of the observed rise in atmospheric CO2 to anthropogenic emissions? If so, you don't need isotopic arguments to establish that the attribution is correct. The principle of conservation of mass requires that if both man and the natural environment are carbon sources (i.e. emissions exceed uptake) then the annual increase in atmospheric CO2 must be greater than anthropogenic emissions (our uptake is negligible), as it is the sum of the net anthropogenic and natural contributions. This is observed not to be the case, atmospheric CO2 is rising at a rate about 45% of anthropogenic emissions, so the natural environment must be a net sink, and hence is not causing the observed rise. That particular piece of attribution is rock solid. unquote I'm afraid you'll have to go through the logic of your case in baby steps, as to me they don't make sense. If the world had only two agents working on CO2 production and sequestration then perhaps you would have a point. However, this is not the case. Just take, for example, the biology of the oceans: numbers of phytoplankton vary as nutrient flows (run-off from land, deep current upwelling, wind-mediated stirring of the top few hundred feet of the oceans, volcanic rain-down, seasonal changes etc etc) and this will change the amount of CO2 pulled down and/or the amount of CO2 given off. So to do your calculation of 'mass balance' you need to know the figures for all of these. Further, and more importantly, you need to know the amount going into and coming out of the biggest reservoir of CO2, the deep ocean. I think the figures you are using for your mass balance are dwarfed by the uncertainties in the figures for all of the above. To illustrate: human emissions go up by X, deep ocean export swings up by 99X, sequestration by phytoplankton goes up by 99.55X. Net increase, .45X. Now add error bars to those figures -- plus or minus 70 Gt. 70! So you don't know the numbers within something like 10X and you're calculating to decimal places. And from this you can claim that it's all the fault of the little boy piddling in the reservoir? I must be misunderstanding something basic. Please explain again a different way and I'll try and follow the logic better. quote The fact that the long term rise in atmospheric CO2 has been steady at 45% of anthropogenic emissions would be a bit of a coincidence if the observed rise were natural and nothing to do with us! unquote So Zog, when he picked up his first bit of seacoal and threw on his fire, altered the CO2 content of the atmosphere by 45% of the C in that coal? You know that bit in Borat where he looks at someone with disbelief? Picture me like that. How does the process know to only sequester 45% of the extra, and how does it distinguish that 45% blip from all the other processes which are not steady state but which vary with the season, run-off etc. What, in other words, is the _mechanism_? TIA JF (thanks for isotope data. I think the same error is being made here as in the mass balance argument, that there is a steady state in the isotopic composition of the pull down -- just adding a little dissolved silica to the oceans will invalidate that assumption.)
  23. Julian@Flood@22 The mass balance argument does not need to make any assumption about the carbon cycle other than conservation of mass (of carbon), neither does it depend on any knowledge of the individual fluxes into and out of the atmosphere. The diagram below shows annual anthropogenic emissions (for which we have good records), the annual increase in atmospheric CO2 (for which we have accurate records, in this case Mauna Loa), and the difference between total natural emissions and total natural uptake, which can be inferred from anthropogenic emissions and atmospheric increase assuming conservation of mass. For conservation of mass, we know that dC = E_a + E_n - U_n where dC is the annual change in atmospheric CO2, E_a is anthropogenic emissions, E_n is "natural" emissions and U_n is "natural" uptake. Of these, we can directly measure dC and E_a, so rearranging, we have E_n - U_n = dC - E_a This is the green line, which gives total net emissions into the atmosphere from all natural sources (including soil respiration). As you can see, it is always negative, demonstrating that the natural environment is a net sink, and is hence opposing the atmospheric rise, not causing it. The data is shown here it can all be downloaded from the Carbon Dioxide Information Analysis Center CDIAC, the specific datasets you need are: anthropogenic emissionshere and Mauna Loa data here. Note that the error bars on the inferred natural net sink depends on the uncertainty in anthropogenic emissions and measurements of atmoispheric CO2, both of which are small. The bottom line is that the annual rise in atmospheric carbon is the sum of anthropogenic emissions, natural emissions (whatever the mechanism) minus natural uptake (whatever the mechanism). If the annual rise is less that anthropogenic emissions, then the only way that can happen is for natural uptake to excede natural emissions.
  24. Julian@Flood@22 wrote "How does the process know to only sequester 45% of the extra, and how does it distinguish that 45% blip from all the other processes which are not steady state but which vary with the season, run-off etc. What, in other words, is the _mechanism_?" It stems from the fluxes of carbon between reservoirs being proportional to the atmospheric concentration and the fact that emissions are rising approximately exponential. The carbon cycle is a dynamical system, which can be described by linear differential equations. If you apply exponential forcing to such linear D.E.s you get an exponential result (with the same rate constant). As both exponentials have the same rate constant, their ratio is constant. I did the D.E.s myself last year to satisfy myself that a constant airborne fraction is what you would expect for an anthropogenic origin, and indeed it is.
  25. I've seen the balance argument before and I find it makes me uneasy, not least because there are assumptions unspecified. U_n and E_n may both vary, for example, depending on total emissions and e.g. pollution. Could you follow my logic below and point out how it is in error? Mostly I just follow your reasoning, simply adding an unknown additional input. Civilisation emits CO2 from the burning of fossil fuels, disrupts the natural mechanisms by which uptake occurs and may also cause an increase in 'natural' emissions -- deforestation, methane consumption in permafrost by bacteria as acid rain effects wear off, etc etc. The loss of uptake and the increase in emissions can be lumped together into a single figure, the equivalent of an emission increase(of positive or negative sign), which we will call indirect anthropogenic emissions. We have, for the purposes of my argument, no knowledge of the size or isotopic composition of indirect anthropogenic emissions. The size also seems to be internally unconstrained as U_n, E_n and E_ua may cancel each other out. For conservation of mass, we know that dC = (E_a +E_ua) + E_n - U_n where dC is the annual change in atmospheric CO2, E_a is fossil fuel emissions, E_ua is indirect anthropogenic emissions, E_n is "natural" emissions, and U_n is "natural" uptake. Of these, we can directly measure only dC and E_a. Rearranging, we have E_n - U_n = dC - (E_ua +E_a) Now, we know that the level of atmospheric CO2 is not rising as fast as it would if all the fossil fuel emissions were causing the rise, let alone including the indirect emissions. So the natural environment is a net sink and the increase in atmospheric CO2 must be due to (E_ua + E_a). It would seem likely that the sinks will treat E_a and E_ua in the same way, and atmospheric CO2 will therefore contain a proportional amount from each. Question: does the isotopic composition of the dC indicate that the the fossil fuel CO2 addition U_a is sufficient to explain the change in 12C amount, or does the 12C proportion indicate another source of CO2 which is rich or depleted in 12C? It is unlikely that the isotopic proportions of E_ua would match E_a and it may be that a mismatch can give us some indication that there is more going on than your first explanation suggests. I will think about your second post and the explanation there. Are there any papers on this? The difficulty of applying atmospheric CO2 levels to the export from upper to deep ocean reservoirs I would have thought precluded this sort of analysis, but presumably someone must have overcome this. JF

1  2  3  4  5  Next

Post a Comment

Political, off-topic or ad hominem comments will be deleted. Comments Policy...

You need to be logged in to post a comment. Login via the left margin or if you're new, register here.

Link to this page


The Consensus Project Website

THE ESCALATOR

(free to republish)


© Copyright 2024 John Cook
Home | Translations | About Us | Privacy | Contact Us