In April 2026 we published a guest blog post by John Lang in which he introduced his "Climate Trunk" graphics project and website. Since then, he has been adding one graphic per week and plans to keep going for about 2 years rounding out the big picture of human-caused climate change graphic by graphic. In this blog post we'll show-case the graphics related to impacts and will keep adding more as they get published.
How climate change is affecting people, ecosystems and the natural world.
Global temperatures are rising fast. The long-term trend is unequivocal: Earth has heated by around 1.3°C since the late 19th century – with most of that increase coming recently.
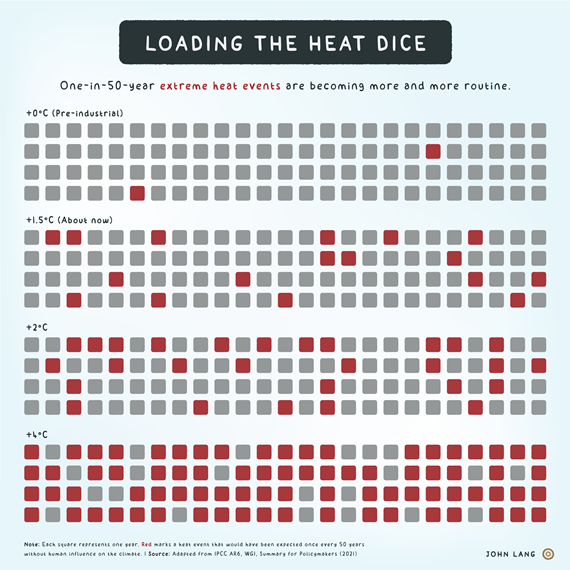
One-in-50-year extreme heat events are becoming more and more routine.
... to be continued.
Follow these links to dive into the other Climate Trunk rings: Science, Economics, Political Economy, Governance, Solutions, Energy, Daily Life.
Posted by BaerbelW on Sunday, 9 August, 2026

 |
The Skeptical Science website by Skeptical Science is licensed under a Creative Commons Attribution 3.0 Unported License. |