



 Arguments







Climate Trunk - Economics
Posted on 9 August 2026 by BaerbelW
In April 2026 we published a guest blog post by John Lang in which he introduced his "Climate Trunk" graphics project and website. Since then, he has been adding one graphic per week and plans to keep going for about 2 years rounding out the big picture of human-caused climate change graphic by graphic. In this blog post we'll show-case the graphics related to economics and will keep adding more as they get published.
The incentives, costs, markets and capital flows that drive decision-making.
#16 - Learning by doing
Every doubling of global solar capacity has made solar panels about 20% cheaper. That relentless cycle of learning, innovation and scale has transformed solar into the world's cheapest source of new electricity and one of the fastest-growing technologies in history.
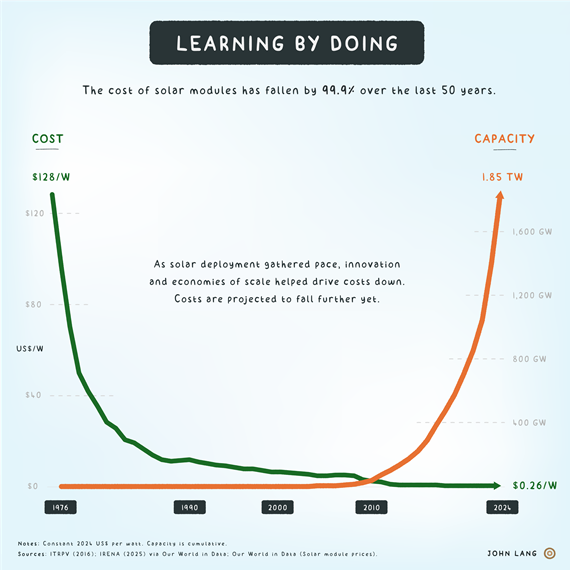
How making more solar made it 99.9% cheaper.
#28 - A Sign of things to come
Clean energy investment has risen more than 70% since 2020, with nearly $2 now going into clean energy for every $1 into fossil fuels. Follow the money and you get a pretty good sense of where the global energy system is heading.
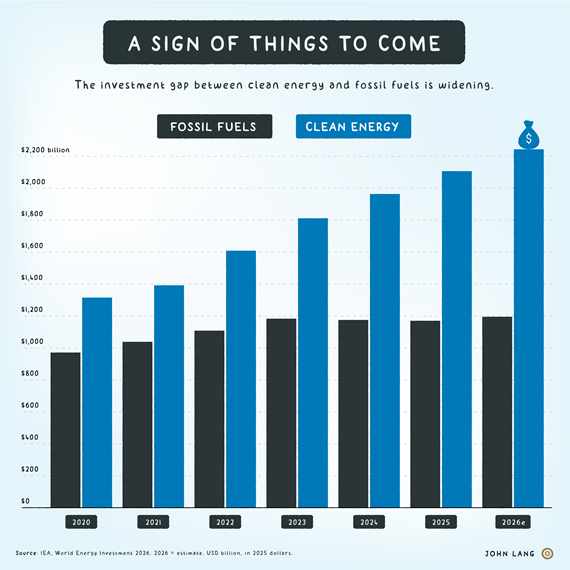
Clean energy investment is pulling away from fossil fuels.
... to be continued.
Follow these links to dive into the other Climate Trunk rings: Science, Impacts, Political Economy, Governance, Solutions, Energy, Daily Life.








Comments