What The Science Says:
Models and direct observations find that CFCs only contribute a fraction of the warming supplied by other greenhouse gases.
Climate Myth: It's CFCs
"The observed data show that CFCs conspiring with cosmic rays most likely caused both the Antarctic ozone hole and global warming... The total amount of CFCs, ozone-depleting molecules that are well-known greenhouse gases, has decreased around 2000. Correspondingly, the global surface temperature has also dropped." (Qing-Bin Lu)
A paper published in an obscure physics journal by the University of Waterloo's Qing-Bin Lu (2013) has drawn quite a bit of media attention for blaming global warming not on carbon dioxide, but rather on chlorofluorocarbons (CFCs, which are also greenhouse gases). However, there are numerous fundamental flaws in the paper, which is based almost entirely on correlation (not causation) and curve fitting exercises.
Lu's hypothesis was disproven very simply by Nuccitelli et al. (2014). Lu argues that the radiative forcing (global energy imbalance) from CFCs matches global surface temperatures better than that from CO2 over the past decade. This is because as a result of the Montreal Protocol, CFC emissions (and emissions of hydrofluorocarbons, which replaced CFCs) have been flat over the past decade, and global surface air temperatures have also been essentially flat during that short timeframe, while CO2 emissions have continued to rise.
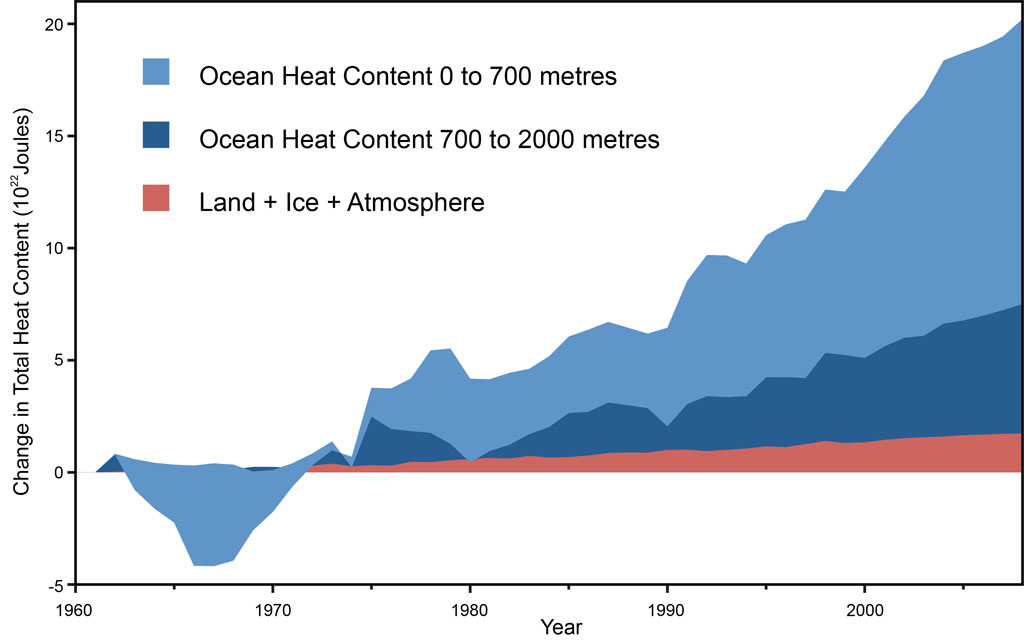
However, a global energy imbalance doesn't just impact surface temperatures. In fact, only about 2% of global warming is used in heating the atmosphere, while about 90% heats the oceans. Over the past decade, ocean and overall global heating have continued to rise rapidly, accumulating the equivalent of about 4 Hiroshima atomic bomb detonations per second (Figure 1).
Figure 1: Land, atmosphere, and ice heating (red), 0-700 meter OHC increase (light blue), 700-2,000 meter OHC increase (dark blue). From Nuccitelli et al. (2012).
But let's dig into the details of the paper to see how Lu built his case and where he went wrong.
Unphysical Curve Fitting, Misrepresenting Cited Research, and Circular Logic
Here at Skeptical Science we have previously examined several cases of curve fitting. This describes the practice of scaling several variables without any sort of realistic physical constraint until the model closely matches the observational data, and then declaring that you've proven that those variables caused the changes in the observations. Loehle and Scafetta used this strategy to blame global warming on astronomical cycles, and Roy Spencer used it to blame global warming on ocean cycles.
In this paper, Lu used curve fitting to blame global warming on a combination of solar activity and CFCs. First he randomly scaled a total solar irradiance (TSI) reconstruction to match the surface temperature record as closely as possible. He claimed that this practice was justified by Solanki and Krivova (2003). Lu says:
"...it can be seen that the global temperature indeed closely followed the TSI variation up to 1970; the y-axis for TSI can be scaled so that the magnitudes of the temperature and TSI variations are similar during 1850-1970. This was actually shown previously by Hoyt and Schatten50 and Solanki and Krivova52, and an excellent linear correlation with coefficients of 0.83~0.97 between the TSI and the temperature was obtained.52 This implies that the TSI values can be converted into temperatures using the linear correlation.52 The observed data indicate that the solar effect played the dominant role in climate change prior to 1970."
"We have shown that even in the extreme case that solar variability caused all the global climate change prior to 1970, it cannot have been responsible for more than 50% of the strong global temperature rise since 1970 through any of the channels considered here. We believe that even this fraction is too high."
There is a proportional relationship between changes in TSI and changes in surface temperatures, but it's a physical relationship. You can't just choose whatever proportionality is convenient for your argument. In fact what Lu has done is assume that TSI explains most pre-1970 global surface warming, and then claim that he's proven this is the case. It's circular logic, like fixing a card game and then claiming you're a great card player when you win.
The only reason Lu's TSI model matches the surface temperature data is because he forced it to match through curve fitting – by refusing to apply any physical constraints to his model. Then when his unphysical model fits the temperature data reasonably closely, he declares that he's shown "that the solar effect played the dominant role in climate change prior to 1970." In reality he's shown no such thing, he's simply assumed that his conclusion is true.
Lu also uses a solar reconstruction from Hoyt and Schatten (1993) in his curve fitting exercise. Why use the results of 20-year-old study? Perhaps because it helps Lu arrive at his end conclusion that global warming isn't due to CO2. The Hoyt and Schatten paper claims that the equilibrium climate sensitivity to doubled CO2 is a mere 0.19°C – a factor of 15 lower than today's best estimates.
Perhaps the gold standard of TSI reconstructions comes from Wang, Lean, and Sheeley (2005), updated by Kopp and Lean (2011), whose data are available here. They estimate that the increase in the amount of solar radiation reaching Earth from 1860 to 1970 was not very large (a radiative forcing of less than 0.2 Watts per square meter, compared to the 1.7 Watts per square meter CO2 forcing from pre-industrial times to Present), and only sufficient to account for approximately 0.07–0.15°C average global surface warming. Thus TSI can probably only account for less than half of the observed 0.3–0.4°C surface warming during that time, contrary to the 100% solar attribution Lu claims based on his curve fitting exercise.
Yet More Circular Unphysical Arguments, Curve Fitting, and Misrepresentation of Cited Research
Lu faced the conundrum of having to explain how the increased greenhouse effect from CFCs can cause global warming while the much larger increased greenhouse effect from rising CO2 can't. To accomplish this, he used what the climate scientists at RealClimate have described as the saturated gassy argument – claiming that increased CO2 can't cause more warming because there is already so much in the atmosphere that its greenhouse effect has become saturated. However, as the climate scientists at RealClimate (and we at Skeptical Science) have explained, that argument is quite clearly wrong – disproven by observational data.
Perhaps worse, Lu claimed that a paper by Anderson et al. (2004) supported his saturated gassy argument, claiming the CO2 absorption band is missing from the observed spectrum data. On the contrary, Anderson et al. concluded,
"The spectra in Fig. 8a are the result of a superposition of two different effects. First, there is an increase of greenhouse gases from 1970 to 1996 that gives rise to recognizable bands in the observed spectrum..."
And once again, Lu tried to demonstrate that CFCs can account for the recent global surface warming through unphysical curve fitting, multiplying the CFC forcing by whatever value allowed the CFC data to best fit the temperature data. When using physical constraints, CFCs (included in "halocarbons" in Figure 2) can account for only about 20% as much warming as CO2.
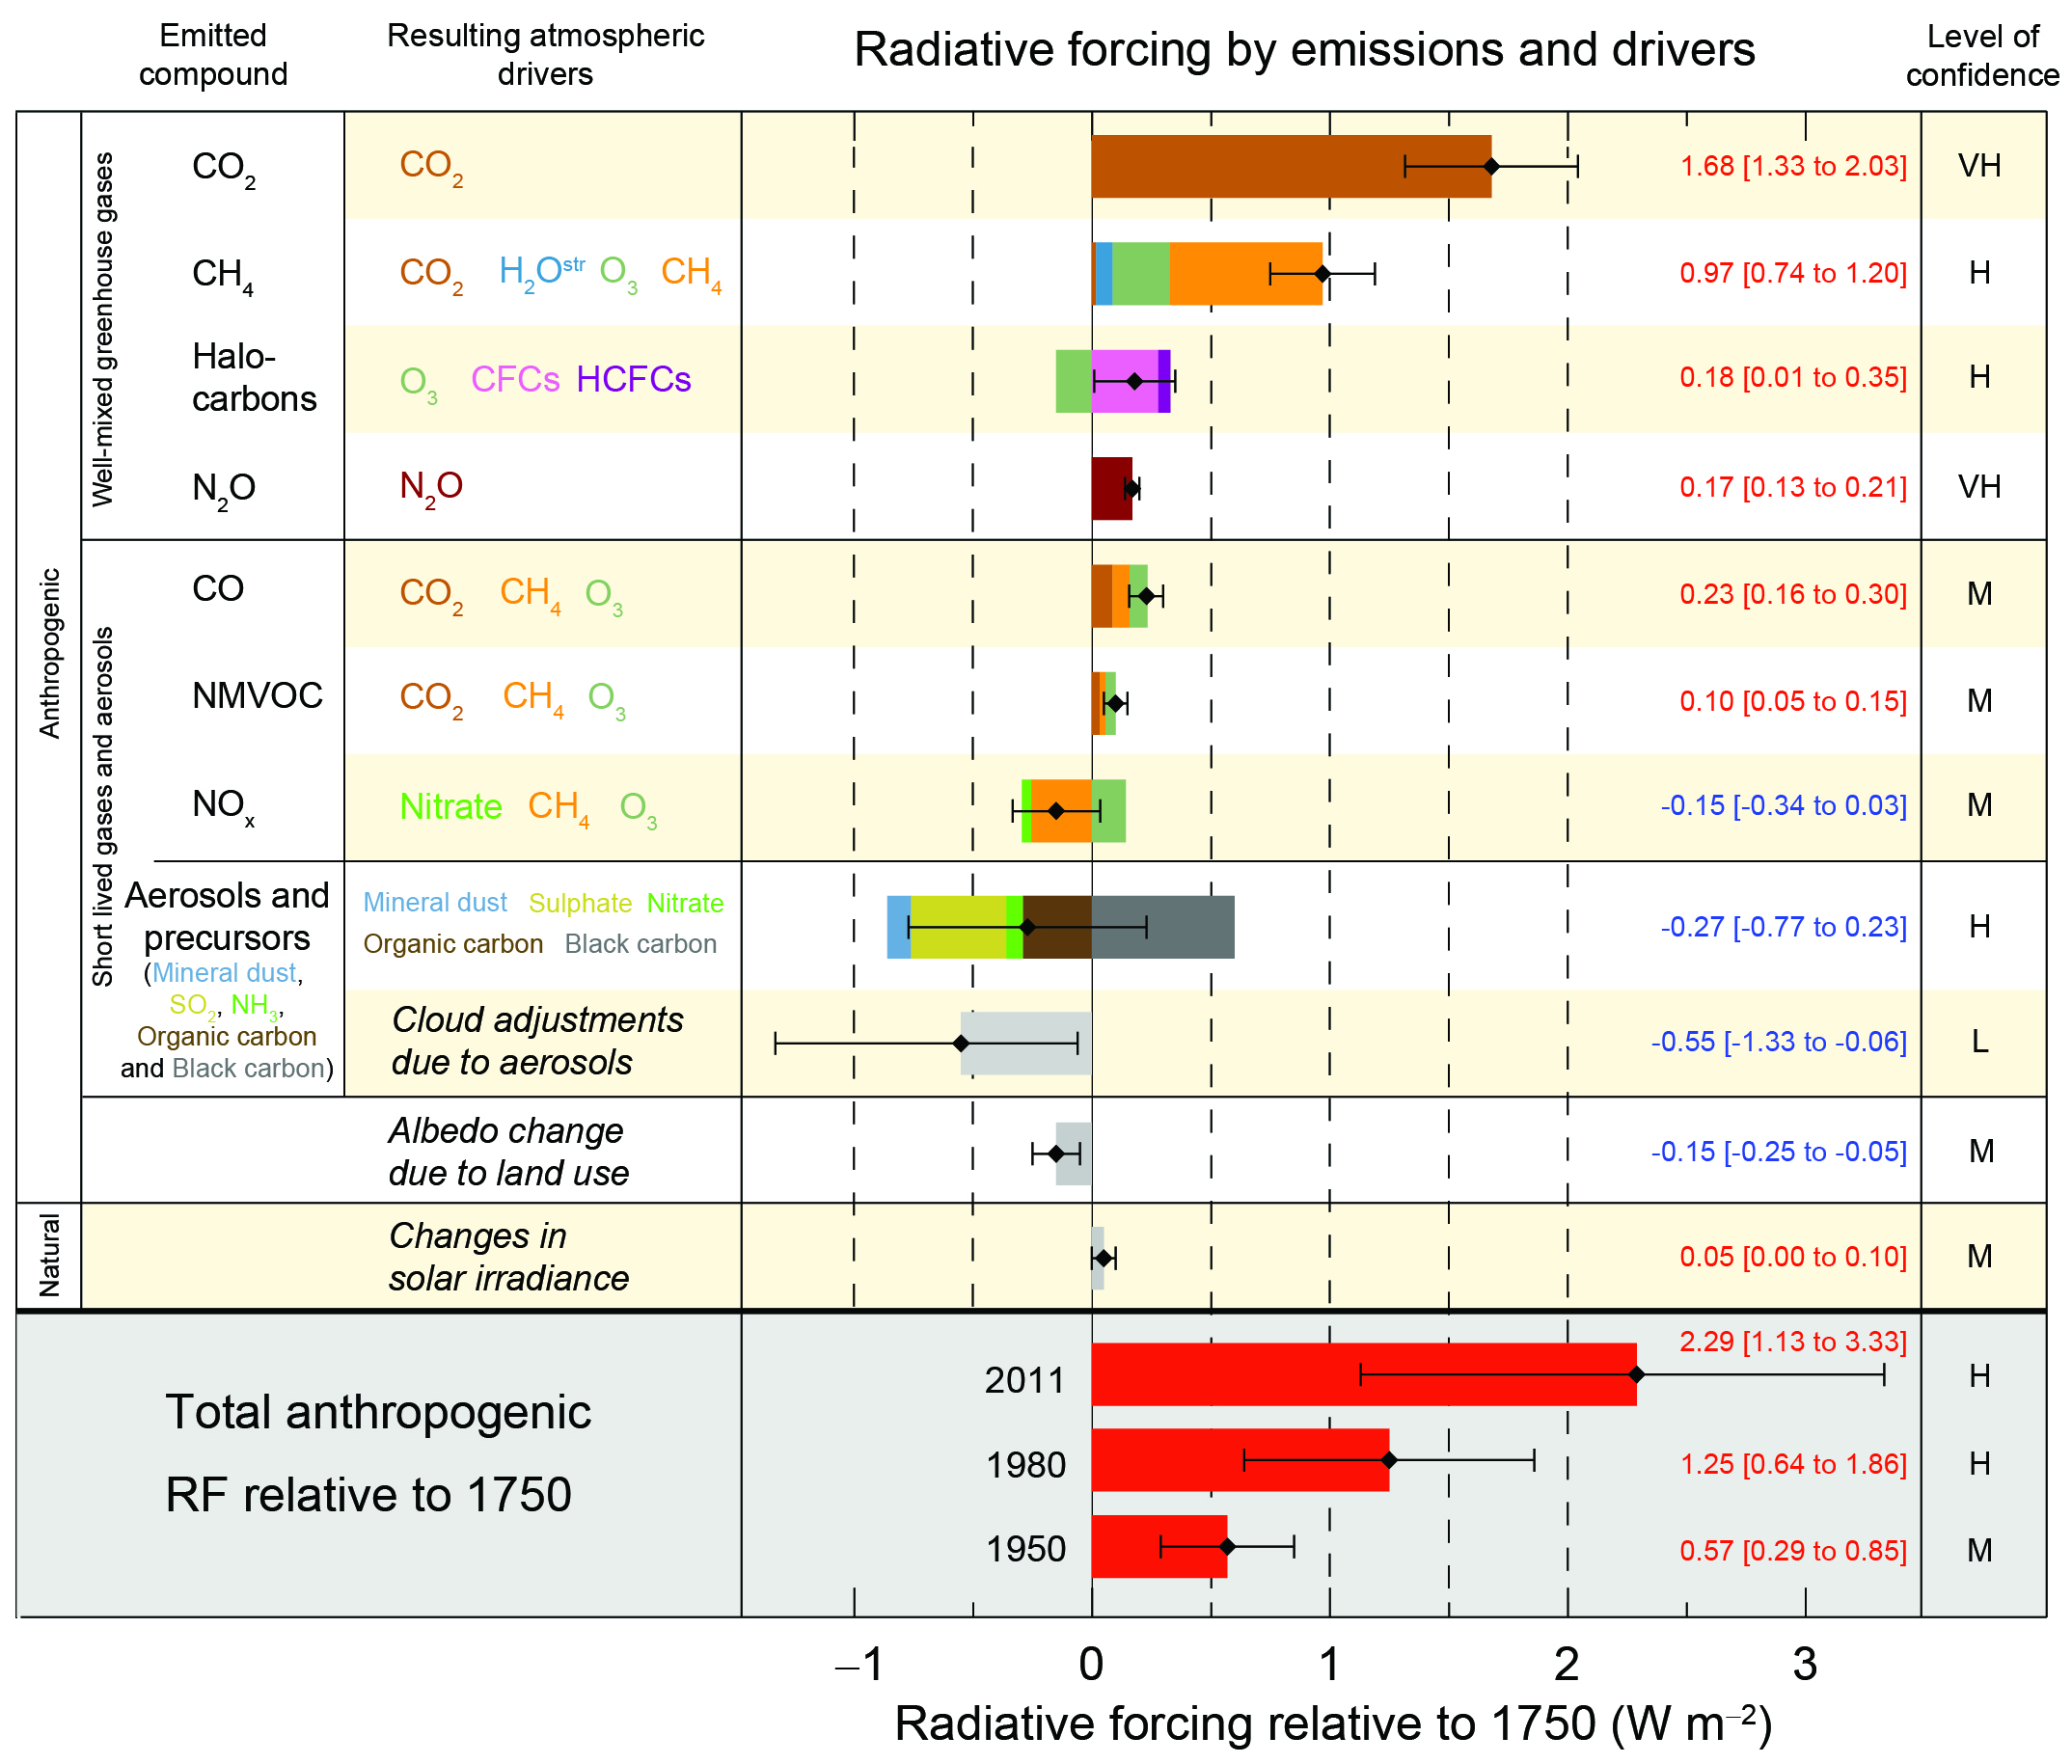
Figure 2: Radiative forcing estimates in 2011 relative to 1750 and aggregated uncertainties for the main drivers of climate change. Values are global average radiative forcing (RF14), partitioned according to the emitted compounds or processes that result in a combination of drivers. The best estimates of the net radiative forcing are shown as black diamonds with corresponding uncertainty intervals; the numerical values are provided on the right of the figure, together with the confidence level in the net forcing (VH – very high, H – high, M – medium, L – low, VL – very low). Albedo forcing due to black carbon on snow and ice is included in the black carbon aerosol bar. Small forcings due to contrails (0.05 W m–2, including contrail induced cirrus), and HFCs, PFCs and SF6 (total 0.03 W m–2) are not shown. Concentration-based RFs for gases can be obtained by summing the like-coloured bars. Volcanic forcing is not included as its episodic nature makes is difficult to compare to other forcing mechanisms. Total anthropogenic radiative forcing is provided for three different years relative to 1750. For further technical details, including uncertainty ranges associated with individual components and processes, see the Technical Summary Supplementary Material. {8.5; Figures 8.14–8.18; Figures TS.6 and TS.7}. From the 2013 IPCC AR5 SPM, page 14.
In his Figure 11, Lu also exaggerates the difference between expected CO2-caused warming and observed temperatures by plotting the observational data against the surface warming we expect at equilibrium. This is wrong because there is a global energy imbalance, which means there is more warming "in the pipeline" for several decades to come before we reach that equilibrium state. In reality the Earth has warmed as expected from the increased CO2 greenhouse effect.
In Nuccitelli et al. (2014), we also found that even ignoring the unphysical "curve fitting" in his model, models using current known human climate forcings produced a more accurate fit to up-to-date surface temperature measurements (HadCRUT4) than Lu's model (r2 of 0.81 vs. 0.72).
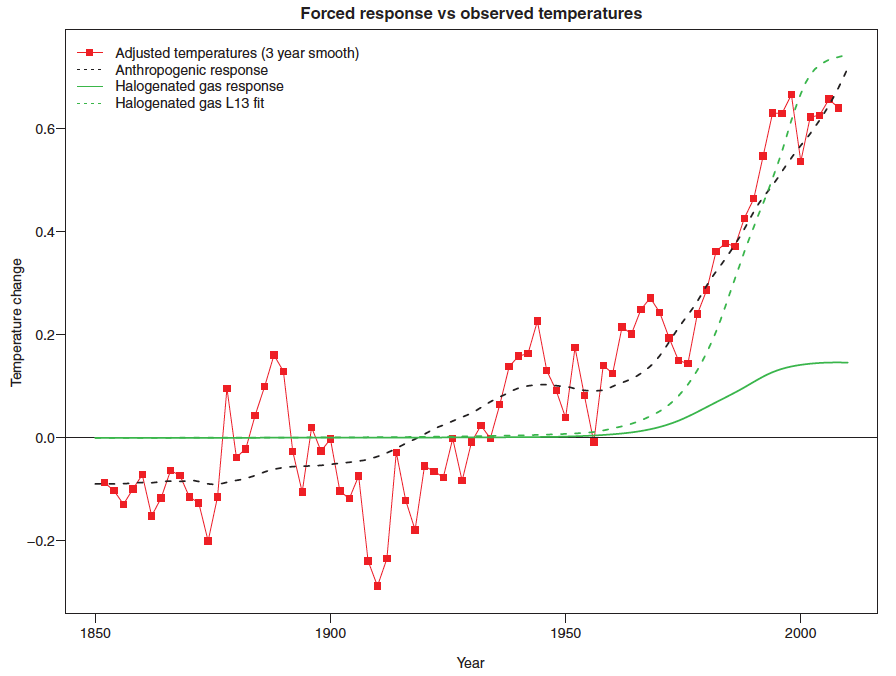
Replication of Lu (2013) Figure 12 using more recent data and a realistic response function. The fit between the anthropogenic forced response (black dashed line) and adjusted temperatures (red squares) is superior to the fit to CFC forcing (green solid line), even allowing for an additional unphysical scaling and lag as in Lu (2o13) (green dashed line).
Ultimately the 'CFCs are driving global warming' myth from Lu (2013) is based on assuming rather than proving the hypothesis, unphysical curve fitting, and misrepresenting the cited research.
 |
The Skeptical Science website by Skeptical Science is licensed under a Creative Commons Attribution 3.0 Unported License. |