Arguments


Recent Comments
Prev 67 68 69 70 71 72 73 74 75 76 77 78 79 80 81 82 Next
Comments 3701 to 3750:
-
Bob Loblaw at 11:49 AM on 23 July 2022Taking the Temperature: a dispatch from the UK
MAR:
Thanks. I was going to see if Fixitsan could come up with any sort of analysis as to just what CET actually covers - e.g. station locations and such - but he so far seems to just want to run away from his "national" statement. If he addressed the coverage issue in a realistic fashion, I was going to come back to the suitability of instrumentation in the early periods. You've pre-empted that. (No harm done.)
Even the Wikipedia page has this statement (emphasis added):
This is remarkable given the small region of the world that the CET series represents which results in high variability relative to a temperature series that represents a much larger area, such as the global mean surface temperature.
So far Fixitsan seems to be pretty good at providing a Gish Gallop of numbers, but he's pretty short on understanding what they mean.
-
MA Rodger at 09:44 AM on 23 July 2022Taking the Temperature: a dispatch from the UK
Bob Loblaw @17,
The CET is described as "representative of a roughly triangular area of the United Kingdom enclosed by Lancashire, London and Bristol." That would give it a centre somewhere near Stratford-on-Avon and only the western edge of your red area sitting within that triangle which extends mostly to the south. One problem with using early daily data (or even monthly data) from CET is that it is not using standardised thermometer hosuings. The Met Office do give ranked regional, national and UK-wide monthly averaged data for max min & mean temperatures but only go back to the start of use of the Stevenson Screen in the 1860s. These at least would be "sticking with national averages" which as described by Fixitsan @2 indeed would be "a better guide to what is happening in terms of trends over a larger sample area," although advice apparently then ignored.
These UK-wide top-rankers come in:-
Max Temp - Jan 1916, Feb 2019, Mar 2012, Apr 2011, May 2018, Jun 1940, Jul 2006, Aug 1995, Sep 1895, Oct 1921, Nov 2011, Dec 2015, Winter 1989, Spring 1893, Summer 1976, Autumn 2006, Annual 2014.
Mean Temp - Jan 1916, Feb 1998, Mar 1938, Apr 2011, May 2008, Jun 1940, Jul 2006, Aug 1995, Sep 2006, Oct 2001, Nov 1994, Dec 2015, Winter 1989, Spring 2017, Summer 2018, Autumn 2006, Annual 2014.
But single months and even single years ar subject to a lot of noise so listing out these top-ranked months etc and reflecting on the length of time thay have maintained that top-rank is doing little more than examining randomness. Even for annual means, this UK-wide data provides a randomness spread of +/- 0.9ºC (2 sd) and the rankings will be latching on to even rarer events than 1-in-20.
So the argument set out up-thread by Fixitsan is baseless.
Added to that, the statement @2 that "most of the CO2 was produced before 1989" is wrong. In terms of FF emissions, more has now been emitted since 1989 and in terms of the rise in atmospheric CO2 levels, 1989 sit at about halfway from pre-industrial, but not forgetting the poor old climate system does need a decade or more to get its reaction to climate forcing working significantly.
-
One Planet Only Forever at 09:31 AM on 23 July 2022Taking the Temperature: a dispatch from the UK
Fixitsan @18,
Now we are getting somewhere. But there is further to go.
As you now see, looking at month averages rather than day averages changes things. April 1775's ranking is not the same as the ranking of that warmest April date you found.
Extend that learning to check where the overall year average of 1779 ranks relative to the February 1779 ranking.
The next step is to calculate the 11-year average for the years 1774 - 1784 (centered on 1779) and compare it to the most recent 11-year average. Then compare the 31-year averages (1764-1794 to the most recent 30 years). Is 1779 the centre of a 'period that was warmer than the most recent period'?
Another part of understanding this is that the amount of average global warming since pre-industrial times is only now slightly more than 1.0C. And the Arctic has warmed signficantly more (it really has). So the amount of average increase in a non-arctic area would be less. Review the data set to see if the range of temperatures for a specific date is less than 1.0C (It will be a far larger range of variation). You would also find that the range of average monthly values for February, or April (or any month) was also far more than 1.0C, but less than the range of values for any day within the month. Same goes for the annual values.
Finding a warmest day, or month, or even year, in the distant past in a regional temperature data set is not unexpected. But the warmest 30-year average in the global data sets are the most recent 30 years. And each month is almost certainly warmer than that month 30 years ago. So the 30 year average is now increasing with each new month of global data, even if the new month is a little cooler than the previous year. However, the much higher range of daily values could see a daily value that is cooler than the value 30 years ago. But, statistically speaking, it is more likely that a day this year will be warmer than that date 30 years ago.
-
nigelj at 08:46 AM on 23 July 2022Taking the Temperature: a dispatch from the UK
Fixitsan @18
A hottest month (or day) record in for example the UK in January 1916 doesn't prove the UK isn't warming or that the planet isn't warming. We have clear evidence the UK and world are warming.The old record is likely caused by a rare combination of weather events that concentrates energy in the climate system in one place to cause a temperature record. The planet could warm a couple of degrees as a whole, but it could be a long time before such a rare combination of events happens again, and with global warming added thus setting a new record.Eventually as the planet warms all the old records will be broken but it will take time.
-
Bob Loblaw at 08:11 AM on 23 July 2022Taking the Temperature: a dispatch from the UK
Fixitsan:
You are not addressing the unsuitability of using CET as a "national temperature". You said you are the UK. Surely you understand that the Midlands is not the entire nation?
Not every local area follows the global pattern. This in not at all surprising, and is totally expected. Your "month after month, apparently everything just gets hotter" is a complete strawman argument.
-
Bob Loblaw at 08:02 AM on 23 July 2022Human CO2 is a tiny % of CO2 emissions
A note on the Basic tab of this rebuttal. An astute reader noticed that the paragraph under Figure 1 stated that 40% of the additional carbon is absorbed, but this disagreed with the values in the figure. A check of the original source confirmed the reader's observation. It appears that in the original writing, the 60/40 split was reversed.
The rebuttal has been corrected to use the 60% value.
-
Fixitsan at 07:51 AM on 23 July 2022Taking the Temperature: a dispatch from the UK
I understand your reservation about a single day in a single month, we need to compare a longer spell, like a while month in a year.
We have that data too in the CET, managed by Hadley Centre for Climate Change
Hottest January, 7.5C in 1916
February, 17.9C in 1779
March, 9.2C, 1957
April, 11.8C, 2011
May, 15.1C, 1833
June, 18.2C, 1846
July, 19.7C, 2006
August, 19.2C, 1995
September, 16.8, 2006
October, 13.3C, 2001
Novemeber, 10.1C, 1994
December, 9.7, 2015
Well now there are more warmer average months being declared in recent years, but has there really not been a warmer February since 1779 ?
All of the CO2 produced since 1779 failed to produce a warmer February than that year. WHat was so unusual about that year I wonder which made it the hottest ever even before any manmade climate change had begun.
May 1833, and June 1846 ? We haven't had a hotter May or June since before 1850, yet month after month, apparently, 'everything just gets hotter'
Regarding the regional/local aspect of one single temperature record, if it doesn't reflect the trend of the global patterns of temperature anomalies, the question needs to be asked about how many other areas do not align with the global trends, and therefore apparently challenge the notion that global warming is not global (affecting everywhere) at all
-
Bob Loblaw at 07:45 AM on 23 July 2022Taking the Temperature: a dispatch from the UK
Fixitsan (in several comments):
Hmmm. You seem to be rather inconsistent in your selection and discussion of data. In your first comment (#2), you make specific reference to the Central England Temperature (CET) record, but then you start talking about "national" temperatures. In fact, your comment #2 uses the word "national" nine times.
The CET is indeed well-known and documented. Wikipedia has a page for it.
It also appears that many (if not all) the record temperatures and dates that you provide are for the CET. The Wikipedia pages says that the "Central" in CET refers to the Midlans of the UK, and links to a page that contains the following map:

Yet, when I follow the link that John Mason gave in comment #4, to the UK Met Office report, they provide an animated GIF image of the maximum temperature comparisons for specific hot summer days in the years 1976, 2003, 2019, and 2022 (this week). When I look at those maps, I see that the Midlands usually is not part of the hottest regions of the UK for any of those maps. (Follow the link to the report to get a full-sized image.)

You also make the comment (third paragraph of comment #2) that "The strength of reporting on local temperature highs always seems to be given more importance then another useful metric, the national average temperature."
So, I have one question (for now): why are you using a regional analsyis of temperature (CET), and presenting it as a "national ...temperature"? Are you not making exactly the same mistake that you are saying other people should not be making?
Please provide a justification for treating CET as a "national temperature", when it is clear that it does not represent the area of the UK that tends to have the hottest temperatures. Why did you select CET, with its limited geographical coverage, for this purpose?
-
One Planet Only Forever at 06:23 AM on 23 July 2022Taking the Temperature: a dispatch from the UK
Fixitsan,
In your comment @9 you state "Can you explain why there hasn't been a hotter April than 1775 after 247 years of CO2 production ?" while offering as evidence that 'one day in April 1775 was the warmest in the record (of temperatures in a small part of the planet)'.
That leads to the requested test that 'the overall average of the Month of April 1775 be performed and compared to all other overall April values in the data set. That tests the claim that 'finding a hottest day in a month is consistent with that Month also being the hottest'.
But, more logically based on all the global evidence (not just a region's evidence), the understanding is that human activity has 'statistically significantly' caused significant rapid recent warming resulting in 'statistically significantly' higher local temperatures to occur more frequently.
Investigating a data set for part of the planet and finding a day in April 1775 that was warmer than any other temperatures on that date in other years in that data set (btw, was it statistically significantly warmer?) does not 'statistically significantly' contradict the understanding based on all of the evidence that "human activity has 'statistically significantly' caused significant rapid recent warming resulting in 'statistically significantly' higher local temperatures to occur more frequently."
-
John Mason at 06:03 AM on 23 July 2022Taking the Temperature: a dispatch from the UK
Rearranging deckchairs on the Titanic is the first thing that comes to mind!
-
Fixitsan at 05:09 AM on 23 July 2022Taking the Temperature: a dispatch from the UK
How did April 'stand up'...to what ?
As I clearly pointed out to you that August's hottest peak temperature and hottest average temperature were on different days, then so to it could be expected the same for April.
The highest peak temperature for April was 25C, on 16th April 2003, and the highest daily average for April was 19.7C on 29th April 1775.
Given the wide spatial separation of individual thermometers it's no surprise that we always see a new peak in some areas, year after year, as the occasional coincidence of the highest regional temperature aligning with a recording thermometer occurs
-
One Planet Only Forever at 04:52 AM on 23 July 2022Taking the Temperature: a dispatch from the UK
Fixitsan,
Presenting a failure to comprehend my comments would be your fault. Repeating a clearly questionable point is still questionable.
How did the average for all of the month of April 1775 stand up? Surely that hottest day value you found is consistent with the month of April 1775 being the warmest in the record.
By the way, thank you for accepting that the MET was correct to warn about and report high local maximums.
-
Fixitsan at 04:01 AM on 23 July 2022Taking the Temperature: a dispatch from the UK
One Planet
Have you no answer as to why April and May have never had a higher daily average temperature than before the industrial revolution , about which it is said caused global warming, as in all places ahve got warmer.
Clearly there's at least one place where that doesn't seem to have happened and I wonder, how many others after that ?
-
One Planet Only Forever at 03:56 AM on 23 July 2022Taking the Temperature: a dispatch from the UK
Fixitsan @9,
"I suggest you review night time temperatures whcih don't appear to have risen statictically significantly".
Still sticking to 'hottest day maximum temp in a month - a day in April 1775', denying the logical fallacy of that methodology, says everything that needs to be said. You didn't even check the average of max and min on a day to see if your belief stands up to that weak test ( a weak one because you claim the nights are not statistically warmer). And, of course, you evaded the stronger test (logically built on your preference for averages) of where the Average of all of April (max and mins) in 1775 ranks in the list of Aprils.
The facts clearly contradict the story you are trying to sell. Everyone can confirm that independently. Also the warming of the nights is "statictically significant - confirmed to have happened in the temperature records everywhere". Though admittedly, as has been said, "There are lies, damn lies, and then there are the twisted ways some people abuse 'data manipulation - like statistics'.
I, and some others, strive to pursue and rely on logical understanding that best explains all of the evidence.
The logical understanding based on the evidence of the comments you have provided is you 'statistically' appear to 'confidently' prefer 'poorly justified beliefs' over 'logical improved understanding based on all the evidence'.
-
Fixitsan at 02:31 AM on 23 July 2022Taking the Temperature: a dispatch from the UK
Bear in mind (this weakens my argument because it is disrespectful to the Met) that the Met pulled out of the lucrative business of long range weather forecasting (of vital importance to farmers everywhere, because getting it right at planting time can be worth 15% moire profit), because their moderate level of accuracy was surpassed by a more superior method which included solar and cosmic activity, while previously the Met Office had stated they did not think the sun affected the UK's climate.
Surely, climate only exists because of the sun.
No sun, no climate, and no climate change.
I say that with confidence as someone who firmly believes climate stability is a pseudo religious belief, and, there doesn't seem to be any evidence that the multivariant input based climate of the earth should ever see those variable parameters stabilise, ever, due at least to the fact that they all feedback into one another in various ways and particularly crucially, with different rates of change.
Stability is an impossibility and as far as I'm concerned the expectation of climate stability is a fools errand
-
Fixitsan at 02:22 AM on 23 July 2022Taking the Temperature: a dispatch from the UK
@ One Planet, I suggest you review night time temperatures whcih don't appear to have risen statictically significantly
Can you explain why there hasn't been a hotter April than 1775 after 247 years of CO2 production ? Do you even accept the notion that 1775 was the year of a record hot April day, and no other April since records began have had a higher average ?
Seemingly you suggest that it could have been hotter at night, are you saying it is your belief that in the April of 1775 there was record high night time temperatures - what would be the reason for that ?
The fact that you can suggest an alternative theory doesn't make the proposed theory incorrect. Just as I suggest that while I can read much fearmongering about how the world is getting warmer I can find an interpretation of the data which doesn't really support it, shouldn't you be willing to accept that, if you're open minded about it a hotter April or May should have occured by now after the output of CO2 from the industrial revolution, creating over 1Celsius of temperature rise last century. How many people do you realistically think would accept that after 200 years of Industrial revolution that April and May have never been hotter than before then ?
-
Fixitsan at 02:14 AM on 23 July 2022Taking the Temperature: a dispatch from the UK
@ John Mason. The qualification parameters for entry into the CET record are not applicable to the CET.
The Met office comment on many observed temperatures, but those sources are not affiliated to the CET record, depsite the Met mentioning them. The Met comment on many temperature measurements every year, none of which form part of their managed CET record
Be honest you don't know if it was hotter 20 years ago in a place where there was no thermometer. Statictiscally possibl;e, as thermometers are located on such a small amount of area of the UK
-
One Planet Only Forever at 01:47 AM on 23 July 2022Taking the Temperature: a dispatch from the UK
Fixitsan @2,
The following logical understanding supports the MET Office warning about and reporting localized extreme maximum temperatures:
Heat can kill. And a person in a location of extreme heat does not have the ability to turn on the "National Average" to reduce the Heat they experience.
-
One Planet Only Forever at 01:30 AM on 23 July 2022Taking the Temperature: a dispatch from the UK
The daily average would more correctly be the average of the max and min temperatures that day. The night could be warmer.
-
One Planet Only Forever at 01:26 AM on 23 July 2022Taking the Temperature: a dispatch from the UK
Fixitsan @2,
A focus on averages by month would logically lead to comparing 'monthy averages' rather than hottest average day in a month.
That evaluation should Fix It for everyone concerned.
And an average would be the average of day and night values, not an average of the daytime highs.
-
John Mason at 01:16 AM on 23 July 2022Taking the Temperature: a dispatch from the UK
UKMO have just posted this:
https://www.metoffice.gov.uk/about-us/press-office/news/weather-and-climate/2022/july-heat-review -
John Mason at 00:51 AM on 23 July 2022Taking the Temperature: a dispatch from the UK
Not sure what point(s) you are trying to make here but let's start with your claim in paragraph 4. To wit: "when we saw our national record peak temperature occur (37.3 recorded by the Met Office, which does not include RAF airports as data sources"
Erm, the Met Office tweeted this on July 20th: -
Fixitsan at 00:15 AM on 23 July 2022Taking the Temperature: a dispatch from the UK
As a UK resident I have a vested interest in the situation we just experienced, although, being located 15 miles of Edinburgh I note that the rain we had on the hottest day of the year stood no chance of being reported as anything unusual, given the hysteria bias trending towards bad news selling better than good.
I awoke today to an outside temperature of 13 Celsius, so that was summer then, eh ?
The strength of reporting on local temperature highs always seems to be given more importance then another useful metric, the national average temperature.
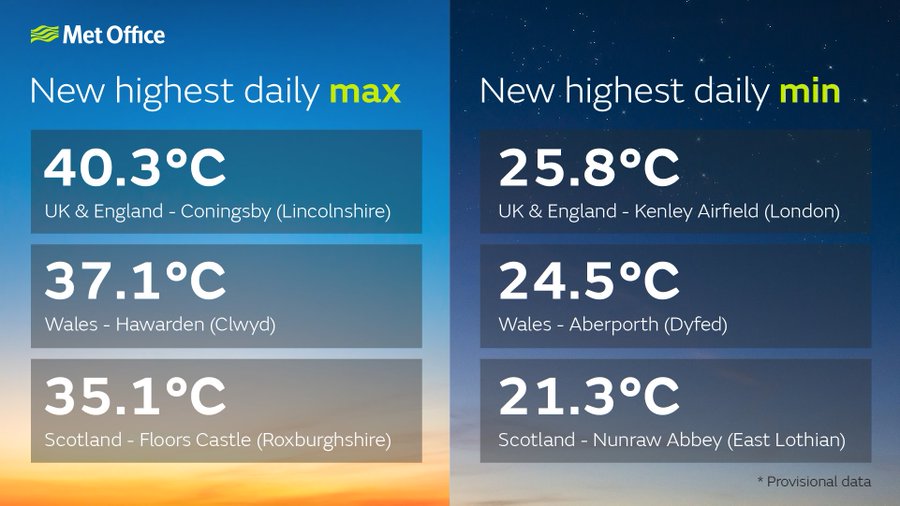
Perhaps it goes without saying that nobody would be surprised to hear that on the 19th July 2022, when we saw our national record peak temperature occur (37.3 recorded by the Met Office, which does not include RAF airports as data sources) , we also saw a new record in the national average temperature being broken, at 28.1Celsius (for the whole of the UK covered by the national temperature monitoring service)
This all relates to the recording of temperatures by the Met Office at Hadley Centre, who maintain the worlds longest running instrumental temperature record which began in 1659, known as the Central England Temperature record, CET, meticulously maintained by them, and data from which is at the core of many climate models.
So it was a record July for both peak and average temperatures. Regardless of whether you include an RAf station or not. Fair enough
Of course the data is still only temporally corelated to reality. Nobody knows for sure if last year we had the hottest peak temperature on record occuring between two measuring stations, hence why a high peak recorded temperature isn't quite as reliable as the national average, (although the press certainly seem to think there is more newsworthiness and therefore £'s creation potential in scary news about high peaks, disregarding averages in the process)
Therefore, sticking with national averages and not instantaneous single location peak temperatures seems a better guide to what is happening in terms of trends over a larger sample area, nationally, than a single point reading at an airport somewhere can be relied on for.
In turning to the data of the well regardied CET record now, for a look at other national daliy average (mean) temperatures the next month August was hottest in the year 2020. With 25.2C on 12th August 2020 (The highest peak for any August day, recorded by CET, is 33.4C on 3rd August 1990
This means if we use averages then we can see that the two months discussed so far have their record average tempertures occuring in just the past 2 years, eliminating all doubt that warming is occuring. Hopefully
So having shown the effectiveness of using a daily national average temperature, instead of an instantaneoud peak value, lets consider the other highest peaks
Highest average for any January on record ? That was 13.6C on 23rd Jan 1834. That's right, the most recent hottest January average temperature in the UK was at a time when Marie Antoinetter was consort to Prince Louis and Charles Babbage was still working on the design for the analytical engine
The highest February average ? 12.8C on 4th Feb 2004, anpother quite recent one
Hottest March ? 15.2C on 30th March 2017, more confirmation of recent warming here
Hottest April ? Bear in mind the story is that the industrial revolution is the cause of all global warming, it seems strange that both April and May highest averages both occur before 1800, arguably before the indurtial revolution really got going. How come all of the CO2 from the industrial revolution has yet to produce a hotter April or May average than a date before the revolution itself happened ? Very odd, but all reliable data nonetheless from the Met Office and the worlds longest running reliable instrumental temperature record
Hottest June ? 22.9C 3rd June 1947, the year the cold war began. Hasn't global warming made a hotter day than that in June during the past 75 years ? It appears not
July and August I've already mentioned
September ? 22.3C on 2nd September 1906. Cars had wooden wheels back then. Have all the emissions from all the cars made since then not made Septembers any warmer than in 1906 ? Definitely not !
October ?, more recently again, 20.1C on 1st October 1985. It's the year of Live Aid. But still, 37 years of death inducing global warming since then still hasn't given us a hotter October, yet
November ? 15.5C on 5th November 1938, 11 months before the start of WW2 in Europe. Didn't all the munitions emissions, and emissions from cars, and all the flights in aircraft and ships since the start of WW2 produce a hotter November than one before WW2 ? No !
December ? 12.7C on 12th December 1994. This means that every person born in Britain since 1994 have yet to experience a hotter December average temperature than the one in the year they were born, 28 years ago (but yet they might well be the ones which think it just keeps getting hotter month after month, given that they've also had the most exposure to the 'it's always getting too hot' paradigm, which is produced if you only look at randomly produced peak temperatures, and not averages
So to recap, lets recall the amount of serious messaging about climate change which probably dates back to 1989, when Mrs Thatcher addressed the UN and stressed the importance of a worldwide commitment to reducing CO2. Anything since then is a year in an era when it has been fine to suggest we might only have ten years left to live, or only a few days left before doomsday due to climate change, and recall how most of the CO2 was produced before 1989, so how come that of the 12 months in every year, only 5 of those months have been hottest since 1989, and 2 were hottest before the start of the industrial revolution (which apparently causes global warming, except not in April or May)
-
Bob Loblaw at 22:15 PM on 22 July 2022Taking the Temperature: a dispatch from the UK
"Can you spot 1976 amongst 2014-2021?"
Oh, I know! I know! Pick me! Pick me!
Could it be.... the one in the middle?
It's like watching an episode of Sesame Street:
One of these things is not like the others,
One of these things just doesn't belong,
Can you tell which thing is not like the others
By the time I finish my song? -
One Planet Only Forever at 07:03 AM on 22 July 2022Recklessness defined: breaking 6 of 9 planetary boundaries of safety
The analogy of the dangerous bus is good. But a Structure analogy may be better, though far less amenable to engaging and colourful story-telling.
An important point is the unsustainability of life on this planet if any of the identified safe limits (boundaries) are exceeded. A related understanding is that it is likely that additional Boundaries will be identified (the ‘Novel Entities’ category is for newly identified boundaries). And the competition for popularity and profit has proven it is very unlikely to investigate and limit the harm done by its developments.
The Structure analogy would be something like this:
- This amazing planet is the only structure/system available to humans that is certain to be able to support life that humans can be a sustainable part of.
- An environment developed that has sustained a diversity of life for millennia. Life evolved in ways that were sustainable parts of the developed evolving structure/system.
- Like any physical structure (building), parts of the global life support structure can be degraded. What is important to the future of life is that ‘critically important aspects of the structure are not impacted beyond the safe limits (degraded or over-loaded)'. The Planetary Boundaries are critically important structure aspects. In Structure design they would be like the elements of the Primary Structure System. If part of the primary system fails the entire structure will fail. The life support structure is at risk of failure if any of the critical boundary safe limits are exceeded. And the magnitude of the failure will increase the longer, and more severely, any safe limit is exceeded.
- Through the millennia the global life support structure has had parts (regions) develop to be very unlivable ‘considered to be deserted’. But the changes were almost always gradual enough, or localized, allowing life to continue to evolve and adapt to the slow changes. However, occasionally something happened that pushed things beyond a global safe boundary for life and did it so rapidly that a lot of life perished.
- It is helpful to identify which boundaries are beyond the safe limit. But what is more important is the history and current trend regarding each critical concern. Ocean acidification looks OK at this moment (below the safe limit). But if the trend is ‘rapid recent increase likely to continue that way for a while’ then it is a potentially larger problem than a case where impacts are beyond the safe limit but are declining. And that ‘trend rate’ evaluation would clearly indicate that Climate Change is a major problem (note: in the original Planetary Boundary evaluation, done only a few years ago, Climate Change impacts were below the safe level).
Humanity has developed, for the first time in history, to undeniably be ‘pushing things beyond global safe boundaries for life so rapidly that a lot of life has and will perish’. Many critical aspects of the planetary life support structure are being rapidly severely degraded because of ‘human development’. And many, but not all, members of the developed global leadership (the global wealthy and powerful) struggle (fail) to help stop the obvious undeniable destruction. The unhelpful ones try to:
- maintain their status in the Status Quo (maintain popularity and profitability)
- deny or diminish the severity of problem (promote deliberately misleading marketing to get people to misunderstand the issue)
- stifle, threaten, or attack anyone who tries to raise awareness or improve understanding of the problem and the required corrections of the developed Status Quo.
-
One Planet Only Forever at 03:41 AM on 22 July 2022Recklessness defined: breaking 6 of 9 planetary boundaries of safety
Hedeholt @2,
I tend to agree that ‘developed measures of poverty and its reduction’ (said that way for a good reason), are not based on a fuller understanding of what is going on. The Sustainable Development Goals do a decent job of presenting the required corrections of what has developed. And limiting global warming impacts makes it easier to achieve and improve on the SDGs.
Indeed, independent farming families can incorrectly be counted as ‘living in poverty’ if they do not appear to participate in economic activity. And they can be harmed by having global trade reduce their ability to benefit from selling their produce in their local markets. But in many cases their lives can be at unnecessary risk due to many things including:
- a lack of sustainable access to food and water (lack of assistance in times of need)
- a lack of health care
- a lack of education (including not learning how to farm more sustainably)
Properly discovering who needs help to sustainably improve their lives is challenging. Many people living in rain forests only need to have the negative impacts on their environment ‘by others’ stopped. They only need ‘assistance’ if the harm done to their environment will not be stopped.
That is a way to understand many developed problems. ‘An individual or collective portion of humanity’ develops activity that is beneficial (profitable) for them or their group (sub-set of humanity), but is understandably detrimental to other life (including, but not restricted to, future generations of humanity). And that group mislead themselves and others into believing that their actions are ‘not unacceptably harmful’ or that their harmful unsustainable activity benefits other humans. They try to claim that the broader benefits of their harmful profitable pursuits include reduced poverty levels. But they do not rigorously investigate their claimed benefits to ensure that the improvements are valid and sustainable.
That understanding applies to the Ozone case (and climate impacts and so much more):
- Some humans developed ways of personally benefiting that were damaging the ozone layer.
- The ones benefiting did not investigate if what they were doing was harmful.
- Eventually, people external to the systems of pursuit of benefit discovered that harm was being done and how it was being done.
- The marketplace competition for ‘more perceptions of improvement’ failed to respond to becoming aware that the developed popular and profitable activities were harmful.
- Even learning that the damage done to the ozone layer was going to be harmful to the ones benefiting from the damage done did not result in effective marketplace corrections.
- It took some time, but eventually global leadership powers agreed to actions that would collectively reduce the harm done. But even their agreement allowed harm to continue to be done. Each nation’s leadership was allowed to decide how rapidly they would stop the harmful activities.
The Climate Impact story goes beyond the story regarding Ozone impacts.
An added step in the climate impact story is the massive continuing efforts by ‘beneficiaries of fossil fuel use’ to raise doubts about the need to rapidly stop the harmful activity, efforts to delay correction of what has developed. And one of their most twisted misleading marketing efforts is claiming that reducing fossil fuel use will harm the poorest.
The only people who can really be excused for attempting to benefit more from fossil fuel use today are the people who are living less than basic decent lives (including the desperately poor in the supposedly more advanced nations). The richest can afford to reduce their pursuit of fossil fuel benefits (they could have afforded it 30 years ago). And the richest should be helping the poorest improve their lives with minimum harm done, with minimum pursuit of benefit from fossil fuel use, even if that causes the richest to lose some degree of their ‘developed perceptions of superiority’.
-
hedeholt at 00:02 AM on 22 July 2022Recklessness defined: breaking 6 of 9 planetary boundaries of safety
I agree totally in the dangerous way we 'drive' right now. However, at the same time, to me the metaphorical story misses the point and especially in its post-script talking about the 'successes'. To me (and others) is the extreme poverty graph based on a false narrative that instead, arguably, shows how more self-sustained (often productive small local farmers) been made to consumers of goods in a global marked driven economy that make the same person living a much more 'poor life' in the outskirts of global south’s megacities. Having their own small farm didn’t require money to live a decent life, while you with even 10 USD/day become much more vulnerably and miserably if you need to buy everything you need (in spite of statistics claiming the opposite). I recommend Jason Hickel’s book “The Divide” (2017), and especially its second chapter, for those interesting in data and discussions underpinning this alternative explanation. I’m not very sure about the details re the ozone hole, but I suspect that that challenge rather became a market opportunity, than something that question the kind of system and way of ‘driving’ we have today?
-
David Hawk at 21:00 PM on 21 July 2022Recklessness defined: breaking 6 of 9 planetary boundaries of safety
Well said. In 1985 this might have been ignored as ad hominen material. In 1975, when I managed a major Swedish environmental deteioration project, showing why we are incapable of managing phenomena like climate change, this story of the human bus would have been laughed at. In 1979, when the results of that project were presented to OECD, a very angry Director of the US EPA called it a hoax. Now that climate change is essentially outside management, we see this sotry as "interesting." Humans?
A 2019 book, "Too Early, Too Late, Now what?" republishes the 1979 work and is "interesting." A 2022 clarification of the thesis urgency was seen as a "non-book" by Amazon and sold in candles, so you could morn as you read. After dessent by book buyers it was moved to the T-shirt section, where harsh depression is placed by youth up front.
Moderator Response:[BL] Once again, you are treating each post you make as a chance to advertise your old book. In the future, any such comments will be deleted in their entirety, instead of just deleting the offending portion.
You are violating the "Excessive repetition" section of the Comments Policy (as well as, possibly, the .no spamming, sloganeering, and off-topic sections).
Please note that posting comments here at SkS is a privilege, not a right. This privilege can be rescinded if the posting individual treats adherence to the Comments Policy as optional, rather than the mandatory condition of participating in this online forum.
Please take the time to review the policy and ensure future comments are in full compliance with it. Thanks for your understanding and compliance in this matter.
-
scaddenp at 06:40 AM on 20 July 2022It's cooling
Rationalise - "Dr Tom" is just another anonymous person on the internet. It would correct to be very skeptical about such pronouncements. It is another story however when looking peer-reviewed scientific papers and another again when looking at a strong scientific consensus. The IPCC reports try to capture that consensus in their reports. If you want to see what that consensus is on impacts, then look at WG2. It is sobering enough.
-
Bob Loblaw at 01:52 AM on 20 July 2022It's cooling
Rationalise @ 320.
Welcome to Skeptical Science. Glad to hear that you are looking through the material available here - there is much useful information available.
This web site has a specific goal: to take many of the myths that exist in the understanding of climate science and show what the science actually says. These are labelled myths because there is strong evidence that they are incorrect. They are not dismissed because they are speculative, or because their "conclusions" are disliked - they are dismissed because of the evidence, which is the way science works.
One of the other things you will find here is information on the rhetorical and logical tactics and fallacies that are often used in promoting these myths. For example, the argument that you appear to be making - that science advances through ideas that run contrary to established thinking - is known as the Galileo gambit. Not all "contrary thinking" is a Galileo gambit, but it is one false argument that has been commonly used in the climate science "debates". We even have a page devoted specifically to it here at Skeptical Science:
https://skepticalscience.com/climate-skeptics-are-like-galileo.htm
Also note that here at Skeptical Science, there is a strong desire to keep comments on topic. Please review the Comments Policy, where this is one of the key points. (There is also a link to the policy above the box you use to enter comments.) If you wish to pursue your line of thinking, the above Galileo post is a better place than here, where the myth being debunked is that the globe is cooling.
Also note that each myth debunking usually has Beginner, Intermediate, and (sometimes) Advanced tabs that can be read for more and more detail.
-
One Planet Only Forever at 01:27 AM on 20 July 2022It's cooling
Rationalise @320,
My personal beliefs (open to improvement) include:
- learning (improved understanding) is developed by the pursuit of increased awareness of what is going on (evidence and thoughtful consideration consistent with all of the evidence) with a focus on limiting harm done.
- Science efforts that are not focused on improving understanding and limiting the potential harm done, especially the potentially devastating science of marketing, can be very bad.
- Increased awareness of the evidence limits the range of reasonable explanations of what is going on (and exposes misleading marketing). Obtaining more evidence legitimately cancels (corrects) beliefs that are inconsistent with the evidence.
That is what science pursues - improved understanding of what is actually going on. Science can be especially helpful when it exposes new areas of improved understanding, like discovering harmful consequences of popular and profitable pursuits of personal benefit that had not been investigated or were attempted to be hidden or be doubted by people benefiting from harm done.
Based on those beliefs (understandings), I am pretty sure that the inconsistencies of each Climate Myth vs. the available evidence and a more consistent, but open to improvement (common sense), understanding has been presented. Of course, new evidence (not different opinions) could change the developed, open-to-improvement understanding.
-
Rationalise at 23:45 PM on 19 July 2022It's cooling
I've been browsing through this website and find it all very interesting. However there are some fundamentals that concern me. At the top of each page there are two sections titled "What the science says" and "Climate myth". Is this really how science and discovery is supposed to work? That opposing opinions are divided into "fact" and "myth"? Hasn't it been so that throughout recorded history that individuals have stood alone against 99% opposing consensus, even to the point of enduring persecution and cancellation? In fact haven't many of the greatest discoveries of all time been railed at by the majority? The fact is that there is always the possibility of a factor hidden from the multitude that's staring one lone individual right in the face. Isn't your "Climate myth" section a modern day equivalent of the medieval pillory with the data you have on hand the equivalent of fruit for the throwing?
I was very interested to note in the comments back in 2010 where a contributor calling himself Dr Tom stated unequivocally that Atlantic Bluefin Tuna would be extinct by 2012 and humans possibly as early as 2020. 12 years on and Atlantic Bluefin Tuna now have a conservation status of least concern. As to humans, I can't see too much evidence of extinction at the moment. Moral of the story is, don't fall for climate alarmism/extremism or characterise sceptics as misinformation peddlers. That's medieval and we really don't know what's around the next corner or what new discoveries may blow all conventional wisdom to kingdom come.
-
nigelj at 11:16 AM on 19 July 2022104°F? A Continental heat wave heads for England
Heatwaves are being made worse by climate change, and they put huge pressure on hospitals, adding to the pressure of the covid pandemic, the rise in treatment resistant infections, and an aging population. Hospitals surge capacity probably just can't cope with this alarming combination of things. The future is looking very tough for the health sector. Its going to need massive financial investment.
-
Bob Loblaw at 10:29 AM on 19 July 20222nd law of thermodynamics contradicts greenhouse theory
Grindupbaker:
Sorry for the colloquial jargon, but yes, "bog standard" indicates agreement - basically, nothing remarkable or exceptional about the statements.
As for absorption and emission: these happen at the molecule/photon level. As soon as you start invoking Stefan-Boltzmann, Planck, etc. then you are by necessity looking at statistics of large numbers of molecules. For a single emitted photon, the direction is random. For a large collection, the emissions are isotropic. Any two halves of the sphere are "equal".
Radiation transfer is a continuous process in the real world, and anything dividing it up into layers is already a simplification. A finite difference approach to a continuous function - the same way a slope between two points compares to the derivative from calculus.
As soon as you are talking about layers, adjacent layers need to be consistent. What goes out the top of one layer goes into the bottom of the next, and vice versus. For any layer, the IR flux out of it can be either emitted from that layer, or it can be transmitted transmitted through that layer from previous layers. As all photons of the same wavelength are the same, there is no way of identifying which is the case. Flux out of a layer is not equal to emissions.
The 199, 200, 201 W/m2 example was a very simplified thought experiment to illustrate how your "it can't be 50%" argument was wrong. The flux can and does vary with height, and that does not break the equal up/down emission rule. The up/down aspect has a formal label: the two-stream approximation. The combination of the Beer-Lambert Law (for absorption) plus emissions of IR radiation, leading to a net IR flux along a temperature gradient also has formal solutions, one of which is called Schwarzschild’s equation. All of these are still approximations - but useful ones.
Eli has a good discussion of the time constants for re-emission vs. thermal collisions. If you want to distinguish between (1) energy that is absorbed and emitted by the same molecule from (2) energy that is absorbed by one molecule, transferred to another molecule and emitted from that second molecule - and want to restrict "re-emitted" to the first case - then you are welcome to add to your collection of pedant points.
Eli also has a good presentation on why you cannot think of any of this solely on the basis of radiation transfer - all energy fluxes in the atmosphere play a role.
Your habit of referring to diagrams as "cartoons", and your desire to "..challenge the ubiquitous 'greenhouse effect'..." suggests that you think that you have something new to add. You don't. You are taking simplified explanations, criticizing them for their incompleteness ("All models are wrong. Some are useful."), and replacing them with your own incomplete explanations. To quote MA Rodger in #1508, "I'm not sure your efforts assist in such general descriptions."
And as MA Rodger has also pointed out, this is really getting off topic for this particular climate myth, which is supposed to be about the second law of thermodynamics.
-
MA Rodger at 21:11 PM on 18 July 20222nd law of thermodynamics contradicts greenhouse theory
grindupBaker @1509,
You ask about a particular statement within this talk by Jennifer Kay 2021 'How do clouds affect global warming?'. @6:30 the video addresses the question "How do clouds affect the mean climate?" pointing to a net global mean effect of -21.1Wm^-2 (thus cooling), this comprising -47.3 Wm^-2 (cooling effect) due to albedo and +26.2 Wm^-2 (warming effect) due to a "longwave effect." Thus the statement:-[From 8:04] "Clouds also have a longwave effect on the system. Just like greenhouse gases in the atmosphere, clouds absorb and re-emit long wave radiation and that actually causes the surface and the atmosphere to be warm."
My own objection to this statement would go no further than pick up on the use of the term "re-emit."
Your objection that "only a tiny portion" of the LW radiation arriving at the surface were 're-emitted' from clouds apparently expresses a similar concern.
But I'm not sure why you would then go beyond simply suggesting the replacement of "re-emit" with "emit". You appear to want to distance these cloud IR emissions from surface warming with description of them setting off "absorb-and-re-emit cycles before succeeding in achieving surface absorption," a description that deploys the very same objectionable "re-emit" term.The point the video makes is that the climate system ("the surface and the atmosphere") is warm to the level it is significantly because of this long wave cloud effect. And I think we agree it is this warmth that sets the level of IR whizzing about in the atmosphere as well as the level being absorbed and emitted by the surface.
(And as a point of note: I recall that perhaps some 10% of the LWR from clouds will be due to reflection and presumably some will be directly returning surface-emitted IR back to the surface.) -
grindupBaker at 16:03 PM on 18 July 20222nd law of thermodynamics contradicts greenhouse theory
MA Rodger @1508 Your "grindupBaker @1507, You ask ... that atmosphere." Thanks. I'll put some thought this winter into wording gooder that bit because "sourced from surface re-emit" is precisely what I object to as being stated as the source of all downwelling LWR at surface and yet the Bob Loblaw glossed right past "re-emit" and focussed a challenge on 50% when I could have readily typed "most" or "some" or "a bunch" instead of "50%" without changing the meaning of my objection at all, and then you stated outright that I was silent ("unchallenged") on "re-emit" so my phrasing there is somehow poor. It isn't just a junk-science cartoon, it's one of the scam types that have served the "Skeptic" community very well the last couple of decades (Henrik Svensmark did a nice one). That junk-science cartoon is the nasty, cunning Scam of Omission (aka The Dog That Barked in The Night). A photon leaves surface, absorbed by CO2 molecule, re-emitted upward, no change, another photon leaves surface, absorbed by CO2 molecule, re-emitted downward, warming surface, got trapped (maybe a couple of repeats in cartoon). It's obvious even to an uneducated mind that this will cause warming so the "greenhouse effect" makes perfect sense. However, an uneducated mind doesn't think to wonder "so is this all that CO2 molecule does regarding photons then ?". The cartoon states outright that the CO2 molecule never gets vibration due to a collision and then sometimes emits a photon in a random direction even though it didn't absorb a photon to re-emit. I could modify that cartoon to show that CO2 molecule emitting 2 photons without absorbing a photon for every photon it absorbs and then adding a CO2 molecule increases upward radiation, so using that junk-science cartoon I could show the public how increased CO2 is actually cooling Earth and how "they" have been deliberately leaving this out to fool people as a hoax. Of course, we both know that radiation to space must decrease with increased tropospheric GHGs because the average emission level becomes higher, becomes cooler and emits less. The bods presenting that cunning Scam of Omission cartoon need to be brought to task by presenting the "greenhouse effect" correctly (like Andrew Dessler does) or the public is going to think it's all a scam when what I've pointed out here is pointed out to them in a form without explanation that's not designed at all to educate them.
Do you concur with physicist climate scientist Jennifer Kay statement at 8:09 at https://www.youtube.com/watch?v=kE1VBCt8GLc that "clouds absorb and re-emit long-wave radiation and that actually causes the surface and the atmosphere to be warm", or do you concur with me that Jennifer provides incorrect physics regarding what "actually causes the surface ... to be warm" because only a tiny portion of the photons that arrive at the surface are "clouds absorb and re-emit" photons, with the vast majority being "manufactured by H2O collisions in clouds" photons (with any number 0 to n of interim absorb-and-re-emit cycles before succeeding in achieving surface absorption) ?
-
MA Rodger at 22:26 PM on 17 July 20222nd law of thermodynamics contradicts greenhouse theory
This interchange is getting rather forensic and probably unproductive. All agree. There is a troposhperic lapse rate. Radiation from the atmosphere goes in all directions so at any point the net radiation flux emitted by the atmosphere will be 50% one way and 50% the other, this with the caviat that the lapse rate reduces temperature with altitude and thus emission reduces with altitude (at least within the troposphere).
grindupBaker @1507,
You ask for confirmation that absorbed radiation is transferred to atmosphic thermal energy through mollecular collision. This is entirely correct. The average relaxation time for an excited molecule to re-emit is measured in hundredths of seconds while the atmospheric collisions occur in microseconds. Indeed, one of the points I would have made concerning your statements @1505 was use of the term "re-emit" which you allow unchallenged. It is the temperature of the atmosphere that determines (almost all) the radiation it emits, not the radiation being absorbed by that atmosphere.I guess your comment (not a lot to do with laws of thermodynamics) is prompted by the often dreadful descriptions of the greenhouse effect we all encounter. But I'm not sure your efforts assist in such general descriptions.
When discussing the greenhouse effect, it is usually not linked to albedo (as you do) and is best seen in terms of the effective height (and thus temperature) at which the planet radiates to space. Thus it is not so much 'cloud thickness' which you imply @1505 is the important factor, but it is the 'cloud height'.
Trying to aportion the strength of the GH-effect to particular atmospheric constituents is far from straightforward as their contributions are interdependent. Thus to say O2 & N2 have no part to play is wrong as without them you get a Martian atmosphere which has an insignificant GH-effect. And specific to Earth, while H20 (gas, liquid and solid) is bigger player than CO2, it requires the CO2 to get into the atmosphere.
Trying to aportion the sensitivity of the GH-effect to particular atmospheric constituents is also far from straightforward. -
grindupBaker at 15:04 PM on 17 July 20222nd law of thermodynamics contradicts greenhouse theory
Bob:
Change my "Cartoons or text that describe a "greenhouse effect" in which photons from the surface are absorbed by infrared-active gas molecules and then are re-emitted with 50% of it going down and warming the surface are incorrect because they do not include a tropospheric temperature lapse rate which is an absolute requirement".
to
"Cartoons or text that describe a "greenhouse effect" at the surface which is caused entirely, or even mostly, by photons emitted from the surface being absorbed by infrared-active gas molecules and then re-emitted with 50% of it going down and this 50% adding energy at the surface are incorrect because they do not include a tropospheric temperature lapse rate, which is an absolute requirement".My reasoning is that I assert that >99% of photons from molecules in the atmosphere arriving at the surface were emitted by molecules of solid, liquid or infrared-active gas due to them having obtained molecular vibrational kinetic energy on collision and then relaxed and emitted a photon downward, which made it to the surface, and <1% of photons from molecules in the atmosphere arriving at the surface were emitted by molecules of solid, liquid or infrared-active gas due to the sequence of (1) photon upward from surface ---> (2) absorbed by molecule of solid, liquid or infrared-active gas making it vibrate ---> (3) spontaneously re-emitted (4) repeat (2)(3) any number of times whatsoever (5) photon arrives at the surface. Since this >99% vs <1% ratio is the case those cartoons (...and then the rest of my revised refutation of the cartoon that's bandied about).
I don't have the foggiest clue what "bog standard" is and I don't see that your second sentence informed anything about this topic. It appears to just be a weird way of typing "I agree with you".
I assume that your 2 consecutive sentences "The 50% up, ... "downward". You could also ... is most useful" refer to emissions by a single molecule analyzed over sufficient time. I agree with that of course, it's random.
Your 3 consecutive sentences "And it is most useful ... below this one?" "The layer above this one ... downward". "The layer below this one ... downward" are self contradictory because you state that there is 199 W/m2 downward and 201 W/m2 upward at the junction (your "a single height" == junction) between the 2 layers yet there is 200 W/m2 emitted upward, and 200 W/m2 emitted downward at the junction between the 2 layers.
I see no meaning in your "at any single height the locally-emitted IR is equal up and down" because you haven't spatially defined "locally-emitted". How may molecular widths or Angstrom units is the vertical limit for the IR to be considered "locally-emitted" ? I don't know the minimum required size of the infrared-active gas parcel for the Stefan-Boltzmann radiative equation to be accurate to say 5 decimal places so I can't contribute other than stating like "I'm pretty sure 5 molecules thick is too thin to do accurate radiative assessments and I'm pretty sure 200 metres thick is thick enough to do accurate radiative assessments".
Do you agree with me that infrared-active gas molecules sometimes, probably very often, lose a molecular vibrational kinetic energy upon collision, with its energy going into increased molecular translational kinetic energy and/or molecular rotational kinetic energy ? If you don't agree and can point to physics refuting that then I'm incorrect in challenging that ubiquitous "greenhouse effect" cartoon and I'll drop that and stop describing the "greenhouse effect", but if you confidently agree with me on that then debate between us on this topic comes down to semantics and thoughts expressed a tad too casually for full accuracy.
-
One Planet Only Forever at 07:56 AM on 17 July 2022Skeptical Science New Research for Week #28 2022
Doug,
I appreciate that there are more rigorous/robust ways for a team to do the investigation/evaluation that Reynolds performed solo. But after reading the presentation and reflecting on it I am updating my initial comment.
Reynolds makes good points about summary statements and press releases needing to be consistent with the understanding of the evidence. However, the following quotes appear to indicate that the author lacks awareness of the evidence and understanding of the bigger picture that SRM is a part of.
Quote at the end of Case 1 evaluation:
“Whether the disruption of the Asian summer monsoon is enough to argue against SRM depends on other scientific questions (What would be the expected agricultural impacts? How would evaporation and water availability change? Could water storage and irrigation systems mitigate any negative impacts?) as well as normative and political ones (Would the reduction of other climate change impacts outweigh this regional precipitation one? Could other countries and regions compensate negatively affected areas?)."
Quote in Discussion:
“Likewise, one could argue that my critique of the generalized assumed regime implicitly assumes that SRM would be used in a nearly optimal, globally coordinated manner. However, the papers in question generalize assumed regimes that would be in multiple actors’ interests and likely within their capabilities to prevent.”
The author appears to be unaware of the history of failure of multiple actors to collectively prevent harm done by ‘actors pursuing benefit from actions that harm Others’ (not just the case of failure to limit global warming impacts). Total human wealth has grown far more rapidly than global population. In spite of centuries of perceived per capita advancement, many less fortunate people still live far less than decent basic lives and die unnecessarily early deaths. And perceptions of advancement and reduction of poverty due to unsustainable harmful activity like fossil fuel use are not sustainable impressions of improvement.
The following quote in the Discussion is also questionable.
“My critiques of inappropriate reference world and focus on the residuals assert that SRM should be compared with a world of elevated GHG concentrations, not a preindustrial one.”
SRM evaluations, like any other scientific investigation of part of a bigger picture, should be consistently presented in the context of understanding of the bigger picture. For SRM, the bigger picture is the requirement for global leadership action to limit peak ghg impacts to 2.0C (ideally limiting impacts to 1.5C) plus actions to rapidly bring CO2 levels back down to 350 ppm (or perhaps even lower would be better) and strictly limit other ghgs. That understanding should be the ‘reference world’ (baseline) for evaluating the potential benefit of ‘temporarily adding SRM’. And SRM, temporarily applied that way, needs to be proven to harmlessly provide global benefits. The major challenge would be to have near certainty that there would not be harm done by ‘adding SRM’. Until global leadership consistently proves its ability to rapidly effectively limit and remedy harm done by pursuits of benefit, it is inappropriate to encourage any ‘added’ actions that may be harmful in spite of perceptions of improvement.
A Building Code analogy would be better than my original comment example of medical treatments needing to be ‘real world tested’ to prove they are safe and helpful before being used to ‘safely actually help a patient’.
A Building Code analogy highlights that the important evaluation of SRM is not a focus on bits of hoped for benefits like: less warming, less sea level rise, or less storm intensity. In a Building Code analogy, SRM is like a ‘novel building system’. It is not a rigorously proven ‘tried and true’ system.
Building Codes present minimum checks to be performed on known and proven to be reliable structural systems. They make it clear that ‘novel materials or systems’ (not already well proven) must be proven to be reliable safe ways of building a structure before they are used. And it appears to be virtually impossible to ‘prove the safety of the novel SRM system in the real world before SRM is implemented’.
From a Building Code analogy perspective SRM would not be within the realm of relevant helpful options for scientific investigation. Investigating SRM ‘benefits’ without focusing on the potential for harm would be in the realm of fantastic (fantasy) science investigation. It may produce interesting ‘new understanding’, but should not be a prominent focus of investigation.
That leads to the same conclusion as my original comment:
Never lose focus on the need to limit harm done. And never forget how unexpectedly (shockingly knowingly) harmful human actions can be.
-
Bob Loblaw at 11:15 AM on 16 July 2022Supreme Court sharply limits EPA power plant authority
Phillippe:
As I mentioned above, it may be that David-acct meant "enforce" in the sense of creating, but he will have to explain what he meant.
-
Eclectic at 11:01 AM on 16 July 2022Supreme Court sharply limits EPA power plant authority
Each side acts behind a veil of words.
In the end, it comes to power politics : who-can-get-away-with-what.
And we ourselves can choose to be a bystander or a participant.
-
Philippe Chantreau at 08:01 AM on 16 July 2022Supreme Court sharply limits EPA power plant authority
David-acct: " the executive branch can not enforce regulations"
US government official source: "The executive branch carries out and enforces laws."
I know who I'm going to believe on this one...
-
Bob Loblaw at 03:12 AM on 16 July 2022Supreme Court sharply limits EPA power plant authority
If you read the blog post, the disagreement between the majority and minority views within SCOTUS rest on the question of what sort of decisions need explicit legislative expression, and what can be delegated to the agency to decide on its own. ("Major questions doctrine").
Two quotes in the post, from the dissenting side, that strike me are:
Justice Kagan also expressed concern that the majority did not clearly define what constitutes a “major question,” meaning this ruling creates uncertainty for the future of federal regulation.
and
Kagan accused the current court of being “textualist only when being so suits it. When that method would frustrate broader goals, special canons like the ‘major questions doctrine’ magically appear as get-out-of-text-free cards.”
This strikes me as letting politics overshadow law (on the majority opinion side). Not a good sign, IMHO.
-
Eclectic at 15:27 PM on 15 July 2022Supreme Court sharply limits EPA power plant authority
Bob Loblaw @6 and David-acct @5 :
[Opinion] The concept of the Separation of Powers was "cutting edge" political thinking in the 1600's and 1700's. The famed American Constitution was a great achievement for its time. But, with the wisdom of hindsight, there is much room for criticism & improvement ~ only part of which has been "fixed" by Constitutional Amendments.
Analogy : the famed first airplane - the Kittyhawk biplane - was a great achievment. Cutting edge. Two pairs of wings, and a control lever system. [Stretching the analogy . . . the Congress, the Executive, and the SCOTUS.] Subsequent developments included the triplane with three pairs of wings. [The third pair corresponding to the States Legislatures?]
By analogy again : Adam Smith's economics theory (largely laissez-faire) was well-suited to the village economies of the 1700's and prior times. Unfortunately, the subsequent growth of city populations and of new technologies & communications , has led to a complex society which requires complex control systems (just as an elephant's body requires more complex systems than does a simple earthworm).
The point I am coming to, is that nowadays there is much overlap in the functions of Congress, Executive, and SCOTUS. In practical terms, we cannot regard them as fully separate. We engage in faulty thinking if we believe complete separation is possible ~ we are guilty of a False Dichotomy (Tri-chotomy?). We waste our time if we see Separation as being some form of Holy Writ which must never be questioned or examined or modified. The Constitutional Founding Fathers dealt with the problems facing them, and made a remarkable experimental creation. How could they have foreseen the problems of future vast developments? (including the current gridlocked paralysis of Congress/Executive . . . failing to deal intelligently with problems.)
To boil it down : please put aside doctrinaire thinking, and look at the realites. The reality is that all "wings" and control levers are influenced/manipulated by powerful individuals & groups ~ and we live in a plutocracy only slightly mollified by the democratic citizenry. Twas ever thus, throughout history. Nevertheless, we must do better.
And on the airplane analogy : there are still a lot of Fokkers** who still favor a triplane design. ** a Red Baron reference, of course ;-)
-
Doug Bostrom at 12:24 PM on 15 July 2022Skeptical Science New Research for Week #28 2022
Speaking after hours and with tools down, it seems to me also that Reynolds is veering into the other lane, enough to see paint lines passing beneath tires. Hence "replies" rather than "answers."
When it comes to investigating and characterizing communications of the kind treated by Reynolds, it's a very good thing to have a group of "coders" parsing raw data. Typically this would apply to responses to open ended questions in surveys. It's a standard, reliable means of neutralizing researcher biases, part of the social sciences survey methodology toolkit. Here we don't have a "survey" per se but we do have communications that may unpack differently when read by different people, and the same improving methods and practice would pertain.
Reynolds' methods section mentions nothing about coders. Reynolds is distinguished in his field, but for matters such as this perhaps would do well to team up with a colleague more centered on social science research methods (and here I'm speaking far beyond my own pay grade but this is still a fairly uncontroversial suggestion, I think).
[Upon further reflection, it's surprising that this piece wasn't offered as a "perspective" but rather is classified as a research article, especially given its apparent total reliance on the author's personal, necessarily unique interpretations of communications he cites. And it does seem that after our stellar performance in the "unintended consequences" department over the past 250 years or so, an abundance of circumspection is arguably a virtue, not a fault.]
-
Bob Loblaw at 10:36 AM on 15 July 20222nd law of thermodynamics contradicts greenhouse theory
Grindupbaker:
Your formatting and general writing style make it hard to understand exactly what point you are trying to make. Most of the first part seems to be bog standard radiation and cloud physics.
The point where I disagree with you is where you say "...and then are re-emitted with 50% of it going down and warming the surface are incorrect because they do not include a tropospheric temperature lapse rate which is an absolute requirement. "
The 50% up, and 50% down is entriely correct. In fact, the IR emission rate is completely independent of direction, and is equal in all directions - spherical, to be precise. One half of that sphere is summarized as "upward", and one half is summarized as "downward".
You could also do two halves going horizontally - e.g., north/south, or east/west - or any other direction you wish, but the up/down summary is the one that is most useful.
And it is most useful for the reason you touch on: the vertical temperature gradient. If you think of a single height, where you have 200 W/m2 emitted upward, and 200 W/m2 emitted downward, you need to ask "what about the layers above or below this one?"
- The layer above this one is probably cooler, so it might be emitting 199 W/m2 upward and downward.
- The layer below this one is probably warmer, so it might be emitting 201 W/m2 upward and downward.
- so each layer is surrounded by other layers that are emitting more (if warmer) or less (if colder), so that you have a net IR flux from warm to cold. Even though at any single height the locally-emitted IR is equal up and down.
- The total IR flux (either upward or downward) at one height is a combination of the IR emitted in that direction plus an IR transmitted from layers "upstream", minus the IR absorbed at that height.
- Three different terms, that you need to think of individually: emitted, absorbed, transmitted.
The reason any horizontal "halves" of the IR emission sphere are of little interest is because the temperature gradients are so small. No temperature gradient - no net IR difference.
And you are correct that local heating/cooling is dependent on the aborption of that radiation - plus any exhanges of non-radiative energy (convection, evaporation/condensation of water), minus losses through emission.
-
Bob Loblaw at 09:56 AM on 15 July 2022Supreme Court sharply limits EPA power plant authority
Or are you using the phrase "enforce regulation" to mean "create it"?
Regulations passed by the legislative branch can and will be written to provide flexibilityto the executive branch, as in my speed limit example. The executive branch could be assigned the task of improving highway and road safety, and the flexibility to choose to do this via speed limits, traffic controls, driving test requirements, etc. The legislative branch does not need to pass a law stating every individual aspect of what is allowed on any individual road.
-
Bob Loblaw at 09:52 AM on 15 July 2022Supreme Court sharply limits EPA power plant authority
David-acct:
The executive branch cannot enforce regulation? Then who does? The judicial branch? That only includes the judges and court systems, not the police, not the bulding inspectors, health inspectors, not the tax auditors, etc.
In my definition of "executive branch", I am including pretty much all the government departments, all the government employees that work in them, etc. And yes, they act as a consequence of the duties assigned to them through legiislation. But legislation includes assigning responsibilities to monitor and assure compliance with the laws that are passed, adjust regulations, and charge people that break those laws.
In what you appear to be claiming, the legislative branch would have to approve each indivudal speed limit on each individual road, instead of giving the executive branch the power to assess appropriate speed limits, set them, and pursue offenders.
-
One Planet Only Forever at 08:15 AM on 15 July 2022Skeptical Science New Research for Week #28 2022
“Communication of solar geoengineering science: Forms, examples, and explanation of skewing” is interesting with some points meriting some consideration. I have not thoroughly read the item. But I have read enough to make the following critical observations (making no mention of points I consider worthy of consideration). I will carefully read the entire document to see if my initial impressions presented below need to be revised.
1. The author appears to have sought out examples that fit their desired conclusions. Then they played some games to get a 'best fit'. They provide no examples of the opposite of the type of examples they chose to focus on.
2. The author appears to be unaware that there is an important distinction between solar radiation modification (SRM) and medical treatments (they make many subjective comparisons between SRM and medical treatments - like "This important distinction can be clarified by analogy. Despite its own risks and negative side effects, chemotherapy is sometimes used to treat cancer."). Most medical treatments by something like:
- initial rigorous testing on non-humans,
- if the non-human treatment passes that initial testing then testing is done on a small number of carefully selected humans,
- if that testing is passed then testing is done on a larger and broader population,
- if that testing is passed then testing is done on an even larger and broader population.
And medical treatment tests are often done for a long periods of time to potentially discover unanticipated long-term consequences. COVID-19 vaccine testing was an exception to the longer-term testing of other medical treatments because of the clear evidence of the risk of significant harm done by COVID-19 infections.
There do not appear to be any non-planetary objects to meaningfully experiment SRM on. There are not hundreds of planets to have the second testing run on. There are not thousands of planets to have subsequent testing done on. There is this only one planet that, without humans messing it up by behaving like an asteroid, should be habitable for humanity for 10s of millions of years.
It is absurd to suggest that it is acceptable to run a global experiment on the planet. It is especially absurd to suggest the ‘need for, and benefit of, an SRM global experiment’ because leaders will not do what needs to be done (disappoint a portion of the global population that believes it is superior). Global Leadership needs to rapidly end the continued forcing of CO2 and other ghgs into the atmosphere )(which is an unacceptable global experiment that is not ‘mitigated’ by additional global scale experimentation).
3. The conclusions by the author regarding reasons for concern about how scientific presentations on SRM may be interpreted fails to mention the potential for political leaders (policy-makers) to be tempted to consider the potential for SRM to be a ‘solution’. The author appears to be unaware that some policy-makers have already exhibited a willingness to seek excuses for increasing harm to be done to future generations by the global leadership of the current generation failing to effectively reduce the harm being done. Some political game players may even selfishly consider it acceptable to delay the reduction of harm done, do more harm, because ‘future generations should be able to develop and use SRM’.
That said, climate science is complex. And the diversity of action plans in response to the undeniable harm being done deserve consideration - never losing focus on the need to limit the harm done, and never forgetting how unexpectedly harmful human actions can be.
-
David-acct at 07:53 AM on 15 July 2022Supreme Court sharply limits EPA power plant authority
Bob you comment indicates that you dont like the structure of the US Constitution and the separate powers to each of the three branchs of the US Government. As previously discussed, Congress is the branch that enact laws, the actions of the executive branch are limited to the laws passed by congress. Under the US Constitution, the executive branch can not enforce regulations or create "new law " not enacted by Congress. Whether that is good or bad is a separate and unrelated issue.