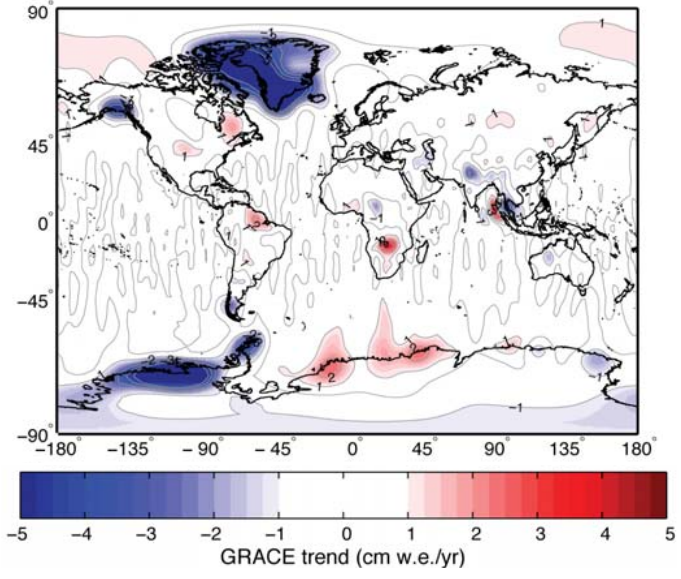
The GRACE program is a triumph of our technology – a pair of satellites nicknamed ‘Tom’ and ‘Jerry’ that act like a pair of scales for the Earth below them. They have weighed Australia getting heavier as floodwaters rose, the Earth getting fatter thanks to ice cap melt, and the drying up of Texan water supplies.
Now scientists have produced the first global map of change in the mass of land ice on Earth for 2003-2010 (Jacob et al, 2012), see it in all its glory in Figure 1. Unfortunately the resolution of the GRACE satellites means they can't reliably measure ice areas smaller than 100 km2 (almost 40 square miles), so these are not included in the study.

Figure 1 - map of changes in ice thickness estimated by Jacob et al. Blue means losing ice and red means gaining ice. Changes in geology and groundwater have been accounted for (supplementary information). The red spot in Africa is an artifact. The units are 'centimetres of water equivalent per year': the change in water thickness that would be needed to cause the measured mass change.
The first things that jump out at you are probably the big blue areas around Greenland and Antarctica. The new results are similar to those already covered at skepticalscience, such as Garder et al, 2011's work on Baffin & Ellesmere islands, plus other measurements of Greenland and Antarctica. It's no longer news that the 2007 UN Intergovernmental Panel on Climate Change (IPCC) computer simulations were far below what has happened.
Greenland and Antarctica have lost almost 400 billion tons of ice every year according to these measurements, twice the loss expected from all the world's other glaciers. This helps to explain why sea levels are rising at the high end of IPCC expectations.
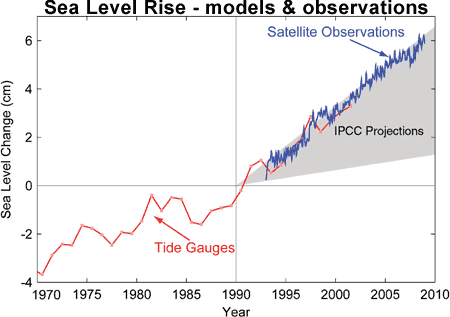
Figure 2 - tide gauges (red), satellite measurements of sea level (blue) and IPCC computer model expectations (grey area) from Allison et al, 2009.
For the first time entire mountain ranges of glaciers have been weighed. There are at least 160,000 glaciers worldwide and in the World Glacier Monitoring Service's last update only 136 were weighed. Thousands have been pictured by satellites (e.g. Le Bris et al, 2011, Paul & Svoboda, 2011, Narozhney & Zemtsov, 2011) and found to be mostly shrinking in area, but photos can't measure thickness and therefore total weight.
GRACE shows about 150 billion tons a year of glacier melt which is actually less than some expected. It seems that glaciers in the high mountains of Central Asia (around the Himalayas) only lost about 4±20 bn tons of ice a year. Previous work expected closer to 50 billion tons of loss.
500 billion tons of ice a year of land ice is being lost, whilst one region is doing about 50 bn tons/yr better than expected. Naturally, the anti-climate science editorial policies of Fox News, the UK Telegraph and Daily Mail ensured headlines focused on the Himalayas result, while some others like Reuters took a more complete view.
At Skeptical Science we think it is important to look at all of the data, which is why this post started with the big view. However, the Asian result is interesting and new so it's definitely worth exploring.
In 2010, Matsuo & Heki used GRACE to calculate a loss of almost 50 billion tons a year in the same region until 2009, compared with 4 billion in the new study (with a large range of possible values).
The new work includes some extra areas which Matsuo and Heki didn't, so if you do an apples-to-apples comparison then the difference is 47 versus 11 billion tons a year.
It appears that North India has been using more groundwater than expected and this has now been better measured, explaining about 25 bn tons of the difference. The rest might be because of extra heavy snowfalls in 2010, data which wasn't available to Matsuo & Heki.
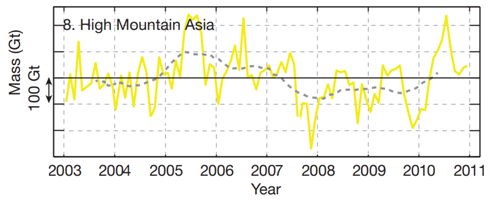 Figure 3 - Change in mass of glaciers in High Mountain Asia as measured by GRACE. 1 Gt = Gigaton, or billion tons. Matsuo & Heki calculated 50 billion tons/year of ice loss, but they didn't have the 2010 data which saw 400 billion tons of accumulation in one season: more than the total loss they expected over 8 years! This shows that short term trends are not reliable indicators.
GRACE weighs everything and the scientists subtract the effect of changes in the Earth's crust or stored water, which introduces the possibility of error. The new study considers changes in melt lakes, plus underground water storage and erosion and conclude that they don't make a big difference. The effect of rising or sinking rock due to tectonic activity or changes in glaciers is included by the scientists using a computer model - if this is found to make mistakes then the results could change (possibly drastically) in future. This is why other measurements are needed to confirm these results, and why other methods are often considered more reliable than GRACE only measurements.
We can also see that 8 years isn't necessarily enough to make solid conclusions about the long term response of a single area, especially when weather can cause glaciers to grow or shrink by hundreds of billions of tons in a season.
The results aren't a complete surprise: scientists had already reported that the westerlies which feed the Karakoram have brought cooler, cloudier and snowier conditions to some regions (Archer & Caldeira, 2008) which may or may not be a long term effect but could partly explain how the very highest glaciers are storing water (Scherler et al, 2011).
We now have the first global map of glacier weight change. The ice sheets are doing much worse than 2007 predictions and glaciers in most of the world are doing just as badly as thought. However, glaciers in the high mountains of Central Asia appear to have been stable for 8 years when old measurements would have expected 400 billion tons of ice loss. Meanwhile, over 4.2 trillion tons of ice have melted worldwide over 8 years.
2003-2010 is a short time though, so it's too soon to say anything about what will happen next here.
Seas are rising faster than computer simulations had expected, and these simulations are also lower and slower than has happened in the past (Vermeer & Rahmstorf, 2009). It's possible that the simulations didn't properly include the processes that shrink ice sheets so these results are consistent with faster future sea level rise. Figure 4 shows that the rate of melt in the big ice sheets is much larger than the swings caused by seasonal weather and the long term trend is obvious.
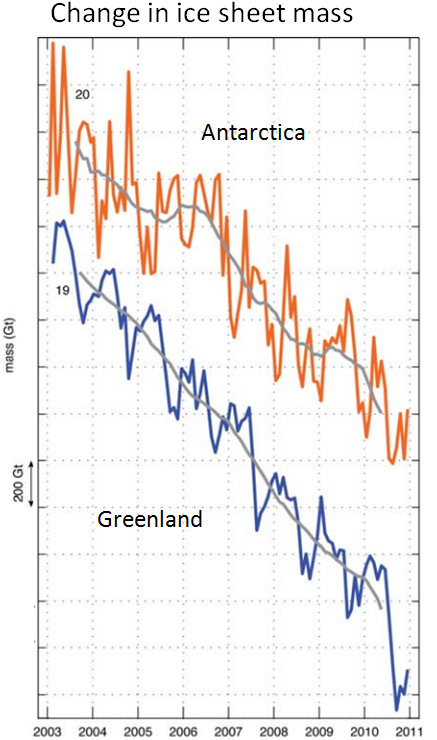
Figure 4 - Change in the ice mass of Greenland (blue) and Antarctica (orange). Notice how the trend is much larger than seasonal changes, and how each vertical dash is now 200 billion tons, versus 100 billion for the glacier graph in Figure 3.
Many of those gushing over this new scientific work have also claimed that global warming has stopped. In Figure 5 we've worked out how much energy was needed to melt the ice that's gone since 2003 and wondered what would happen if that heat had been put into the atmosphere instead. The calculation assumed a constant rate of ice loss and used the latent heat of fusion for water. The heat is enough to warm the atmosphere more than 0.3 C in 8 years - faster than atmospheric global warming since the 1970s.
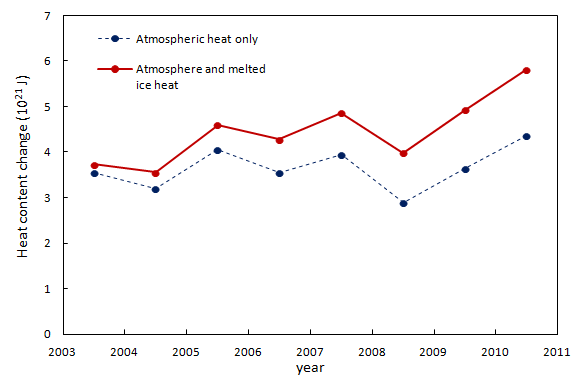 Figure 5 - The blue circles are the changes in heat content of the atmosphere (estimated from NASA GISTemp global data) over a period that some say global warming has 'stopped'. The red line adds the heat that has been used to melt ice over the same period.
When you look at the full picture, you see that the Earth is still building up heat and claims to the contrary rely on selectively ignoring data. The good news is that the highest mountains in Asia seem to be almost 50 billion tons a year better off than expected. But this is small change next to the 500 billion tons a year being lost elsewhere.
A calculation error was pointed out by the commenters Eric (skeptic) and Sphaerica. This was noted and corrected on 25/02/2012. Figure 5 was changed and the penultimate paragraph also corrected.
Posted by MarkR on Saturday, 25 February, 2012
 |
The Skeptical Science website by Skeptical Science is licensed under a Creative Commons Attribution 3.0 Unported License. |