Climate Science Glossary

Term Lookup

Enter a term in the search box to find its definition.

Settings

Use the controls in the far right panel to increase or decrease the number of terms automatically displayed (or to completely turn that feature off).

Term Lookup

Settings


All IPCC definitions taken from Climate Change 2007: The Physical Science Basis. Working Group I Contribution to the Fourth Assessment Report of the Intergovernmental Panel on Climate Change, Annex I, Glossary, pp. 941-954. Cambridge University Press.

Home Arguments Software Resources Comments The Consensus Project Translations About Support

Twitter Facebook YouTube Mastodon MeWe

RSS Posts RSS Comments Email Subscribe


Climate's changed before
It's the sun
It's not bad
There is no consensus
It's cooling
Models are unreliable
Temp record is unreliable
Animals and plants can adapt
It hasn't warmed since 1998
Antarctica is gaining ice
View All Arguments...


Username
Password
New? Register here
Forgot your password?

Latest Posts

Archives

Trouble Brewing in the North

Posted on 4 July 2011 by MarkR

HBO’s new mega-series A Game of Thrones (‘The Sopranos in Middle Earth’ according to the marketing people) shows a stupendous wall of ice:
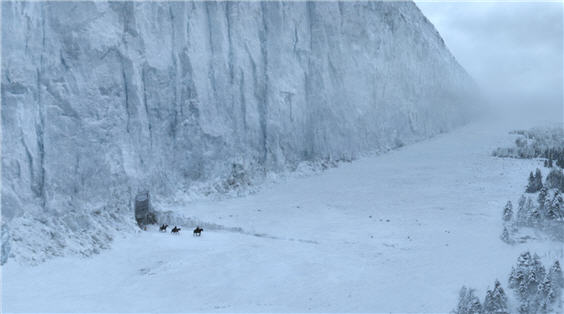
The Wall

Figure 1 - The Wall, copyright HBO


In the story, people piled up 5 billion tons of ice over 300 miles to keep their lands safe from the dangers to the North. Our own northern ice also keeps our lands safe, but just how sturdy is it?

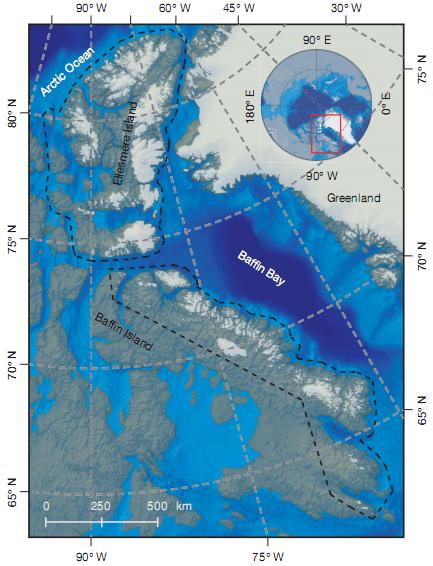
The trillions of tons of ice loss in Greenland since 2000 has been well discussed, but its baby brothers in the Canadian Arctic Archipelago (CAA) are still quite hefty and we haven’t heard much about them specifically. A recent Nature article by Gardner et al is a great summary.
CAA Map

Figure 2 - Ellesmere Island and Baffin Island, the areas measured by Gardner et al 2011

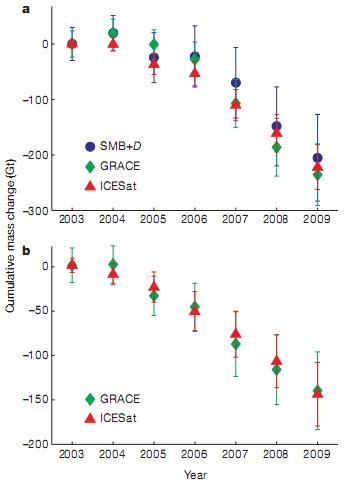
The scientists wanted to determine how much ice the islands were gaining or losing and used several independent methods. For Ellesmere Island other scientists have taken measurements of snowfall and glacier loss, allowing a ‘surface mass balance plus discharge’ (SMB+D) model to make an estimate, although lack of ground data for Baffin meant they couldn’t use this in the south.

Satellites measured both islands; ICEsat used a laser radar (LIDAR) to measure ice thickness, whilst GRACE is a pair of satellites nicknamed 'Tom' and 'Jerry' that chase each other across the sky. Tom and Jerry measure tiny changes in the speed of each other caused by the tug of gravity from Earth and directly weigh parts of the Earth below them.

The measurements agree; these Canadian ice caps have lost about 400 billion tons of ice since 2003, an average of 12 of the stupendously big 300 mile long ice walls in Figure 1 melting away every year.
 

 CAA Balance

Figure 3 - Total mass change from 2003 of the ice caps of the Canadian Arctic Archipelago for Ellesmere Island (top) and Baffin Island (bottom). Green diamonds are gravity field measurements from GRACE, red triangles are from ICESat LIDAR height measurements and blue circles from near surface measurements combined with a computer model, the Surface Mass Balance plus Discharge method.

The CAA experienced 4 of its 5 warmest summers since 1960 during the study, and the team used the model to calculate that greater loss was from melting rather than changes in snowfall. They found that each degree Celsius meant another 64±14 billion tons of ice melted during the year, and whilst the ice caps added 0.17±0.02 mm/year to sea level rise, the last 3 years averaged 50% higher than that. 

A complete melt of all ice outside Greenland & Antarctica would only lead to a 0.5 metre rise in sea level (IPCC, 2001), but this would still be a concern to anyone living in New Orleans, Rotterdam or Maputo.

A slight decline in Alaskan melt rate means that outside Greenland and Antarctica, these two islands are now the biggest regions of land ice melt on the planet.

It's possible that local weather systems will slow down the melt rate in the short-term, but eventually the long-term global warming is expected to dominate northern temperatures, and it seems that we can add these Canadian ice caps to the list of Alaskan glaciers, the Greenland ice sheet and Arctic sea ice where trouble is already brewing in the North.

0 0

Printable Version  |  Link to this page

Comments

Comments 1 to 10:

  1. The Penny Ice Cap is one of the key ice caps on Baffin Island and its outlet glaciers are certainly in retreat in response to the mass loss, which generates thinning.
    0 0
  2. New article this week: http://www.sciencedirect.com/science/article/pii/S092181811100097X "There has been a rapid acceleration in ice-cap melt rates over the last few decades across the entire Canadian Arctic. Present melt rates exceed the past rates for many millennia. New shallow cores at old sites bring their melt series up-to-date. The melt-percentage series from the Devon Island and Agassiz (Ellesmere Island) ice caps are well correlated with the Devon net mass balance and show a large increase in melt since the middle 1990s. Arctic ice core melt series (latitude range of 67 to 81 N) show the last quarter century has seen the highest melt in two millennia and The Holocene-long Agassiz melt record shows the last 25 years has the highest melt in 4200 years. The Agassiz melt rates since the middle 1990s resemble those of the early Holocene thermal maximum over 9000 years ago."
    0 0
  3. A wall of ice of that weight would be 300 feet tall and 300 feet wide. This is less than the 1/3 volume of the iceberg that came off of Petermann Glacier last year, they could have just chopped this up. It is one seventh the volume lost from Jakobshavn each year.
    0 0
  4. At the moment, this post says "Posted on 14 July 2011 by MarkR". Does this mean we have the time machine Tom Toles suggested as the fix for global warming? :-)
    0 0
  5. "At the moment, this post says "Posted on 14 July 2011 ..." Ice fortress ... Bastille Day ... it all sorta fits, no?
    0 0
    Response:

    [DB] Fixed pub date (and they said I'd never make it as a Timelord...).

  6. DB: Can we just start calling you Dr. Who?
    0 0
  7. Maybe we could call you The Incorruptible Moderator If only the collapse of a ice shelf could have the public impact of this:
    0 0
  8. When will the Vikings be able to plant vineyards on Baffin and Ellesmere islands?
    0 0
  9. Why, don't they have any good wine where you live? :-P
    0 0
  10. Speaking of Neven, a participant at his blog, Seke Rob, has just posted this bit:
    "The above chart shows when Sea Ice Extent fell first time below 10, 9, 8 and 7 million, and pulls this all together and adds also first date when the 11 million square km was passed. Far right a column shows the minimum reached, standing out, still, 2007, to think that the ice thickness then were considerable greater than in 2011, most amazing to get from 10 to 9 million extent in 8 days. Then, 2011 needed 8 days to get from 9M to 8M."\"
    Looks like time's runnin' out...
    0 0

You need to be logged in to post a comment. Login via the left margin or if you're new, register here.


The Consensus Project Website

THE ESCALATOR

(free to republish)


© Copyright 2024 John Cook
Home | Translations | About Us | Privacy | Contact Us