On 22 February 2012, Richard Lindzen gave a talk to invited guests in a rented room in the Palace of Westminster. Note that contrary to some reports about the seminar, it was not presented to UK Parliament. Any member of the UK legislature can rent one of the many Palace of Westminster rooms for private purposes; that is what happened in this instance.
Lindzen's presentation, the slides of which can be viewed here and video can be seen here, appeared very similar to presentations given by Christopher Monckton. In fact, Lindzen's talk contained many of the same climate myths we recently debunked from Monckton, which frankly does not reflect well on Lindzen. The slides and presentation are almost identical to Lindzen's testimony to the US House Subcommittee on Science and Technology hearing in November 2010, which in turn was almost identical to a presentation he gave at a Heartland Institute conference 6 months earlier. In fact, Lindzen did not even update some of his graphs with data beyond mid-2010 for his UK presentation.
Lindzen's presentation contained so many misrepresentations that it would be too time consuming to address them all; however, we will address most of them here, including the base on which Lindzen built his house of misinformation cards.
What Lindzen Got Right
First we should give Lindzen credit for what he got right in his presentation. For example, he acknowledged that there is a greenhouse effect, CO2 has been increasing, and global temperatures have increased, and notes that these are not controversial facts. To his credit, in discussing the tropical troposphere 'hot spot,' Lindzen also acknowledged that models are correct to predict that the 'hot spot' should be present, since this is based on fundamental atmospheric physics. He also acknowledges that the failure to observe the hot spot may be due to satellite and weather balloon measurements being wrong (or surface temperature measurements). This is something that his fellow "skeptics" have been unwilling or unable to admit.
However, while Lindzen got a few things right in his presentation, he got a whole lot more wrong.
"If one assumes all warming over the past century is due to anthropogenic greenhouse forcing, then the derived sensitivity of the climate to a doubling of CO2 is less than 1C. The higher sensitivity of existing models is made consistent with observed warming by invoking unknown additional negative forcings from aerosols and solar variability as arbitrary adjustments."
To support this claim, on the following slide, Lindzen claims:
"There has been a doubling of equivalent CO2 over the past 150 years."
This assertion is simply false. A doubling of CO2 corresponds to a 3.7 Watts per square meter (W/m2) radiative forcing. According to the NOAA Annual Greenhouse Gas Index, the greenhouse gas (GHG) radiative forcing (compared to 1750) in 2010 was 2.81 W/m2 - only 76% of the way to doubled CO2-equivalent.
Lindzen's argument in a nutshell is that the GHG forcing has roughly doubled, and surface temperatures have roughly increased 1°C in response; therefore, the climate sensitivity is about 1°C for doubled CO2. We recently demonstrated the errors in this argument when it was made by Monckton.
First, climate sensitivity is an equilibrium value (unless referring to the transient climate response [TCR]), and the planet is currently not in an equilibrium state.
Second, estimating TCR (which is what Lindzen is really attempting) requires a linearly-increasing net radiative forcing, which simply was not the case over the past 150 years.
Third, as convenient as it would be for Lindzen's argument if aerosols exerted no effect on global temperatures, that is simply not reality.
Regarding aerosols, Lindzen has previously referenced the work of Ramanathan, who estimates the net radiative forcing from aerosols and black carbon at -1.4 W/m2 (Ramanathan and Carmichael 2008). Lindzen is correct that the aerosol forcing is not well known and has large error bars, but those error bars do not even overlap with zero (for example, the IPCC puts the aerosol forcing at -0.4 to -2.7 W/m2). Just because we can't pinpoint the value, that doesn't mean we can simply assume it is zero, as Lindzen does.
To estimate the TCR properly and determine if the Earth has warmed as much as expected, we can examine the changes over the past 60 years, during which time the net radiative forcing has increased roughly linearly. According to Skeie et al. (2011), the best estimate anthropogenic forcing since 1950 is about 1.2 W/m2 (and the natural forcings over this period have been close to zero). The average surface temperature change over that period has been approximately 0.7°C. Therefore, TCR = dT/dF = 0.7/1.2 = 0.58°C per W/m2 (where dF and dT are the changes in radiative forcing and global surface temperature, respectively).
Thus for the 3.7 W/m2 radiative forcing associated with a doubling of atmospheric CO2, the best estimate transient warming is approximately 2°C, based on the observational data over the past 60 years. In short, the transient response has been more than double Lindzen's claimed equilibrium response, and the actual equilibrium response is approximately 1.8 times their TCR, according to climate models. Lindzen's claim about climate sensitivity, which is the basis of his entire presentation, is not even close to accurate.
As we've mentioned, there are large uncertainties associated with the size of the aerosol forcing in particular. But not knowing its magnitude does not excuse completely neglecting it, as Lindzen does.
Positive Feedbacks
Later in his presentation, Lindzen follows up his incorrect low climate sensitivity argument, claiming that data indicate that climate feedbacks are negative (which would indeed suggest low sensitivity):
"Only with positive feedbacks from water vapor and clouds does one get the large warmings that are associated with alarm. What the satellite data seems to show is that these positive feedbacks are model artifacts."
This claim is incorrect. That water vapor is a positive feedback has been well-established. For example, Dessler et al. (2008):
"Height-resolved measurements of specific humidity (q) and relative humidity (RH) are obtained from NASA's satellite-borne Atmospheric Infrared Sounder (AIRS)...The water-vapor feedback implied by these observations is strongly positive, with an average magnitude of ?q = 2.04 W/m2/K, similar to that simulated by climate models."
Lindzen proceeds to criticize a letter published in Science expressing dismay about political assaults on climate scientists, signed by 250 members of the National Academy of Science.
"This letter appeared in Spring of 2010 in Science. It was signed by 250 members of the National Academy of Science. Most signers had no background whatever in climate sciences."
Lindzen objects to the USA's most prominent scientific institution taking the stance that the basic science behind human-caused global warming is sound and that climate scientists should not be subjected to political attacks. He complains that this authoritative scientific body is taking an authoritative position.
And yet, Lindzen himself recently signed onto a letter sent to the Wall Street Journal by 16 climate "skeptics," only 2 of which (including Lindzen) have published peer-reviewed climate science research in the past three decades, and at least 7 of which have received fossil fuel industry funding. That letter said:
"...a large and growing number of distinguished scientists and engineers do not agree that drastic actions on global warming are needed."
Lindzen and company attempted to take a position of authority in this letter, to discourage climate mitigation policy. The difference was that 250 members of the most prestigious scientific body in the USA signed the former, whereas Lindzen's letter was signed by just 16 "skeptics" including an economist, a physician, a chemist, an aerospace engineer, and an astronaut/politician. Lindzen's hypocrisy here is troubling.
Conspiracy Theories
More troubling yet, Lindzen proceeds to engage in conspiracy theories in his presentation. The quote in blue below comes from presidents of the Royal Society and the National Academy of Science (Rees and Cicerone), and the quote in black is Lindzen's criticism of their statement.
"Our academies will provide the scientific backdrop for the political and business leaders who must create effective policies to steer the world toward a low-carbon economy.
Rees and Cicerone are saying that regardless of the evidence the answer is predetermined. If the government wants carbon control, that is the answer that the Academies will provide."
The presidents of these two prestigious scientific bodies are saying that their academies will provide a summary of the scientific evidence so that political and business leaders can be sufficiently well-informed to craft policies to reduce GHG emissions. Somehow Lindzen interprets this as the Royal Society and the National Academy of Science acting as political pawns, throwing scientific integrity in the trash bin to give their governments "carbon control."
There is no other way to view this - Lindzen is advocating a ridiculous conspiracy theory, which is even more troubling than his hypocrisy.
"Looking at the above [HadCRUT3], one can see no warming since 1997."
As we know, HadCRUT3 is biased low and will soon be replaced with HadCRUT4. The main reason for its cool bias is a lack of coverage in a number of rapidly-warming areas, particularly in the Arctic. One of the HadCRUT4 adjustments will be to include more temperature data from stations in the Arctic region.
Other data sets already use area weighting to represent these regions of rapid warming. GISTEMP shows a 0.14°C warming since 1997, and NOAA shows 0.073°C. This despite the fact that virtually every non-greenhouse gas influence on temperature has been in the cooling direction over that period. Human aerosol emissions increased, blocking more sunlight. Heat accumulated in the deep oceans. The solar cycle went into an extended minimum. There were a number of strong La Niña events. Foster and Rahmstorf (2011) showed that when we filter out the latter two effects and that of volcanic activity, the warming of surface temperatures has not even slowed (Figure 1).
Figure 1: Average temperature changes recorded by 5 teams of scientists: 2 working on satellites (University of Alabama, Huntsville and Remote Sensing Systems) and 3 working with thermometers and ship/buoy measurements (UK Hadley Centre & Climate Research Unit, NASA Goddard Institute for Space Studies and the US National Climatic Data Centre. Foster and Rahmstorf (2011) statistical methods have been used to 'take out' the effects of volcanic eruptions, Pacific Ocean cycles and the Sun.
Misleading with Graphs and Misrepresenting the Arctic
Next in his presentation, Lindzen puts on a clinic about how to mislead an audience with graphs. Many of his graphs were simply zoomed out with very large axes to make any trends in the data difficult to discern. For example, he presents this slide to argue that the Arctic sea ice "death spiral" is nothing to worry about (Figure 2).
Figure 2: Lindzen's slide #38.
Of course when the data are zoomed out to the fullest extent with the seasonal variations included, the long-term trend (Figure 3) is difficult to discern.
As Figure 3 shows, September Arctic sea ice extent (the summer minimum) has declined approximately 35% over the past 33 years. And the Arctic sea ice volume data (since ice is three-dimentional) paints an even bleaker picture. NASA has also put together a great interactive tool to illustrate the Arctic sea ice death spiral (Figure 4; drag the white bar to the right to see 1980 Arctic sea ice area, and to the left to see 2012 area).
Figure 4: This interactive illustrates how perennial sea ice has declined from 1980 to 2012. The bright white central mass shows the perennial sea ice while the larger light blue area shows the full extent of the winter sea ice including the average annual sea ice during the months of November, December and January. The data shown here were compiled by NASA senior research scientist Josefino Comiso from NASA's Nimbus-7 satellite and the U.S. Department of Defense's Defense Meteorological Satellite Program. Credit: NASA/Goddard Scientific Visualization Studio.
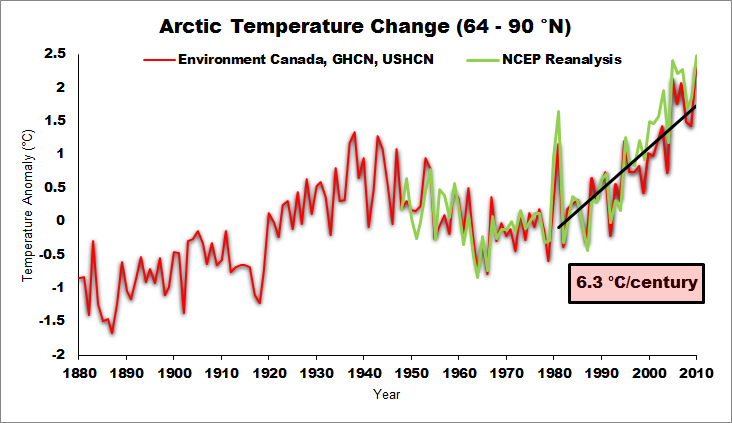
Lindzen gets a whole lot wrong when discussing the Arctic in his presentation. He also suggests the Arctic was as warm or warmer in 1940, which is simply not the case (Figure 5).
Figure 5: Temperature Anomalies (1951-1981 Baseline) for the Arctic region (64-90°N) over the past 130 years according to ccc-gistemp analysis and NCEP reanalysis.
Lindzen claims that climate scientists place too much emphasis on annual temperatures and fail to discuss seasonal changes. On the contrary, many studies have examined this issue and found that there is a complex seasonality in the Arctic in how heat is exchanged between the atmosphere and ocean throughout the year (i.e. see Serreze et al. 2009). Lindzen also claims:
"summer ice depends mostly on how much is blown out of the arctic basin"
While meteorological conditions are important in explaining yearly variations in the amount of summer Arctic sea ice, they cannot explain the long-term trend illustrated in Figure 3. That is due to a long-term (primarily GHG-caused) warming. But Lindzen's final comment about the Arctic is one of his worst misrepresentations:
"In fact, the arctic is notoriously variable...So much for ‘unprecedented.’"
This suggestion that Arctic changes are not unprecedented displays a serious lack of familiarity with the relevant scientific literature. For example, Polyak et al (2010):
"The current reduction in Arctic ice cover started in the late 19th century, consistent with the rapidly warming climate, and became very pronounced over the last three decades. This ice loss appears to be unmatched over at least the last few thousand years and unexplainable by any of the known natural variabilities."
"Here we use a network of high-resolution terrestrial proxies from the circum-Arctic region to reconstruct past extents of summer sea ice, and show that—although extensive uncertainties remain, especially before the sixteenth century—both the duration and magnitude of the current decline in sea ice seem to be unprecedented for the past 1,450 years"
"These results reinforce the assertion that sea ice is an active component of Arctic climate variability and that the recent decrease in summer Arctic sea ice is consistent with anthropogenically forced warming."
"Arctic ice core melt series (latitude range of 67 to 81 N) show the last quarter century has had the highest melt in two millennia and The Holocene-long Agassiz melt record shows that the last 25 years has the highest melt in 4200 years."
"The demise of the Arctic ponds is a sign of climate change, a long-term shift in the Arctic climate measured by changes in temperature, precipitation and other indicators. Climate change has moved faster here than at lower latitudes. The change we have seen in the Arctic is the bellwether for global climate changes that are already under way."
A Sad Display
Overall, Lindzen's presentation was extremely disappointing. Most of his scientific arguments hinged on his "Earth hasn't warmed as much as expected" myth, which is based on completely disregarding the cooling effects of aerosols and the fact that the climate is not in equilibrium.
On top of this clearly flawed argument, Lindzen threw in a number of conspiracy theories and wild accusations. He claimed the Royal Society and the National Academy of Science are no more than political tools without any scientific integrity, and that "the evidence from climategate and other instances of overt cheating" make the anthropogenic warming theory implausible.
The presentation seems to have been aimed at pleasing Christopher Monckton rather than informing the rest of the audience about scientific realities.
Note:Martin Lack, who attended this presentation, has published a subsequent letter he sent to Lindzen. This letter covers some of the points in Lindzen's presentation which we did not cover here, including a critical misleading slide which was not included in the PDF of the presentation which was the basis of this post. Martin's post is well worth reading as well.
 On 22 February 2012, Richard Lindzen gave a talk to invited guests in a rented room in the Palace of Westminster. Note that contrary to some reports about the seminar, it was not presented to UK Parliament. Any member of the UK legislature can rent one of the many Palace of Westminster rooms for private purposes; that is what happened in this instance.
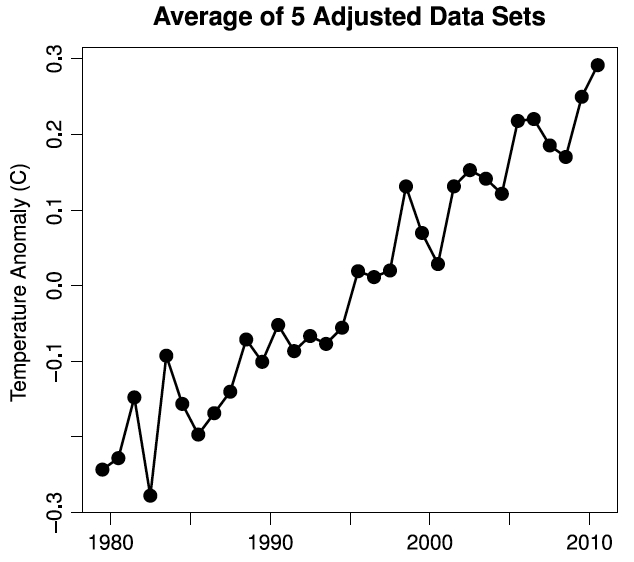 Figure 1: Average temperature changes recorded by 5 teams of scientists: 2 working on satellites (University of Alabama, Huntsville and Remote Sensing Systems) and 3 working with thermometers and ship/buoy measurements (UK Hadley Centre & Climate Research Unit, NASA Goddard Institute for Space Studies and the US National Climatic Data Centre.
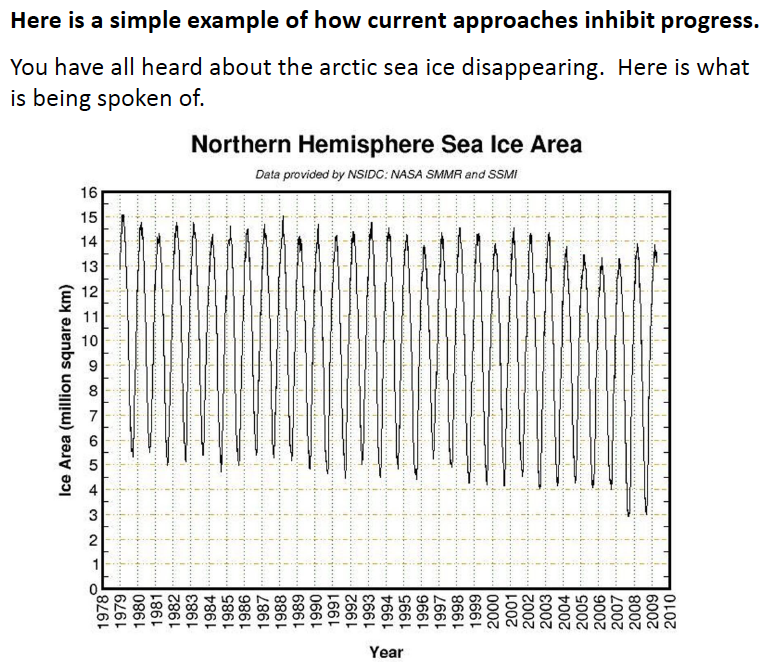
