Climate Science Glossary

Term Lookup

Enter a term in the search box to find its definition.

Settings

Use the controls in the far right panel to increase or decrease the number of terms automatically displayed (or to completely turn that feature off).

Term Lookup

Settings


All IPCC definitions taken from Climate Change 2007: The Physical Science Basis. Working Group I Contribution to the Fourth Assessment Report of the Intergovernmental Panel on Climate Change, Annex I, Glossary, pp. 941-954. Cambridge University Press.

Home Arguments Software Resources Comments The Consensus Project Translations About Support

Twitter Facebook YouTube Mastodon MeWe

RSS Posts RSS Comments Email Subscribe


Climate's changed before
It's the sun
It's not bad
There is no consensus
It's cooling
Models are unreliable
Temp record is unreliable
Animals and plants can adapt
It hasn't warmed since 1998
Antarctica is gaining ice
View All Arguments...


Username
Password
New? Register here
Forgot your password?

Latest Posts

Archives

Why Wasn't The Hottest Decade Hotter?

Posted on 15 July 2011 by Rob Painting

After a rapid rise in global surface air temperatures during the late 1970s to 1990s, the rate of global warming in the last decade or so has slowed. A recent scientific paper, Kaufmann (2011), suggests that once relevant factors are taken into consideration, the observed slow-down from 1998-2008 is in line with scientific understanding of the climate. 

Rapid industrialization in East Asia, particularly China, led to a big jump in sunlight-reflecting sulfate aerosol pollution, mainly through coal burning. This additional reflective aerosol pollution sheilded the Earth from greater warming, but is only a temporary reprieve. Sulfates have a short lifetime in the atmsophere, and when East Asia stops burning so much coal, the Earth is going to get an extra nudge in warming. 

20th to 21st Century global warming

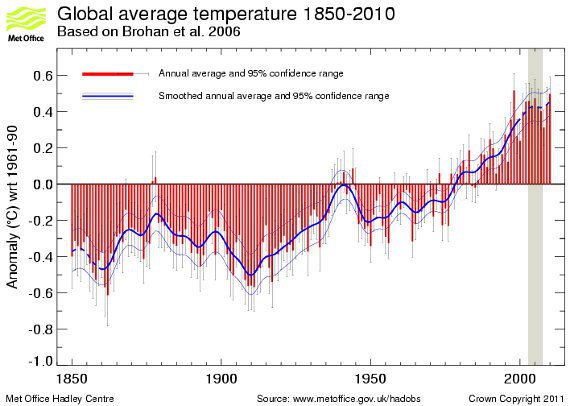
Figure 1 - Hadley Centre temperature record (HADCRUT3).The red bars show the global annual average near-surface temperature anomalies from 1850 to 2009. The error bars show the 95% uncertainty range on the annual averages. The thick blue line shows the annual values smoothed. Vertical banded column indicates the 'slow-down' period.

The Hadley Centre dataset shows less global warming, compared to other records, primarily because it excludes measuring the Polar regions where warming is happening much faster than the global average. However the Hadley data still shows the decade 2000-2009 as the warmest on record. Looking at the above graph, it's clear that, despite the long-term warming trend, there are a number of short-term periods where global temperature shows little or no warming. So another slow-down in warming is hardly a novel observation.  

Why the Pause?

To identify what may have led to this slow-down, Kaufmann (2011) use a statistical model to compare natural and human-caused forcings. They find that the increase in greenhouse gases was exceeded by an even greater increase in sunlight-reflecting sulfate aerosols, which originate from the rapid industrialization of China.  Chinese coal-burning in particular doubled in the 4 years from 2003-2007, and makes up some 77% of the 26% global increase over that time.

The result of the modeling is that the cooling effect of sulfates nearly cancels out the warming effect of greenhouse gases, allowing natural processes to control the climate. In this interval, the small drop in sunlight reaching the Earth as part of the natural solar cycle, coupled with more episodes of La Niña (natural globally cool episodes) leads to a much smaller push in the direction of warming.  

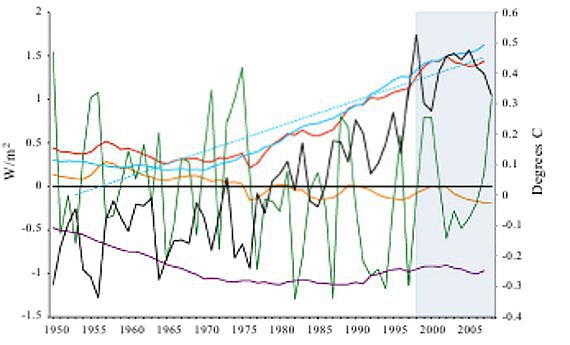
Figure 2 - Radiative forcing of human-caused sulfur emissions (purple line), net human-caused forcing (blue line), linear estimate of net human-caused forcing (blue dash), total radiative forcing (red line), radiative forcing of solar insolation (orange line), and observed temperature (black). The Southern Oscillation Index (divided by 10) is given in green. SOI data are presented as annual mean sea level pressure anomalies at Tahiti and Darwin. Post-1998 period of interest (highlighted gray).  From Kaufmann (2011).

Kaufmann (2011) looks at other factors, such as Black Carbon (soot), and possible cooling caused by a reduction in water vapor in the stratosphere, however these are found to have a negligible effect on global temperature. 

Another look at sulfate emissions

Smith (2011) look at human sulfate emissions from 1850-2005, based on estimates of production and consumption. They find a drop in the last part of the 20th century, but from 2000 to 2005 there is a big increase, largely from East Asia (China) and international shipping. So, this study is pretty much in agreement with the emissions data from Kaufman (2011).

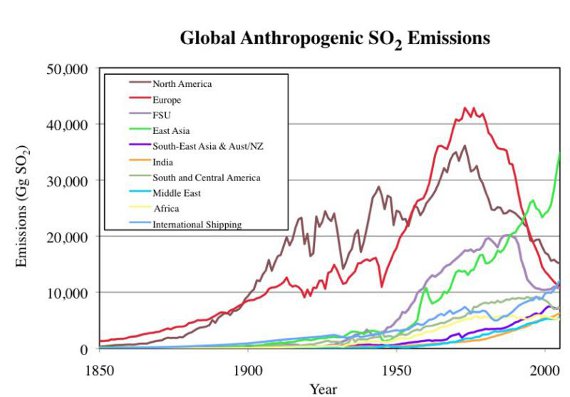
Figure 3 - Global sulfur dioxide emissions by region (North America = USA+Canada; East Asia = Japan, China, and South Korea). From Smith (2011).

How do East Asian emissions become global?

Being based on a statistical model, rather than a climate model, Kaufmann 2011 can't tell us how a dramatic increase in East Asian sulfate pollution can have such a global effect; however, there has been earlier work addressing this question.

Rasch (2000) use the NCAR climate model to quantify the effect of reflective sulfate aerosols based on their location, or source. Those emissions which come from the Asian region are quite different from those that stem from pollution in North America and Western Europe. Unlike those regions, emissions from Asia are able to reach the upper atmosphere and spread out over both hemispheres, and thereby have a greater global impact. 

Manktelow (2009) looked not only at the sulfate aerosols themselves, but also the impact they have on cloud formation. Their model reveals that both North America and East Asia have an impact 3 to 4 times greater than Europe because local weather patterns are able to loft sulfates up into the upper atmosphere, affecting cloud-forming processes. Once again demonstrating that not all sulfate emissions are created equal; Asia in particular packs a greater wallop. 

First the good news.......then the bad

If the findings of Kaufmann (2011) are confirmed by other research, and it is accepted that East Asian sulfate pollution shielded the Earth from greater warming during 1998-2008, this is both good and bad news.  It's good that the planet did not suffer greater warming, but bad because this effect is only temporary.

Sulfate aerosols have a short lifetime in the atmosphere, often measured in weeks and months, but up to 3 years if they reach the upper atmosphere. In contrast, greenhouse gases, especially CO2, will  linger for centuries everywhere in the atmosphere. As East Asia begins to install smokestack scrubbers to reduce sulphate pollution, and they need to for reasons such as health and acid rain , then the cooling effect of those reflective aerosols will be lost. Once that happens we should observe a noticeable increase in global warming.  

0 0

Printable Version  |  Link to this page

Comments

1  2  Next

Comments 1 to 50 out of 87:

  1. Nice post, Rob. jg made a great cartoon on this subject:
    0 0
  2. How is the pauze consistent with e.g. Hansen's GISS that finds that the 2000s warmed as rapidly as the decades before that? Hansen: [..], we conclude that there has been no reduction in the global warming trend of 0.15°C–0.20°C per decade that began in the late 1970s. Or with Jones' BBC ordeal with 1995-2011 now showing warming at the 0.05 confidence level, which imho means you can't really tell (in HadCRUT) how real any linear trend is over the last decade. Is this Kaufmann paper trying to answer a question that wasn't there to begin with (regarding a pauze in warming, I'm not disputing the increase in aerosols)?
    0 0
  3. I think the question was always there. The lack of warming has been apparent for quite some time, but many people have tried to claim that is wasn't. Kaufman offers a plausible explanation, which seems to be echoed by Hansen. We will have to wait for other research to confirm this/
    0 0
  4. cynicus you need to distinguish between long term trend (Hansen) and short term variability (Kaufmann). And also understand that Jones didn't say there has been no warming.
    0 0
  5. I don't really understand the Kaufmann issue. Different temperature series give quite different trends from 1998 to 2008 - If you go by GISTEMP then there was no decrease in the warming rate at all, and if you go by UAH the decrease was minimal. If you adjust all series for variations in solar irradiance, volcanic aerosols and ENSO, as Tamino has done here, then it's not apparent to me that any of them show any decrease in warming in this period that needs to be explained with industrial aerosols: So is there good evidence that there really was an increase in negative forcing from industrial aerosols in this period? If so, that suggests to me that the anthropogenic greenhouse warming trend which underlies the natural variability must be even greater than Tamino's analysis indicates (if it's offset by a negative forcing that his analysis doesn't take into account). Or, is the Kaufmann aerosol paper trying to explain a slowdown in warming that doesn't even exist? Isn't 10 years too short a period to really be confident about a trend anyway, regardless of what series you use?
    0 0
  6. Icarus - as stated by Riccardo @ 4, Kaufmann looks at short-term variability. Long-term all the temperature datasets show warming, that's what the physics of the increased Greenhouse Effect dictate, but why does it vary on shorter timescales? What's going on there? The details aren't yet clear, but citing 'natural variability' explains nothing. "So is there good evidence that there really was an increase in negative forcing from industrial aerosols in this period?" See figures 2 & 3.
    0 0
  7. Icarus, I got exactly the same reaction as you and I even send the Tamino work to Kaufmann, who I have met in a meeting a few months ago. I still waiting for the answer.
    0 0
  8. Dana @ 1 - love the cartoon!
    0 0
  9. Thanks Rob - I should have read the article better!
    0 0
  10. The confusion, though, is understandable. The mainstream has consistently said that a decade is too short to establish a meaningful (statistically significant) trend, so when the article heads up with;
    the rate of global warming in the last decade or so has slowed
    it looks like we've finally admitted what the skeptics have been saying, and have leapt upon the first reason to explain it that we can. We've dropped one argument in favour of another that contradicts the first. Yes, Kaufmann is talking about short-term variability: my issue is with the first sentence in the above article. Talking about a change in 'rate' implies trend analysis, and ten-year global temperature trends are statistically insignificant. I think the article should be amended, so that skeptics who don't read the comments are not confused.
    0 0
  11. Even something simple like:
    ...the rate of global warming in the last decade or appears to have slowed...
    0 0
  12. Another explanation is natural: 80's and 90's was AGW + natural, 00's was AGW - natural. A few natural factors fit the mold, the best one is PDO which was positive in the 80's and 90's which culminated in the 1998 El Nino which has yet not been repeated.
    0 0
  13. That begs another a question I have in my mind from previous comments at this blog and others. I've read in various places that the PDO moves heat around, and doesn't by itself contribute to fluctuations in global temperature. This is different from ENSO, where it is explained that this ocean atmosphere system does have that influence. I've never understood why these systems should be distinct in this fashion. If PDO does provide multi-decadal influence on global temperature (as ENSO does on shorter time scales), then there's meat to the argument that the PDO is signal is apparent in the instrumental record, and that the high warming rate of the last 30 years may partly stem from that. This doesn't affect the centennial trend much, but it would have an impact on the last 30 years or so, which trend has been argued to be a result almost entirely of CO2, natural factors (solar, cosmic rays) showing little trend. Dunno if this is the right thread for discussing that...
    0 0
  14. The proper thread would be Its the PDO. PDO is basically an index whereas ENSO is a physical system. There is some evidence that PDO may be long-lived integrator of the ENSO cycle. See the linked article.
    0 0
  15. barry, thanks for the correction http://cses.washington.edu/cig/pnwc/compensopdo.shtml I don't want to discuss that further here, it was only supposed to be an example.
    0 0
  16. From the OP:
    As East Asia begins to install smokestack scrubbers to reduce sulphate pollution...
    Does anyone have any idea what the time frame will be on this? My nightmare scenario would be ten or fifteen years of masked global warming, followed by a sudden, nightmarish takeoff that stuns the skeptics and the public and the politicians... but by then it's much, much too late.
    0 0
  17. I've posted in the PDO thread. I think we're missing something there.
    0 0
  18. Barry -"it looks like we've finally admitted what the skeptics have been saying, and have leapt upon the first reason to explain it that we can. We've dropped one argument in favour of another that contradicts the first." Barry, "skeptics" have been predicting global cooling for decades now, but the Earth keeps on warming - pretty much like we expect it to. Rather than constrain ourselves to "skeptic" narratives isn't it useful or at least interesting to examine why there is short-term variability?
    0 0
  19. It is interesting, but that was not my point. I don't think what we explore here should be constrained by the skeptic narrative, but the main thrust of this blog is rebutting skeptical views.
    Explaining climate change science & rebutting global warming misinformation
    (Headline on the home page here) All I'm suggesting is a small change to accommodate skeptical readers, and which in any case would be consistent with the science. The point of your post is that the globe has not warmed as we had expected, and we've come up with a new analysis to answer that. We've changed our narrative and we need to be careful in expressing it properly.
    0 0
  20. This study certainly offers a plausible scenario for the slowing of the rise in global temperatures. An important measurement will be the average temperatures of the decade from 2010-2019. There could be a real mixed bag here. Fro example: How much will the sulfate aerosol emission from China have slowed in the decade? What if we enter into a Dalton or Maunder type minimum with the sun? What if we have a series of La Nina years continuing through the decade? Given this potential "triple whammy" of cooling forces, if somehow 2010-2019 is even hotter as a decade than 2000-2009, this will certainly be quite telling, or even if temperature simply level for the period. If you listen to the AGW skeptics, they are preparing for a Little Ice Age to begin any day now and to last for decades. I think they'll be disappointed, but, considering what it means for continued warming, you almost wish they would be right.
    0 0
  21. Barry @19, I don't know about "our" narrative, but my narrative has been: 1) You don't measure trends just by measuring maxima; 2) You don't measure global temperatures by excluding the poles from the globe; 3) You don't determine long term trends by looking at less than a decades data; 4) Taking 1-3 into account, there has been ongoing global warming in the period 2001-1010 at a rate similar to the preceding two decades; 5) There may have been a slight reduction in the rate of warming in the last three years due primarily to an unusually for the 2000's cold year in 2008, although an unusually warm year for any other decade of the instrumental record; 6) That slight reduction in the rate of warming was probably due to increased aerosols from China, and to an exceptionally (second lowest in 100 years) low solar minimum. I see nothing in this paper to change that narrative. On the contrary, all I can see is a plausible explanation of some noise in the trend, which tends to confirm (6). Further, I notice that a significant defect of the paper is that it does not use a temperature index including polar values, and does not relate the explanation to the very unusual Arctic warmth.
    0 0
  22. Sorry, forgot to mention La Nina in my point (6) above.
    0 0
  23. @4 Riccardo, Thanks. I think I understand better now. I had the impression that this article (and Kaufmann) was about decadal trends but instead it is primarily about a few years (i.e. <10 years variability)? Rob Painting: This question keeps nagging in the back of my head and I would like to have this clear: "Why wasn't the hottest decade hotter?", you imply: without Eastern Asian aerosol emissions it would have been even warmer?
    0 0
  24. I was surprised by the publication of this article, but in a way it sort of makes sense - it appears warming was less than it would otherwise have been without China's aerosols. 800 million Hiroshima's worth of heat entered the upper oceans since 1998, trillions of tons of ice have melted and a few hundred million Hiros have gone into the deep ocean. So we were definitely not in radiative balance either. We still warmed, just not by as much. The thing with aerosols is that you have to keep increasing them to keep pace with CO2. Seems unlikely that China will, but perhaps other industrialising countries will help prop up our sunshade.
    0 0
  25. Robert Gates @ #20: "If you listen to the AGW skeptics, they are preparing for a Little Ice Age to begin any day now and to last for decades." What I've seen at WUWT and Steve Goddard's sites is that they, and their posters, are predicting everything and anything. I challenged Goddard to give his prediction for the state of the Arctic ice cap in 2020. His answer was that the Arctic ice cap would grow, shrink or stay the same. I taunted him on the predictive power of 'skeptic' science. Their Orwellian view amounts to "The earth is cooling, it's cooling! Isn't it good that it's (naturally) warming (we'll get to pet the dinosaurs)." Since they have set the 'goal posts' everywhere, they cannot go wrong. In any case, we have a thermal lag of 1F(?) within 30 years and a highly reduced Arctic ice cap. What's the calculated rise in temps for an ice free Arctic, 5-6F? That, in turn, creates a feedback loop for Siberian Methane production due to increased melt and methanogen metabolism. As for aerosols, China might be giving us a large chunk of it but, if we were to have a global depression, all nations' aerosols would be lowered. I don't think that GW will be leveled by the 'three sisters'.
    0 0
  26. "Or, is the Kaufmann aerosol paper trying to explain a slowdown in warming that doesn't even exist?" This is true but considering things carefully compared to all others barometers of excessive energy in the system the actual rise in air temperature has been modest at least. As well as the direct reflection of SO2 there are also the very large brown clouds over Asia which heat the atmosphere and trap energy in the system but shade the surface bringing in another artificial cooling of surface temperatures. China is about to cut its SO2 emissions as the air is getting hard to breath there now. http://business.globaltimes.cn/china-economy/2011-03/632936.html What is the climate sensitivity to GHG again?????! Also it has recently been shown that due to the effects of nitrogen ferttilisation, despite being a biodiversity diaster has been cooling the planet due to ozone interactions and enhancement of the apparent CO2 fertilization effect (excess nitrogen in the eco-system has fertilized the forests making the land CO2 sink seem greater than it actual is).http://www.nine-esf.org/ENA Now all these cooling influences are short term and the cuases for need to cease for health reasons alone, so that means that warming if GHG theory is correct is about to truly start to get going. This is concerning considering how much it is going already. Add in the La Nina prevelance in the 2000's and the solar low and well that 2010 was the hottest year on record seems beyond understanding unless the CS is a lot higher than thought, or in line with paleoclimatic suggestion. 400ppm peak anyone!!!??? That gives a carbon budget of 4 years to prepare for what is likely to be the most rapid change in the earth's climate so far.
    0 0
  27. Cynicus - " This question keeps nagging in the back of my head and I would like to have this clear: "Why wasn't the hottest decade hotter?", you imply: without Eastern Asian aerosol emissions it would have been even warmer?" I don't imply, I state at much. That's a consequence of the statistical modelling of radiative forcing used by Kaufmann (2011). The two climate modelling studies cited in the post show that Asian reflective aerosol emissions are more potent than either European or North American emissions - historically the worst polluters. Dr James Hansen also seems to be of the opinion that the sun-shield provided by sulfates is much stronger than commonly suggested in scientific circles. If he and Kaufmann are right, and only time and further research will tell, then there's a lot of warming in the pipeline.
    0 0
  28. Apologies if this is off topic: From just eyeballing figure 1 the increase in temperature between 1910 and 1940 seems to be similar to current rate of warming. Is this just due to the early on set of global warming from emission during the industrial revolution? Or is there some natural forcing during that period as well?
    0 0
  29. Hyperactive Hydrologist IIRC the most recent IPCC WG1 report attributes most of the warming in the first half of the 20th century to solar forcing. The similarity in the rates is probably just a coincidence; the warming we see is a result of changes in multiple forcings, both positive and negative, so there are many ways to get the same trend.
    0 0
  30. Barry - "The point of your post is that the globe has not warmed as we had expected, and we've come up with a new analysis to answer that. We've changed our narrative and we need to be careful in expressing it properly." Barry, you seem to imply some sort of flip-flop by SkS. That's not the case, there's a significant difference between "skeptic" claims of global cooling (wrong) and slower rate of warming (right). I don't expect the future rate of warming will be steady, nor did I expect the past decade to be, so there's no narrative to change. Heck, even the ocean heat content data and sea level rise, show a slowdown during this period. However, when you step back and look at the long-term trend, global warming just keeps on trucking. Like the teeth of a mangled hand saw blade, the future will see global warming in fits and starts. Indeed if the past equator-to-pole, and surface-to-deep-ocean, temperature gradients are any indication of the future, then we should expect periods where there is very little surface warming - when the deep ocean heats up. But also intervals where there is abrupt warming. The abrupt warming intervals are what concerns me.
    0 0
  31. Dikran - thanks for your response. Could we see a the trend in global temperatures continuing if India decides to start building coal power stations at an increasing rate? 1.2billion people in India, we can't expect them to go without electricity forever. Indian Coal Rush
    0 0
  32. Broken link? Indian Coal Rush
    0 0
  33. Hyperactive Hydrologist If it did, it would only be masking the warming due to the additional CO2 emissions, and when the aerosol emissions end, they are quickly removed from the atmosphere (unlike the CO2) and the enhanced greenhouse effect would rapidly reassert itself again in a big way. Of course we all want the standard of living in the third world to improve with time (at least I would hope we all want that); however in order to achieve that without making our global environmental problems even worse, we need to reduce our emissions in the first world. However that is a topic for a different thread.
    0 0
  34. Hyperactive Hydrologist, Whether the two warming periods being similar is a coincidence or not has been a subject of a large, on-going debate. The bigger question concerns the intervening cooling period, and the most recent decade. As mentioned previously, one thought is that aerosols arising from two different sources have generated the slowdown in both cases. An alternative has been the PDO cycle. Both are plausible, but may only be part of the answer. If the answer is aerosols, that would argue for a climate sensitivity on the higher side, whereas the PDO would place it on the lower side. Two 60-year cycles could be a coincidence. Three would be telling.
    0 0
  35. Eric the Red there has not been a large on-going debate as to whether PDO is the cause of the observed warming, except in the blogsphere. You need a physical mechanism that can explain the strenght of the effect, not just a correllation before scientists will take a theory seriously (because corellation is not causation). There is plenty of discussion in the blogs, but that is largely a reflection of the relative quality of science in the journals and in the blogs concerned. "three would be telling" is statistically nonsensical. In the absence of a competing explanation, then three cycles in a dataset would be taken as good evidence for a periodic structure. However in this case there is a competing theory and you would need to revise physics to explain why CO2 and aerosols and solar forcing were not having their expected effect.
    0 0
  36. on cycles, this paper by Vincze and Janosi may be of interest. They discuss the effect of smoothing on identifying the 'AMO', and suggest that the 'O' of AMO should be replaced by a 'V' for Variation. Similar to Tamino's articles about people who find 'cycles' in data where the period of the proposed 'cycle' is large in relation to the total time period under study. Just because you think you find a 'cycle' rather than an apparent variation that is vaguely coincident does not take you any closer to a physical driver of the climate system. As mentioned before (#14 and Dikran above) there is no underlying physical energy transfer mechanism for the PDO, and perhaps the best explanation is an integral result of the events of ENSO. As there is no clear means for PDO to add or remove significant energy from the climate system, why do people hold on to it for an explanation of climate changes? Far more plausible, and with energy flows and physical mechanisms understood in support, are variations in aerosols largely causing the 1960s cooler episode. Given Tamino's analyses (#5), and the data from global analyses such as GISS, and of course the ever-present internal variability of the climate signal, I suspect the 'hiatus', if it even significantly exists, is one already explained by existing climate drivers, the consequence of which will be renewed rapid warming soon. If there really is an aerosol signal, in the last few years of data, then it suggests a scary future, as the other key exogenous factors (esp ENSO, solar) already do a good job of explaining the 2000's.
    0 0
    Moderator Response: (Rob P) The PDO is off-topic. Further comments should be made on the relevant thread.
  37. As Icarus pointed out at 6 in this blog, if we use the GISSTEMP record the warming continues unabated. The deniers use HADCRU (which they say is discredited by e-mails) because it does not show all the global warming. I think the lead article should have made a strong point that it is only when you use HADCRU that you find warming slowed. HADCRU is well known to underestimate global warming over the past decade due to lack of Arctic coverage. It is better to use GISS because GISS more accurately reflects what is happening around the globe. Using GISS we find that global warming did not slow during the 00's. Hansen agrees with Kaufman that sulfate aerosols mask a lot of warming. The Faustian bargain will soon come due. When sulfate pollution is controlled the temperature will rise even faster than it currently is rising.
    0 0
  38. Michael, Not sure why you think that GISS does not show the same slowdown as the others. Looking at the graphs for global temperature, the last decade has not shown the same rise as the previous two. Of course, one could argue that the temperature moves in jumps rather than continuous increases as witnessed near the start of the past three decades. IF that is the case, then the recent stabilization is just a consolidation before the next upswing. http://data.giss.nasa.gov/gistemp/graphs/Fig.A2.gif http://data.giss.nasa.gov/gistemp/graphs/Fig.C.gif
    0 0
    Response:

    [DB] Those believing in physical reasons underlying the GISS temperature changes rather than climastrology should take heed of this Tamino analysis, wherein he examines the GISS temperature record through 2010.  Removing the exgenous effects like El Nino, volcanic effects and annual cycles yields this:

    GISS Exogenous Removed

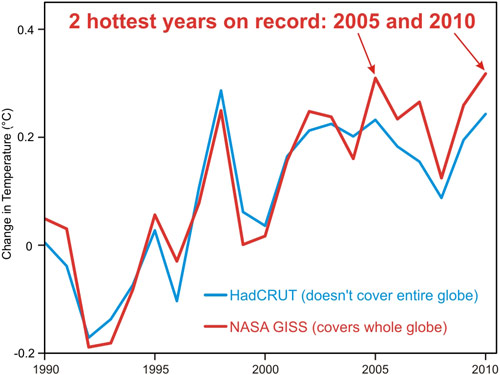
    No "stabilization" evident.  In fact, 2010 was the hottest year in the temperature record (despite a "perfect storm" of low TSI, a strong La Nina and high aerosol emissions) followed closely by (drumroll please, maestro)...


    ...2009.


    Of course, one could argue for the need to keep an "Open Mind" about things, but predilections for mystical "cycles" neccessitate one's brain possibly falling out said open mind.

    And that benefits no one.

  39. Rob Painting... do you have an answer to my question at 16?
    0 0
  40. Eric the Red, Rather than eyeballing a few pixels, crunch the numbers. GISS: Global-mean Combined Land-Surface Air and Sea-Surface Water Temperature Anomalies dataset The GISS Surface Temperature Analysis (GISTEMP) main page has a discussion on the usage of temperature anomalies versus absolute temperatures. Decade: Anomaly (change) 2000s: 51.6 (+20.3) 1990s: 31.3 (+13.8) 1980s: 17.5 (+17.5) 1970s: -0.1 The 2000s were warmer than the 1990s by a larger margin than the 1990s were warmer than the 1980s. It was also the largest decadal change on record. How is that a slowdown? Here is the rest of the crunched dataset for comparison. 1960: -1.4 1950: -2.0 1940: 3.6 1930: -4.2 1920: -17.6 1910: -27.6 1900: -26.1 1890: -25.6 1880: -27.3
    0 0
  41. Sphaerica @ 39... I was just over in China and the news there is saying that the central government has already been fairly aggressively shutting down older plants who have not put in pollution controls. Apparently the government gives out notice to upgrade or be shut down. Then when the upgrades don't happen they just go in and board the place up.
    0 0
  42. Bibliovermas, Instead of calculating based on 10-year averages, why not use a moving average? Since the 5-yr moving average turning poistive in 1978, it has show large and small rise roughly in line with the solar cycle. The largest increase was in 2003, and it has been declining since. It may be nothing more than a response to the changing sun, similar to previous sunspot lows. Using a decadal average, you are showing the increase that occurred in the previous decade, the 1990s, not the 2000s.
    0 0
    Moderator Response: [Dikran Marsupial] Choosing the form of analysis to get the result you are looking for is a form of cherry picking. Decide what form of analysis is required before looking at the details of the data.
  43. Eric the Red Selecting your analysis to fit your hypothesis is an odd form of Inductive Logic (as defined in the 1986 classic Science Made Stupid): Cherry picking, and not a good approach. Your analysis method should be driven by proper statistics, not best-fitting to a conclusion. --- "Once, when the secrets of science were the jealously guarded property of a small priesthood, the common man had no hope of mastering their arcane complexities. Years of study in musty classrooms were prerequisite to obtaining even a dim, incoherent knowledge of science. Today, all that has changed: a dim, incoherent knowledge of science is available to anyone... Indeed, today a myriad of sources are available to explain science facts that science itself has never dreamed of." SmS 2986
    0 0
  44. Given that the Hadley temps omit polar data, would it not be the case that an apparent slow-down in warming when reviewing the Hadley temperature record is simply an artifact of this omission? Bibliovermis' post @40 shows that when you include the poles, warming is continuing largely unabated (per GISS). Or is it the case that warming was expected to be even more severe in the late 'noughts, and papers like Kaufman 2011 are attempting to account for the less-than-expected severity?
    0 0
  45. With reference to Hansen et al. (2010) and GISTEMP. Below is the 132-month running mean (same as in their Fig. 21 except including data until May 2011): [Source: woodfortrees.org] Kaufmann et al. (2011) were interested in the possible causes of that small plateau in the green trace early in the 21st century. Interestingly, Koch et al. (2011) have just published paper on the radiative forcing of aerosols and found that the net direct forcing of aerosols is -0.41 W m-2. They also note that: "To test the climate responses to sulfate and BC pollution, two experiments were branched from 1970 that removed all pollution sulfate or BC. Averaged over 1970-2000, the respective radiative forcings relative to the full experiment were +0.3 and -0.3 W m-2; the average surface air temperature changes were +0.2° and -0.03°C. The small impact of BC reduction on surface temperature resulted from reduced stability and loss of low-level clouds." Koch et al's value is very close to the median value for direct aerosol forcing reported in the IPCC's 2007 report.
    0 0
  46. Bibliovermis @40, I'm sure Eric the Red would want to point out that a running mean is a more accurate indicator. An 11 year running mean of GISStemp increases Using an 11 year running mean, the GISS temperature increases in every year since 1987, but the three years with the highest increases are 1998 (0.038 degrees C), 2000 (0.036) and 1999 (0.032). Comparing decadal means is approximately equivalent to comparing the decadal difference in the running mean for the middle year of each decade, and yields a suitably stark number. But it does not alter the fact that the peak rate of change of GISStemp global index was the late 1990's, and that it flattened to almost zero in 2004, before picking up to 0.028 degrees C (the fourth highest value in the last 50 years). The reason for that is interesting, and prior to 2008 I would have said it was almost entirely an artifact of the very high temperature in during 1997/8 El Nino. However, 2008 was a very cold year for the 2000's, and some additional explanation is called for. However, the combination of Asian industrial aerosols, ENSO and solar minimum seems more than adequate as an explanation. These factors undoubtedly had an effect. Causation does not simply cease to allow us to invoke alternative explanations (or oscillations). The question is whether additional explanation is needed. The fact that when Tamino adjusted five temperature series for ENSO, volcanic sulfates, and the solar cycle, he has such small residuals strongly suggests that no long term cycle is influencing temperatures. In particular, had such a cycle peaked circa 2005, we would expect a strong down turn in the adjusted temperatures, and no such down turn exists: As Tamino says:
    "Another interesting point is that in the adjusted data sets, all 5 sources have 2010 as the hottest year on record. In fact, 4 out of 5 (all but NCDC) also have 2009 as the 2nd-hottest year — quite the 1-2 punch. Of course all trends are statistically significant — strongly so. The conclusion is inescapable: the globe is warming, and shows absolutely no sign whatever of stopping or even slowing its warming. Any talk of “cooling” or even a “levelling off” of global warming over the last decade is absolute nonsense."
    The apparent levelling of in the rate of temperature growth in GISS figures is purely noise due to the interplay of a strong El Nino and declining aerosol levels in 1997/8, and a strong La Nina, increasing aerosol levels and a solar minimum that almost recorded lower activity than that of 1910(?) in 2008.
    0 0
  47. THank you Tom, It appears that we think alike (sometimes). The moving average better shows the large increase that occurred in the 1990s and the slower increase of the 2000s. While I agree with Tamino that ENSO, solar, and aerosols have influenced temperatures of the past few decades, I am not comfortable endorsing his "adjusted temperatures" yet. A few reasons. First, I do not believe that they can be applied uniformly to each database, and secondly, additional work is definitely needed to firm up his corrections for each parameter. That said, I tend to agree that there has been a rather linear temperature increase since the late 19th century, which would probably become evident applying the above listed adjustments to the datasets. Although this will not end the discussion about natural variations, it will go a long way towards incorporating both natural and anthropogenic forces into the equation.
    0 0
  48. Composer99 @ 44 - "Bibliovermis' post @40 shows that when you include the poles, warming is continuing largely unabated (per GISS)" 5 year running mean for the GISTEMP data. No dispute over long-term global warming, but shorter timescales are another matter. Even James Hansen, the head of NASA GISS, claims radiative forcing has declined in the last decade. See figure 1 in his paper Earth's Energy Imbalance and Implications
    0 0
  49. Eric the Red, Using a 10 year moving average, the hottest 28 decade-periods are the past 28; 1937-1946 is #29. The average rate of change over those 28 periods is +1.8. The last 10 years have been the Top Ten, in sequential order except for 2008. Period Endpoint: Anomaly (change) 2010: 54.6 (+3.0) 2009: 51.6 (+2.6) 2007: 50.3 (+1.9) 2008: 49.0 (-1.3) 2006: 48.4 (+2.6) 2005: 45.8 (+2.5) 2004: 43.2 (+2.4) 2003: 40.8 (+4.2) 2002: 36.6 (+4.4) 2001: 32.3 (+1.3) 8 of those top 10 had an above average change. How is that a slowdown?
    0 0
  50. Rob, The effect of the solar cycle becomes quite evident with sunspot minima occurring aroudn 1976, 1986, and 1996. The recent minimum will not become apparent until warming resumes. Longer term effects would not be so evident on this time scale.
    0 0
    Response:

    [DB] "until warming resumes"

    Resumes from what?  Some mythical slowdown?  Perhaps you missed the warmest decade in the instrumental record, as Bibliovermis has kindly pointed out.  Or 2010 being the warmest in the GISS record, followed closely by 2009.  Or 2005.  Yadayadayada.

    Your narrative of cooling/no warming conveniently lacks any tie-in with reality.  But I do give you kudos for determination to not stray from your agenda.

1  2  Next

You need to be logged in to post a comment. Login via the left margin or if you're new, register here.


The Consensus Project Website

THE ESCALATOR

(free to republish)


© Copyright 2024 John Cook
Home | Translations | About Us | Privacy | Contact Us