


 Arguments


Recent Comments
1 2 3 4 5 6 7 8 9 10 11 12 13 14 15 16 Next
Comments 1 to 50:
-
BaerbelW at 20:10 PM on 6 October 2024Skeptical Science News: The Rebuttal Update Project
Cedders @21
Thanks for your comment! Without going into too many details just yet, I can tell you that we are currently working on expanding the "It's too hard" section considerably and plan to publish many additional rebuttals later this month. So - as the saying goes - "watch this space"!
-
Cedders at 19:44 PM on 6 October 2024Skeptical Science News: The Rebuttal Update Project
I would also welcome any expansion of the 'it's too hard' section of myths, as this has been such a boom area since about 2015. Generally industry and society has moved from denial that climate change is a human-caused threat, to delay and sometimes fatalism ('it's too late' could be a whole new top level of the taxonomy). While there are a small rump of people with 'dismissive' attitudes to climate science, a majority of people accept there is a major problem, but are helped to feel powerless to do anything (per Michael Mann's The New Climate War).
Addressing this trand could be seen as straying into technological and economic and policy questions, but objectivity is still possible (eg citing whichever economic opinions are expressed and a range of informed views where there are no scientific facts).
This would be very helpful to deal with in the same format as there are certainly a lot of myths circulating in political circles and media. Typically the misguided arguments concern technology and what can be permitted within remaining carbon budgets, but also sometimes groups of scientists and activists. For example in the context of a climate mitigation conversation, policy-makers can express a preference for hydrogen cars over EVs or even public transport. At that point someone lie Auke Hoekstra or Michael Liebreich can explain simple facts about energy losses in electrolysis and fuels cells or combustion engines. This makes it clear that the most efficient use of renewables will not be hydrogen cars or heating, so investmeet in some hydrogen infrastructure would be a misguided dead end, rather like 'low tar' cigarettes or diesel engines. This is also a consequence of understanding from about 2009 that carbon pollution has to be cut to ('net') zero.
Essentially to get a major policy through needs people to agree it is fair, effective and beneficial. Incumbent industries want to preserve their business model and deny access to new entrants by influencing regulation. So they need to suggest clean technology uptake is inherently unfair, or that it has inherent environmental costs. Informing people about not just why stopping fossil fuels is fundamental but that the transition can generally improve equity and have environmental co-benefits is the hard task ahead.
I hope this take wasn't too off-topic. My thanks to all the SkS authors and editors for their continuing work.
-
Cedders at 19:08 PM on 6 October 2024Skeptical Science News: The Rebuttal Update Project
I'm glad to read that the articles are getting a systematic refresh. Anything to make the rebuttals more accessible can help effectiveness in countering myths, misunderstanding and misinformation.
There are two reasons I can think of for the new intros. People are looking for shorter tl:dr abstracts. Secondly, information can be too technical for some audiences. Unfortunately it's hard for scientifically literate writers to know what is likely to be misunderstood, deliberately or accidentally (we know frequent examples like Greenland surface mass balance). Is the new text being tested against actual occurrences of myths?
I hope there's no need to delete much text from the passage of time and it can be edited instead. Historical perspectives can help transparency. As a hypothetical example: 'Loss of Arctic sea ice seemed in the early 2010s to be happening far faster than projections, leading some people to conclude at the time that summer sea ice would be virtually gone by 2020/whenever and headlines. Ice loss has since slowed bringing it more into line with projections.'
-
Cedders at 18:49 PM on 6 October 2024Breathing contributes to CO2 buildup
BTW spelling: is 'exogenic' in para 2 of basic full text intended to be 'exergonic'?
-
Doug Bostrom at 15:02 PM on 6 October 2024Remembering our friend John Mason
Thank you for that, hairbear.
-
michael sweet at 06:12 AM on 6 October 2024Correcting myths about the cost of clean energy
David-acct at 8:
I do not need you to explain how electricity was generated in the 20th centuary. We are now replacing obsolete, polluting energy sources with cheaper, cleaner renewable sources. We need to evaluate how energy resources will contribute to a future renewable system. At the same time we want to keep prices down.
We currently have a hybrid system while the renewable system is being built. Renewable wind and solar can generate most needed power using existing peaker plants as storage. Old baseload plants cannot compete economically with cheap renewable energy. As more wind and solar is built obsolete plants are closing. Expensive coal and nuclear have closed first.
Batteries are now cheaper, more versatile and provide more grid support services than peaker plants. Batteries store extra power on sunny, windy days. As demonstrated by the EIA report you cited, (I note the EIA has always been biased against renewable energy in he past) the market is planning on building a lot of wind, solar and batteries in the next four years. Very litle, heavily subsidized, gas is planned. Everyone in the market can see the handwriting on the wall. The market is building out cheap renewables virtually everywhere in the world.
The professionals at Lazard. have chosen LCOE as the best metric to compare different technologies. The EIA report does not support your claim that obsolete technologies are cheaper than renewable energy. You have cited no authoritative sources to support your argument that Lazard is incorrect. Your argument that obsolete technology should be promoted is simply wrong.
In any case, the website Oil Price says all the best fracking sites in he USA have been tapped. Fracked wells decline in production very rapidly (just two or three years). Oil, gas and coal are finite resources that are declining. We have to build out a renewable system now before those nonrenewable sources run out.
I am surprised that someone with a background in cost accounting is so supportive of expensive, polluting, obsolete technologies when cheaper alternative sources are readily svailable.
-
michael sweet at 05:34 AM on 6 October 2024Correcting myths about the cost of clean energy
David-acct at 7:
As Nigelj has pointed out, other energy sources besides renewable energy are heavily subsidized. Fossil fuel subsidies in 2022 were estimated at $7 Trillion, far more than subsidies for renewable energy.
Zero nuclear power plants world wide have been built without enormous subsidies since they are not economic.
-
Cedders at 20:47 PM on 5 October 2024Breathing contributes to CO2 buildup
This is my attempt to contrast biogenic CO₂ and fossil CO₂ in one figure, referring back to this page. The diagram already seems too complex without all the ocean carbon cycles and weathering details. One implication: Bill Gates's recent comment about ineffectiveness of tree-planting is not far off the mark.

The animal carbon cycle estimate is based on rough caloric intake and vertebrate biomass estimates; I'd be interested in any better sources. Also notable from IPCC figure: ocean-air fluxes are up nearly 50% owing to human activity, and photosynthesis up 25%.
I'm not sure what the image constraints are here, but playing it safe: this is half-width the graphic is intended for.
-
Charlie_Brown at 04:44 AM on 5 October 2024CO2 effect is saturated
JockO @ 711 This is a long and convoluted thread, but your question is a very good one. Recently I had another occasion to find the answer. Upon reviewing the many comments since 2019, the concept of saturation has been discussed thoroughly and does not need to be repeated. I also got involved with that between @669 and @679. However, the specific problem with Wijngaarden & Happer has not been pinpointed previously.
W&H describe the physics of radiant energy and the effect on the spectrum of outgoing infrared radiation very well, not withstanding a complex and distracting diversion into the atmospheric temperature profile. However, they make a misleading comparison to reach a false conclusion that “at current concentrations, the forcings from all greenhouse gases are saturated.” They compare the effect from 0-400 ppm with 0-800 ppm, both of which include the very steep initial slope of the band saturation effect, to conclude that the current rate of global warming is negligible. But the initial steep slope is irrelevant to anthropogenic global warming. In W&H Figure 4, they illustrate and compare the difference in the green line (0 ppm) and the black line (400 ppm) to the difference between the green line and the red line (800 ppm). To describe global warming, they should be comparing the difference between the black line and the red line. Thus, they use an irrelevant comparison to reach an incorrect conclusion “at current concentrations, the forcings from all greenhouse gases are saturated.” Saturated should mean no change as it would to a lay person, not diminishing change, although even the semantics of the definition are debated and misleading. In any case, anthropogenic global warming is not negligible.
-
nigelj at 04:38 AM on 4 October 2024Correcting myths about the cost of clean energy
David-acct @7
"Nuccitelli as you noted, uses the after tax credit LCOE cost for renewables. Those tax credits get paid by the consumer in the form of higher income taxes to cover the subsidy.
Yes but it should be noted that gas and coal fired powered generation and nuclear power also get very substantial tax credits or subsidies with costs passed onto consumers. All effects their LOCE numbers as well.
David-acct 8
I think M Sweets point about the electricity system might have been that criticising renewables based on the reliance on gas peaker plants is ultimately flawed because a fully renewables system would be generation and storage without a need for gas peaker plants. So your response quoting baseload and peaker plants doesnt address the point. We are talking about two completely different operating systems. Interesting though how the current system operates so good information in that respect.
-
David-acct at 11:04 AM on 3 October 2024Correcting myths about the cost of clean energy
Without addressing your last paragraph directly, it should be pointed out the need to understand the fundementals of electric generation. Electric generation has three major tranches of electric generation demand. First there is baseload power demand, second there is intermediate level demand and third peaker level demand. Peaker demand is the most expensive tranche of demand because it is only needed when demand is high, Peaker has low fixed costs, but high marginal costs. That is generally okay since the peaker demand is infrequent. Baseload has high fixed costs though low marginal costs. Intermediate demand is the lowest cost of the three tranches.
Its also important to understand the fossil fuel, hydro, nuclear electric generation are all Demand constrained generation sources. Wind and Solar on the other hand are resource constrained, ie electric generation limited resources ie amount of wind.
It should be noted that Wind and solar perform very well in middle intermediate tranche of electric generation demand, while performing very poorly in the peaker demand tranche precisely due to their resource limitations.
With that background, when comparing costs across each type of electric generation source, it important to compare Baseload LCOE for gas, coal, nuclear against baseload LCOE cost for Wind and solar. Same with comparing Peaker LCOE cost for Gas, coal, against peaker LCOE cost for Wind and Solar. Its telling that Lazard's doesnt compare across each of the demand tranches.
As noted in the EIA article, its also quite telling that the industry does not use LCOE in plant generation planning because the LCOE doesnt provide any meaningful information for purposes of cost analysis.
lastly, my background is accounting and cost accounting, as such, it is much easier to spot and recognize inconsistencies in the presentations and representations than the layman.
-
David-acct at 11:00 AM on 3 October 2024Correcting myths about the cost of clean energy
The point of the article is "correcting myths about the cost of clean energy"
When compare costs of each type electric generation it is important to compare apples to apples.
Nuccitelli as you noted, uses the after tax credit LCOE cost for renewables. Those tax credits get paid by the consumer in the form of higher income taxes to cover the subsidy (subsidies arent free in macro economics) or paid by the consumer in the form of higher prices due to inflation which is the result of deficit spending. Thus using the after credit LCOE cost is hiding the full LCOE cost.
-
hairbear at 20:35 PM on 1 October 2024Remembering our friend John Mason
I first met John just over 43 years ago on our first day at Aberystwyth University in 1981. We've kept in touch on and off over the years and was in contact with him just weeks before he died. It was a real shock to the system that someone so young should die so suddenly. I'm going to the funeral but will have to ask Johns sister if it's OK to post the details here in case anyone wants to go.
-
michael sweet at 13:19 PM on 1 October 2024Correcting myths about the cost of clean energy
Sorry about all the typos, I am out of town and it is difficult to type on my tablet.
-
michael sweet at 13:18 PM on 1 October 2024Correcting myths about the cost of clean energy
David-acct:
rn
You appear to have cited the incorrect page in the EIA report. Page 9 does not discuss LCOE as you suggest. LCOE is discussed on page 7. The EIA has a metric called LACE which. I do not remember seeing this metric before. It appears to me that the graph on page 7 shows that most of the wind and solar projects have good to outstanding LACE while none of the as projects have good LACE.
rn
I note that on page 6 the EIA estimates that in 2028 approximately 30 GW of wind will be built, 20 GW of solar, 2 GW of gas and zero nuclear. I thought that was interesting because there is cursors solar under construction than wind. Obviously gas is on the way out.
rn
I note that in the past the EIA has grossly underestimated the amounts of renewable energy to be built. The EIA cost of nuclear is half the Hazard cosr. The EIA has consistently underestimated nuclear costs in the past.
rn
Nuccitelli clearly labels his graph as "Levelized cost of energy with IRA tax credits". You list the cost without the tax credits. Your assertion that Nuccitelli used the low end of the range for solar and wind LCOE is false. The comparable graph in the Lazard report (which does not include the taxes) states that the average of the high and low values are used. Nuccitelli used the average of the high and low values from the tax included table. The EIA report states that the average cost of construction of wind and solar is less than the average of the high and low
rn
If you read the sources that you cite more carefully you will stop making obviously false claims. Please try to read more carefully, it is very time consuming for me to read all the citations to find errors.
rn
Baseload plants cannot generate peak power and require back-up by peaker plants. Electricity in a traditional system always costs a lot more than the costs of the base load plants since during the day everyone is paid the peaker plant rate. Baseload plants make all their money during the day and often operate at a loss at night.. Renewable energy systems can supply all required power and require storage for times of low generation. Since the two systems work completely differently Lazzad has to compare the costs they think are most comparable
-
michael sweet at 13:18 PM on 1 October 2024Correcting myths about the cost of clean energy
David-acct:
You appear to have cited the incorrect page in the EIA report. Page 9 does not discuss LCOE as you suggest. LCOE is discussed on page 7. The EIA has a metric called LACE which. I do not remember seeing this metric before. It appears to me that the graph on page 7 shows that most of the wind and solar projects have good to outstanding LACE while none of the as projects have good LACE.
I note that on page 6 the EIA estimates that in 2028 approximately 30 GW of wind will be built, 20 GW of solar, 2 GW of gas and zero nuclear. I thought that was interesting because there is cursors solar under construction than wind. Obviously gas is on the way out.
I note that in the past the EIA has grossly underestimated the amounts of renewable energy to be built. The EIA cost of nuclear is half the Hazard cosr. The EIA has consistently underestimated nuclear costs in the past.
Nuccitelli clearly labels his graph as "Levelized cost of energy with IRA tax credits". You list the cost without the tax credits. Your assertion that Nuccitelli used the low end of the range for solar and wind LCOE is false. The comparable graph in the Lazard report (which does not include the taxes) states that the average of the high and low values are used. Nuccitelli used the average of the high and low values from the tax included table. The EIA report states that the average cost of construction of wind and solar is less than the average of the high and low
If you read the sources that you cite more carefully you will stop making obviously false claims. Please try to read more carefully, it is very time consuming for me to read all the citations to find errors.
Baseload plants cannot generate peak power and require back-up by peaker plants. Electricity in a traditional system always costs a lot more than the costs of the base load plants since during the day everyone is paid the peaker plant rate. Baseload plants make all their money during the day and often operate at a loss at night.. Renewable energy systems can supply all required power and require storage for times of low generation. Since the two systems work completely differently Lazzad has to compare the costs they think are most comparable
-
scaddenp at 05:36 AM on 30 September 2024Remembering our friend John Mason
In a world that badly needs both accurate information and hope, John provided both. His passion will be sadly missed.
-
Eclectic at 04:22 AM on 28 September 2024Just have a think: Arctic Sea Ice minimum 2024. Three degrees Celsius warming now baked in?
Jim Hunt @4 :
Yes, you won't get much sense from yer average WUWT-er in the comments columns. As you know. Still, your good self plus Tony Banton, Nick Stokes, and a few others all do contribute a modicum of amusement to the columns ~ when you stoop to tweak the noses of the regular "attack dogs" at WUWT.
But your term "attack dogs" is being overly generous to what is really more like a pack of rabid Chihuahuas with blunt teeth.
Keep up your good work, Jim. And ankle boots will be enough protection against the rabies at WUWT.
.
-
Jim Hunt at 23:10 PM on 27 September 2024Just have a think: Arctic Sea Ice minimum 2024. Three degrees Celsius warming now baked in?
Eclectic @3,
I was indeed, but the UKMO's Tony Banton described Anthony's flock of faithful followers as "attack-dogs"!
Even when I point them at scientific explanations for the alleged "hiatus" in the wiggly line of Arctic sea ice extent they respond with "ROFLMAO" and similar astonishing insights:
https://GreatWhiteCon.info/2024/09/the-2024-arctic-sea-ice-minimum-extent-in-the-cryodenialosphere/
I'll be publishing a more "scientific" article on the subject, as and when the overdue sea ice age data for August are released. In the meantime, there wasn't much "thick, old ice" left in the Arctic Ocean at the beginning of August: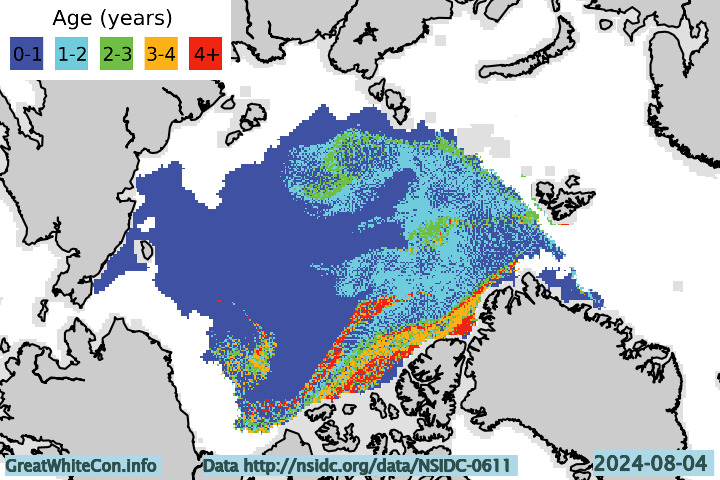
-
Sarah at 22:57 PM on 27 September 2024Remembering our friend John Mason
I'm very sad to learn of the passing of this dedicated climate hawk and prolific SkS contributor. A blessing and a curse of the internet is "meeting" amazing people online whom we never meet in person. All of us who "e-met" John have been touched by his passion and energy.
May his memory be a blessing. -
Eclectic at 12:50 PM on 27 September 2024Just have a think: Arctic Sea Ice minimum 2024. Three degrees Celsius warming now baked in?
Jim Hunt @2 ,
you were, two or three days ago, crossing swords with the amiable skeptics at WUWT blog, about Arctic ice.
It seems they feel that a sort-of flat-lining of minimum Arctic sea-ice extent during the past decade . . . is a disproof of the contemporary reduction in Arctic sea-ice volume . . . which in turn demonstrates that there will be no further ice melt as sea-level continues to rise ~ the ongoing rise which in turn disproves that global warming is occurring. (If I have understood their argument correctly.)
And since global warming is not continuing, despite rising measurements by worldwide thermometers, then the whole AGW thing is a hoax and can be ignored.
Or something like that.
And if Plan Denial eventually crumbles, then the WUWT skeptics will develop "concepts of a plan" to deal with the non-problem. [Please excuse contemporary 2024 political joke.]
-
Jim Hunt at 10:28 AM on 27 September 2024Just have a think: Arctic Sea Ice minimum 2024. Three degrees Celsius warming now baked in?
"Ice of this age is now mostly confined to a narrow strip extending from north of Greenland along the north-west edge of the Canadian archipelago."
The most recent PIOMAS thickness data suggests that it is now mostly confined to a small area within the CAA:
https://GreatWhiteCon.info/2024/09/facts-about-the-arctic-in-september-2024/#Sep-21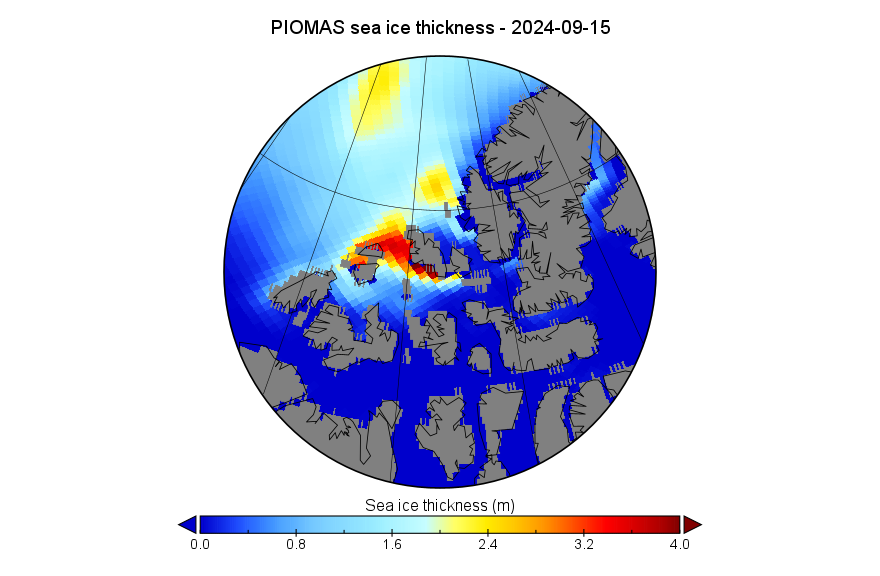
-
Eclectic at 17:19 PM on 26 September 2024Correcting myths about the cost of clean energy
David-acct @2 ,
you are quite correct, in that pricings ought to cover external costs.
Also, the projected future costs.
Thus the costs should be shown in several categories :-
(A) The immediate LCOE, and projected costs at 5, 10, and 20 years.
(B) Immediate and projected total grid costs.
(C) A range of amortisations regarding environmental and projected societal costs.
*
Of course, (C) is the most difficult to estimate. Yet important, in both dollar and non-dollar terms.
And (A) ventures into guesstimations of changes in technology.
But we should always be looking at the bigger picture.
-
David-acct at 13:06 PM on 26 September 2024Correcting myths about the cost of clean energy
US energy Information Adminstration has an excellent comment on why LCOE is not used by the electric generation industry in planning for plant expansion, primarily because LCOE doesnt capture all the costs and value of the different sources of generation
"LCOE is limited because it only reflects the cost to build and operate a plant, but not the value of the plant to the grid"
See page 9 of the pdf in the attached link.
www.eia.gov/outlooks/aeo/electricity_generation/
A couple of other observations with Chart created by Nuccitelli =
Lazards report shows the LCOE range for the various types of electric generation sources
Wind Onshore $27-$73
Solar utility $29-$92
Gas combined $45-$108 (which includes base gas generation and peak generation)
Coal $69-$168The two observations are why does Nuccitelli's chart use the low end of the range for solar and wind LCOE while showing the upper mid range for gas?
The second question is why the LCOE computation used by lazards for gas include both baseload costs and peaker costs (peaker costs being the highest cost for all sources of electric generation) and then comparing to the LCOE for wind and solar when they dont perform in that space?
thanks for an explanation
-
sailrick at 13:16 PM on 25 September 2024Just have a think: Arctic Sea Ice minimum 2024. Three degrees Celsius warming now baked in?
From the World Meteorology Organization's report; The Global Climate 2011-2020
"Reduced sea ice extent was accompanied by a decrease in thickness and volume, although data for these indicators are more limited. There has also been a marked decrease in the extent of ice which lasted for
more than one year.
In March 1985, old ice (four years or more) accounted for 33% of the total ice cover of the Arctic Ocean, but that figure had fallen below 10% by 2010, and in March 2020 it had dropped to 4.4%..
Ice of this age is now mostly confined to a narrow strip extending from north of Greenland along the north-west edge of the Canadian archipelago." -
RedRoseAndy at 01:41 AM on 25 September 2024Correcting myths about the cost of clean energy
The Labour Government in the UK are in a rush to get to get clean energy by 2030. Due to the last Conservative Government there are few onshore wind turbines in the UK, but their planning permission allows them to be made taller to take bigger blades, and if we add the maximum height allowed by the planning permission we can approximately triple the amount of electricity generated. And of course the infrastructure is already built so we can triple onshore wind turbine electricity in months. This is a win win as infrastructure takes a long time to put in, and at great expense. Great British Energy can hit the ground running by picking the lowest hanging fruit. Octopus Energy is already buying up 10% of our onshore wind turbines to heighten our onshore wind turbines, and we can do the other 90% by paying the owners to do the work, or nationalizing them.
-
MA Rodger at 00:07 AM on 23 September 2024The doom spiral
Jan @4,
I don't think I can agree with your assertion that with AGW, "we are now flying blind."
Climate scientists are well aware of the potential for nasty surprises being stoked by humanity's greenhouse gas emissions. For some time now, the message has been that anything warmer than a +1.5ºC world is running the risk of bringing on some of those nasty surprises. (This safety limit was originally +2.0ºC prior to ~2010.) Mind, extinction of the human race will be far from the first nasty surprise to arrive. Of course, logically it would be the last but, that said, it would be a long long way down the road in terms of global tmperature rise.
The big risk we face not addressing AGW (which is where we are today) is messing the climate enough to bring the global economy crashing down around our ears, an economy the vast majority of humanity rely on to keep them fed and watered.You do make some very brave assertions which I consider are difficult to support.
As an example, I would question some of your comment on the "methane feedback."
Present natural methane emissions have not been easily quantified but they are included in the climate modelling and their growth has been a part of the projected methane forcing. Certainly recent work suggests the modelled natural emissions are running behind the assessed natural emissions and projections are not capturing the full picture. But this is not to the extent that natural methane would become a significant feedback mechanism. (See for instance Kleine et al (2021) or Zhang et al (2023).) However, the increase in natural methane emissions is one of the potential nasty surpises.One area of natural methane emissions where people often express great concern is the Arctic emissions, an understandable concern but one which is misplaced. Years ago I went down this road myself.
But it should be said that your brave assertions do require supporting evidence.
-
emerlin at 21:08 PM on 22 September 2024Veganism is the best way to reduce carbon emissions
Guilhem,
thanks for your detailed post! Very compelling and thorough.
-
Eclectic at 05:07 AM on 21 September 2024The doom spiral
Jan @4 , your ideas are all very fine.
But rather than basing your thoughts on climate models and/or on speculations ~ you could look at the Earth's geological history. Such as what happened during the warmer period of the Eemian, around 120,000 years ago.
-
The doom spiral
Sadly, climate scientist have no time to follow the path single discussions on feedbacks take. Therefore, they think models can in anyway predict what is comming. Unfortunately they can't! So many models errors of Earth system developments now amerging that one can only vomit.
Thererby, models miss way too many feedbacks which are now soming into motion.
The Amazon is now trapped in the vicious cycle, speeding up its collapse decades earlier then predicted. Antarctic heatwaves and see ice losses also happens decades earlier then predicted.
The methane feedback has started while models did not see a significant signal till 2100 to emerge. The methane modul of models is crap! But do not know if the new one is already deployed.
Be it as it may, the warmings of the Arctic methane bomb are now out and will increase the comming years as recent observational studies are quite worring. Not only Yedoma permafrost emits much more, but the real danger will be geological methane from methane hydrates and gas rich sediment layers, which is a wild card, which is ever more observed and documented - methane of thermogenic origion reaches the atmosphere where measurements have been made, while ground water melts its way downward through cracs driven by osmosis.
Marine heatwaves, a feedback of oceans warming too fast, are also not predicable by models as they are driven by small scale to global circulation patterns in the oceans and atmosphere. We have now the first MHW in the North Pacific reaching in its peak regions some 7-8°C above the 1981-2011 average (one cause: Asian flooding amplifying the subtropical North Pacfic high via hot upper air currents).
Not only that marine heatwaves expanded non-linear, they are also a game changer in terms of ocean heat uptake, circulation patterns, and extreme events. Models were not able to predict their spread which can only be described as nuts.
Next problem we face is that over the oceans first 300m ocean heat is now building up, in the mode water and intermediate water mass regions the heat buildup spreads to deeper layers with subsurface water masses warming, freshening, and expanding. Very bad sign indeed!
First study came now out that vertical mixing of the oceans could already be suppresed by increasing stratification. Further, we see worrying changes in mode water masses in the Northern Hemisphere. At the same time recent changes around Antarctica (e.g. warming and hemispheric temperature gradient declining -oops!) are also worrying as it has been the Southern Ocean that had been mostly responsible for the monotoic trend of incrasing heat uptake the last 20 years - intensfying winds around Antarctica the major reson (Ozone hole supported that development of increasing hemispheric temeprature gradient).
Just now the experts of ocean mxing and ocean heat uptake trying frantically to find out which processes controlls heat uptake of the oceans as we did never really loocked into it. But now the changes become so worrying that our simple assumption that the oceans would continue their monotoic trend in increasing heat uptake like nothing was amiss doesn't matter how fast we warm our planet had been way too simple.
If ocean heat uptake declines from 90% of the extra energy to 80%, the whole goes fast bam, as a too fast warming had been the problem in the first place.
And if oceans should start to take less than 90% of the extrem energy kept in the system, all the other feedbacks will be triggered.
This can go very fast! Doomer? Stupid framing of the system, as the above is in all points a real possibility as we do not know when and how fast feedbacks could start to synchronize.
And if this should happen the only chance humanity will have, will be to reduce GHG conrentrations in the atmsphere as fast as we can do it united as a species figthing for its own survival!
Sadly, many climate scientist have become statisticans and thereby they have lost contact with reality as the discussions deep in the mechanics of our climate systems point something very clear out:
We are now flying blind and even an extinction level event is a possibility whch can progress fast!
-
Bob Loblaw at 10:34 AM on 20 September 20242024's unusually persistent warmth
Pattimer @ 6:
A change in salinity would be something I would consider to be a change in chemistry, and the resulting change in density would be something I would consider to be a change in physics. As salinity and density are important considerations in global ocean circulation patterns, yes a major shift in salinity could result in changing ocean circulation and changing where in the system (deep ocean, shallow ocean, atmosphere) thermal energy is stored.
In terms of process, higher temperatures usually means more evaporation, which increases salinity. Higher salinity means higher density. But a lot of the small-scale circulation in the upper ocean (60-100m) is wind-driven. Salinity does play a role in larger/deeper ocean circulation.
You may wish to read this SkS repost from RealClimate, from last February, on the Atlantic Meridional Overturning Circulation.
I think we're in agreement that time will tell, as more data comes available and more analysis is done.
-
pattimer at 07:13 AM on 20 September 20242024's unusually persistent warmth
.... however IF there were enough changes in the surface salinity of the oceans for example resulting in circulation changes with less heat sinking would this be classified as a physical or chemical change? Would it matter anyway what we called it?
-
pattimer at 06:07 AM on 20 September 20242024's unusually persistent warmth
Bob:-
Thank you for your reply.
I cannot explain a mechanism for my speculation. It is because I am both concerned and puzzled by these observations that I ask these questions and will keep a look out to see how this pans out as undoubtedly many experts will be following this up.
-
Bob Loblaw at 05:21 AM on 20 September 20242024's unusually persistent warmth
pattimer:
To have chemistry or biology affect atmospheric temperatures, you need to argue that there is a mechanism by which those changes in chemistry and/or biology lead to a physical change in atmospheric heat storage.
For ocean chemistry, you would need to have chemical reactions that release enough energy to lead to increased ocean temperatures, which would then lead to increased atmospheric temperatures. This seems highly unlikely, but I'm open to suggestions.
For biological activity, the same applies. Photosynthesis is a possible suspect, as that consumes energy at the surface. The energy that goes into photosynthesis would otherwise go into the other energy transfers that occur at the surface: emission of IR radiation back to the atmosphere, transfer of heat (thermal energy) into the atmosphere, transfer of heat into the ocean or land, or the evaporation of water (which then goes into the atmosphere in the form of latent heat, and is released to thermal energy when the vapour condenses again). If there is less photosynthesis, then more energy would go into the other fluxes, but where?
...but photosynthesis is already part of the system (as is heat released as carbon is oxidized), and you'd have to argue a change in biological activity that is pretty large.
-
pattimer at 20:19 PM on 19 September 20242024's unusually persistent warmth
Bob Loblaw:
You may be right, and probably so. However the chemistry of the oceans is changing and changes in biology will affect this outwith photosynthesis. The oceans are becoming more acidic for example (although I am not saying that changes in air borne fraction of CO2 is involved here as that presumably would have been accounted for).
We will see if this pattern of unexplained increased air temperatures persist on the long term or not, through the different phases of the El Nino La Nina.
Certainly worrying regardless.
-
Mal Adapted at 23:10 PM on 18 September 2024The doom spiral
Thank you!
-
BaerbelW at 15:24 PM on 18 September 2024The doom spiral
Mal Adapted @1
Thanks for the heads-up. I just now sent an email to Zeke to let him and Andrew know about the issue.
-
Mal Adapted at 07:14 AM on 18 September 2024The doom spiral
Hi, Andrew,
I'm not on X, but I saw this fresh post by you here! Do you know why DNS lookup currently fails for theclimatebrink.com?
$ nslookup skepticalscience.com 8.8.8.8
Server: 8.8.8.8
Address: 8.8.8.8#53Non-authoritative answer:
Name: skepticalscience.com
Address: 192.73.240.141$ nslookup theclimatebrink.com 8.8.8.8
Server: 8.8.8.8
Address: 8.8.8.8#53Non-authoritative answer:
*** Can't find theclimatebrink.com: No answerI first noticed it about an hour ago.
TIA.
Your Bulldog, Mal
-
Bob Loblaw at 05:07 AM on 18 September 20242024's unusually persistent warmth
pattimer:
My first reaction is to think "nothing chemical or biological". The energy sink that we see as global warming is entirely physical - thermal energy. Plant photosynthesis does store energy from the sun, but that is essentially offset by the release of energy as biological carbon decomposes.
Most of the energy imbalance (solar radiation absorbed, minus infrared radiation emitted out to space) goes into oceans. The heat capacity of air (the entire atmosphere) is a tiny fraction of the heat capacity of the oceans.
Our routine temperature observations only cover small proportions of the ocean/atmosphere systems. Our most detailed ones are air temperature near the surface - your everyday weather station data. When you see global air temperature fluctuating during El Nino cycles, we are seeing a shift between what stays in the atmosphere and what goes into oceans.
I think it will take time to figure out just what part of the oceans is storing less heat during this period of warmer atmospheric temperatures. And even more time to understand just exactly how the physics has played out.
...but my gut says "physics", not chemistry or biology.
-
pattimer at 19:57 PM on 17 September 20242024's unusually persistent warmth
Could there be some change in the Oceans other than the El Nino cycle, perhaps chemically or biologically that is limiting the oceans previous ability to absorb as much of the global to absorb as much of the global warming
?Moderator Response:[PS] cleaned up multiple comments
-
BaerbelW at 06:44 AM on 15 September 2024FLOATER: A Tool-Kit for evaluating Claims
Melanie Trecek-King published a video summary of her FLOATER toolkit on September 12, 2024:
Enjoy!
-
nigelj at 06:19 AM on 14 September 2024How mismanagement, not wind and solar energy, causes blackouts
David acct @8, I agree there is a lot of misinformation by both sides. However I didn't say or imply wind provided plenty of output in other states. Much of the country had low levels of wind. I didnt dispute that.
The point I was trying to make is that other states did not have big problems with generation because their system is better managed than Texas, and has better de-icing equipment. The reason Texas had a disaster was not renewables, or intermittency of renewables, or fossil fules per se. It was lack of de-icing equipment reflecting bad management by Ercot.
-
David-acct at 21:34 PM on 13 September 2024How mismanagement, not wind and solar energy, causes blackouts
Nigelj
Thanks for the comment.
As I stated, there is tremendous amount of misinformation being pushed by both sides who try to affix blame for the Texas fiasco on only fossil fuels or only renewables. The reality is that all forms of electric generation performed very poorly in the ERCOT grid. The major difference is that ERCOT was heavily dependent on natural gas because it was known 3-4 days in advance that wind was going to produce very little over the next 8-10 days due to the lack of wind . Unfortunately, electric generation from natural gas had a catastrophic failure at a time when it was known that wind could not perform.I am always surprised by the claim that wind did perform on the other grids. That claim is easily debunked by reviewing the electric generation by source at the EIA grid monitor site. Both the performance of the SWPP and the MISO grids of electric generation from wind very similar to the performance of the ERCOT grid over that same time period.
regarding the icing, less than 10% of the wind loss was due to blades icing up, (probably less than 5%), in summary, the icing was a very minor factor with the loss of wind generation. The loss of wind generation due to icing is a common denier talking point, sounds good, but it is false.
Again thanks for your comments
-
BaerbelW at 15:24 PM on 12 September 2024Co-designing the Cranky Uncle Vaccine game in East Africa
If you want to learn more about this co-design process for the Cranky Uncle Vaccine game, head over to the UNICEF-website where they have started to publish the five part series "Seriously Cranky: the uncle we all have helps build the skills we all need to resist misinformation". The first two case studies are already available as PDFs for download:
Case study 1/5 (3MB)
Case study 2/5 (8MB)
-
nigelj at 06:08 AM on 12 September 2024How mismanagement, not wind and solar energy, causes blackouts
David acct. Regarding the Texas power blackout in 2021. I find what you say confusing. You seem to partly blame wind power for the problems, because it didn't generate enough power due to lack of wind. This is not the case. Although there was a lack of wind, the system designers know the wind intermittency issues of wind power and the system is designed with that in mind to ensure it can cope.
The primary reason for the power crisis was cold weather freezing up some wind turbine blades and the gas supply infrastructure. Most of the failure was in the gas infrastructure.
These ice related problems were in turn due to to a lack of de-cing equipment due to ERCOTS irresponsible management of the system and the failure of Ercots oversight body (some of which you mentioned). My reading is that Ercots irresponsible management seems to be driven by a libertarian leaning, excessively business friendly, cost cutting ethos that dislikes regulations and puts safety, ability to handle extreme situations, and grid stability last.
Other states did not have the same blackouts including states with significant wind and solar power. The cold weather icing issue also lead to a cascade of other failures and bad decisions.
References:
www.integrityenergy.com/blog/texas-winter-storm-2021-explained/
-
David-acct at 21:46 PM on 11 September 2024How mismanagement, not wind and solar energy, causes blackouts
Below is a statement in the FERC report which is linked in the article.
Here is a statement from FERC
"Today’s final report highlights the critical need for stronger mandatory electric reliability standards, particularly with respect to generator cold weather-critical components and systems. Notably, a combination of freezing issues (44.2 percent) and fuel issues (31.4 percent) caused 75.6 percent of the unplanned generating unit outages, derates and failures to start. Of particular note, protecting just four types of power plant components from icing and freezing could have reduced outages by 67 percent in the ERCOT region, 47 percent in the Southwest Power Pool (SPP) and 55 percent in the Midcontinent Independent System Operator South (MISO) regions. Natural gas-fired units represented 58 percent of all generating units experiencing unplanned outages, derates or failures to start. The remaining portion was comprised of wind (27 percent), coal (6 percent), solar (2 percent) and other generation types (7 percent), with four nuclear units making up less than 1 percent. "
A couple of points worth noting:
Not only did ERCOT have significant outages of fossil fuel generation, but so did the MISO and SPP grids, both of which were also near collapse.
Wind had 27% outage in addition to a loss of another 30-40% due to the lack of wind. That loss was continental wide. -
David-acct at 21:45 PM on 11 September 2024How mismanagement, not wind and solar energy, causes blackouts
Mr Sweet
First point is that I was only addressing the failure of the fossils fuels during Feb 2021 in Texas along the failure of wind and solar. C
Curious why someone should not review the raw data. The raw data is the foundation of understanding the facts. The Raw data doesnt lie. The EIA clearly shows the electric generation from both fossil fuel and wind and solar performed poorly during the freeze. That is consistent with the FERC report. The EIA website clearly shows fossil fuel lost around 35-40% of electric generation for 3 ½ days in ERCOT while Electric generation from Wind and solar lost a considerably percentage of electric generation for nearly 10 days across all of north america
You also mention the failure of grid in texas, yet you fail to note that both the SPP grid and the MSO grid were also near collapse.
-
One Planet Only Forever at 08:52 AM on 11 September 2024How mismanagement, not wind and solar energy, causes blackouts
I agree with Michael Sweet’s comment @3. However, David-acct does raise important points:
- electricity generation systems need to perform essential services adequately under extreme circumstances.
- it is important to be more fully aware – less misunderstanding (David-acct raises this general concern while appearing to fail to be ‘more generally aware’ as noted by Michael Sweet)
Regarding the need for robust performance:
- The existing electricity system in Texas obviously failed to be developed robust enough. This is a ‘marketplace failure’ that the leadership of Texas failed to act to correct (especially their action to keep the Texas grid isolated to avoid federal requirements that would have made it more robust).
- There is indeed a concern that a renewable electricity system compromised by marketplace interests would also fail to be developed to be robust enough. The marketplace could also fail to make the renewable system as harmless and sustainable as it could be (less harmful and more sustainable ways tend to be more difficult and more expensive. Easier and cheaper generally wins marketplace competitions).
Additional matters that people should be more aware of or have a fuller and better understanding of:
- There can be conflicting interests regarding water storage for hydro-electric generation. A desire for water for irrigation could lead to a reduction of water stored for electricity. And a desire to have capacity in the storage reservoir to act as a flood abatement measure would reduce the storage for electricity. The solution would be to build bigger storage features that have adequate capacity for electricity plus these other interests.
- Reduced energy demand needs to be the objective. Technological development that reduces energy demand needs to be prioritized over developments that do not reduce energy demand. The marketplace has a history of failing to do that sort of thing.
-
michael sweet at 02:51 AM on 11 September 2024How mismanagement, not wind and solar energy, causes blackouts
David-acct:
As we have previously discussed here:
"This example proves beyond doubt that examining cherry picked factoids without any analysis is a complete waste of time. Please do not cite raw data any more. You need to cite analysis of data that filter out gross errors.:" (my emphasis)
Citing the raw EIA data is simply a waste of everyones time. Your factoid that wind was low in Texas in February, 2021 does not prove anything.
As I have repeatedly cited for you, Jacobson et al 2022 has studied this period of time. He finds with his analysis of the data that a completely renewable energy system would be able to fulfill all energy needs nationwide during the period of time you have picked out. If you want to argue that renewable energy cannot supply all required energy you must provide a peer reviewed analysis of the data showing that Jacobson is incorrect. Many other energy researchers have found that completely renewable energy systems can provide all required energy 100% of the time.
I note that all Jacobson's modeling and weather data are posted on line so that anyone can easily check the time period that you refer to. There are scientists who disagree with Jacobson who presumably use the data to check Jacobsons work. Since they have not suggested any time world wide where the weather was so anomalous that Jacobson was incorrect the conclusion is that his model is accurate.
In the current fossil system hydro power is stored to use for peak production every day since nuclear and other baseload plants cannot fulfil peak requirements and require immense storage daily. In a renewable system, hydro will be saved for times when wind and/or solar production is low. This alone would cover a lot of low wind for several weeks. Other storage like batteries will cover the rest.
I have proven that your cherry picked factoids and raw data are incorrectly analyzed. You are wasting our time with your raw data. Spend more time reading the peer reviewed literature and less on denier websites.
-
David-acct at 21:55 PM on 10 September 2024How mismanagement, not wind and solar energy, causes blackouts
sorry forgot to attached the link
Always best to provide the raw data for study


