


 Arguments


 (Photo credit: Pearl Marvell. Image credit: Samantha Harrington. Dollar bill vector image:
 Igrew up knowing that when you had extra money, you put it under a bed, stashed it in a book or a clock, or, if there was enough of it, it went into a savings account at a bank.
It hadn’t occurred to me that my bank account could be contributing to the climate crisis until I learned that since the adoption of the Paris agreement in 2015, 60 of the world’s largest banks have invested $5.5 trillion into the fossil fuel industry. And they’re using our money to do it.
When we deposit our paychecks, the money doesn’t just sit there. Generally, banking institutions will use our money for investments and loans to other individuals and businesses, including fossil fuel companies.
So I realized that one of the levers that I could pull to fight climate change would be to take my money out of banks that invest in fossil fuels. And I could use my skills as a journalist to figure out where to put my money instead.
One thing I learned in my research: It’s no surprise that I didn’t know my bank could be using my money for fossil fuel investments.
“I worked in financial services, and I didn’t even know where my money was going,” said Yejide Olutosin, director of the Business Climate Finance Initiative at Impact Experience, an organization that works with companies to assess their carbon footprint and find ways to reduce it. “So you imagine just the everyday person with the everyday chores and family and obligations. They don’t have the time.”
Sabin 33 #25 - Are wind projects hurting farmers and rural communities?
Posted on 22 April 2025 by Ken Rice
On November 1, 2024 we announced the publication of 33 rebuttals based on the report "Rebutting 33 False Claims About Solar, Wind, and Electric Vehicles" written by Matthew Eisenson, Jacob Elkin, Andy Fitch, Matthew Ard, Kaya Sittinger & Samuel Lavine and published by the Sabin Center for Climate Change Law at Columbia Law School in 2024. Below is the blog post version of rebuttal #25 based on Sabin's report.
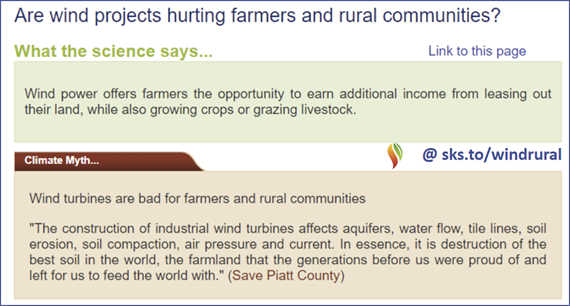
Wind power offers farmers the opportunity to earn additional income from leasing out their land, while also growing crops or grazing livestock.1 As a result, many farmers view wind turbines as beneficial for their farmland and the local community (Holstead et al. 2016, Mills 2018). And wind farms leave ample space for continued agricultural use: the National Renewable Energy Laboratory estimates that about 98% of the area in a typical wind farm is available for agriculture or other uses.2 The New York Farm Bureau has stated that "[w]ind turbines are geared towards continued farming activities, because wind turbines are typically spaced one acre apart."3 Moreover, "[l]ivestock are unaffected by the presence of wind turbines and will graze right up to the base of wind turbines."4
The additional income from lease payments can help farmers keep their land in production1 (also Holstead et al. 2016, Mills 2018). One 2017 University of Michigan study found that farmers with turbines tend to invest twice as much in their farms as farmers without wind turbines (Mills 2018). In addition, property tax payments from utility-scale wind projects provide revenue to rural communities for investing in schools, roads, and bridges.1
Farmers with turbines also appear more confident that they will continue to own their farms at the time of death. In the University of Michigan study, survey results showed 80% of those with turbines had a plan of succession for their farm, while only 62% of those without a turbine had a succession plan (Mills 2018). The researchers concluded that this difference was likely due to added income the wind turbine provided.
Wind farms can likewise contribute to agricultural productivity. A 2019 study of Gobi Desert wind farms, from China’s Zhejiang University, found that turbine proximity made local vegetation "more metabolically efficient, with higher community coverage, density, and AGB [aboveground biomass]."(Xu et al. 2019) Recent research from Iowa State’s Agronomy department posits that related benefits to agricultural yields might stem from increased photosynthesis capacity as turbines draw additional carbon dioxide out of the soil.5 Further studies suggest that wind turbines may even increase crop yields on neighboring farms, by minimizing harmful temperature extremes in the surrounding area (Kaffine 2019). Moreover, while recognizing that wind farm installation can contribute to short-term soil degradation, a 2020 analysis from Brazil’s Universidade Federal do Ceará concluded that these installations produce impacts less intense than those "caused by agricultural use and rainfall in the same period" and that local farmers found it possible "to reconcile agriculture and wind power generation without major repercussions on rural lots."(Sobrinho Junior et al. 2020)
A worse-than-current-policy world?
Posted on 21 April 2025 by Zeke Hausfather
This is a re-post from The Climate Brink
The world has made real progress toward tacking climate change in recent years, with spending on clean energy technologies skyrocketing from hundreds of billions to trillions of dollars globally over the past decade, and global CO2 emissions plateauing.
This has contributed to a reassessment of likely climate outcomes this century, with the world now likely heading toward less than 3C warming by 2100 under current policies – compared to the 4C warming that seemed more plausible 15 years ago.1
However, it is important to emphasize that current policies are neither a ceiling nor a floor on future emissions. While I hope that recent trends in declining clean energy cost, rapid deployment, and stronger climate policy trends accelerate in the coming decades, it is by no means assured.
Below the surface of cautious optimism lurks a much darker potential future, one where clean energy is curtailed not by a lack of human ingenuity but by misguided policy that priorities and subsidizes domestic fossil energy resources while closing us off from the rest of the world.
Enter SSP3
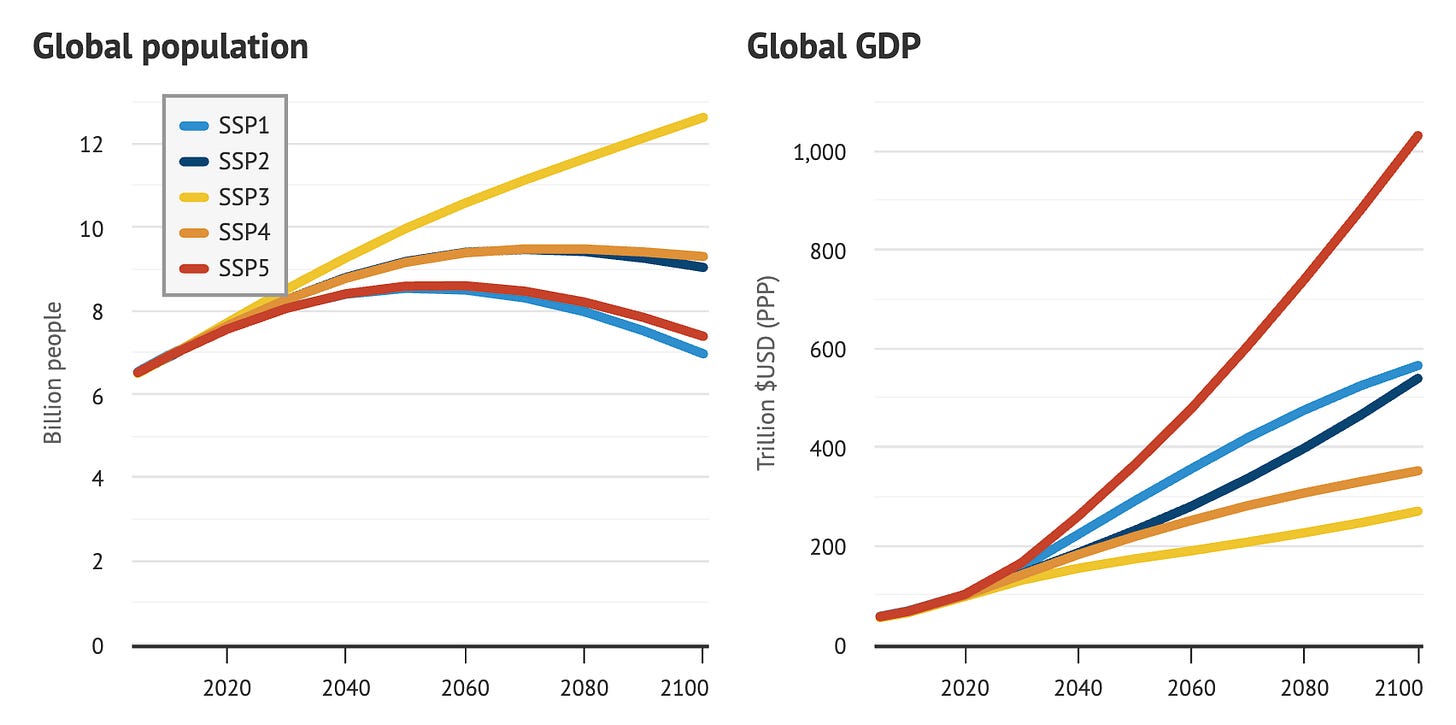
Back in 2016, the global energy modeling community set out to explore a set of socioeconomic futures that could shape the 21st century, impacting both our emissions and our ability to mitigate and adapt to climate change. They produced five different “Shared Socioeconomic Pathways”, or SSPs, that involved different underlying narratives of the future, levels of economic and population growth, and barriers to international cooperation and technological development.
2025 SkS Weekly Climate Change & Global Warming News Roundup #16
Posted on 20 April 2025 by BaerbelW, Doug Bostrom, John Hartz
This week's roundup is again published by category and sorted by number of articles included in each. The formatting is a bit different compared to previous weeks, though. We are still interested in feedback to hone the categorization, so if you spot any clear misses and/or have suggestions for additional categories, please let us know in the comments. Thanks!
Stories we promoted this week, by category:
Climate Policy and Politics (13 articles)
- EPA plans target climate change initiatives Environmental law experts say rollbacks will reverse advances in recent decades Nation & World, Harvard Gazette, Alvin Powell, Apr 14, 2024.
- ‘Deep Change Theory’ Could Pull Us Out of a Global Climate and Pollution Crisis, Scientists Say A new U.N. report maps a path toward a more sustainable future and challenges society to question basic assumptions and values about the environment, consumption and waste. Science, Inside Climate News, Bob Berwyn, Apr 10, 2025.
- As NOAA Cuts Continue, Ocean Researchers Worry About Monitoring Programs A global network of buoys that measure sea surface temperatures could be vulnerable because the U.S. funds about half the program. Inside Climate News, Bob Berwyn, Apr 11, 2025.
- New Trump Administration Directives to Repeal Environmental Regulations En Masse Make ‘No Sense,’ Legal Experts Say Experts in environmental and energy law said the effort “reflects a complete lack of understanding of how government works.” Politics, Inside Climate News, Kiley Bense, Apr 12, 2025.
- Barrage of news shows climate change policy is rapidly shifting under Trump administration Spending cuts and directives questioning the reality and urgency of climate change have marked quick shifts in U.S. science policy., Dinah Voyles Pulver, Apr 12, 2025.
- Environmental Groups Sue the Trump Administration to Restore Web Tools Critical for Gauging Climate and Pollution Impacts The removal of websites designed to help disadvantaged communities will hurt those communities the most, lawyers argue. Justice, & Health, Inside Climate News, Georgina Gustin, Apr 14, 2025.
- The drafters of the Clean Air Act saw CO2 as a pollutant Climate change and carbon dioxide came up regularly in ‘60s-era Congressional hearings, a team of Harvard historians has found. Audio, Yale Climate Communications, YCC Team, Apr 14, 2025.
- ‘Five-alarm fire’: Read the Trump proposal that could decimate climate research Weather, The San Francisco Chronicle, Anthony Edwards, Apr 15, 2025.
- Green groups sue Trump administration over climate webpage removals The White House has pulled federal webpages tracking climate and environmental justice data The Guardian, Dharna Noor, Apr 15, 2025.
- Climate science isn't giving your kid anxiety Trump's newest argument for defunding climate science is that it's giving kids anxiety. But that's not really why kids are upset. HEATED, Emily Atkin, Apr 16, 2025.
- Trump Administration Halts Construction on New York Offshore Wind Project Empire Wind 1’s developer says it is considering its legal remedies. New York, meanwhile, needs renewable energy projects to meet its climate goals and to ensure the continued growth of green job opportunities in the city. Clean Energy, Inside Climate News, Lauren Dalban, Apr 18, 2025.
- Trump May Target Environmental Nonprofits in Executive Orders Expected on Earth Day Environmental groups say they are preparing for the worst—and preparing to fight back. Politics, Inside Climate News, Marianne Lavelle & Lee Hedgepeth, Apr 18, 2025.
- Nonprofits Work to Fill the Climate Information Gap Left by Trump Cuts Newsweek, Jeff Young, Apr 18, 2025.
Fact brief - Is climate change a net benefit for society?
Posted on 19 April 2025 by Sue Bin Park
![]() Skeptical Science is partnering with Gigafact to produce fact briefs — bite-sized fact checks of trending claims. You can submit claims you think need checking via the tipline.
Skeptical Science is partnering with Gigafact to produce fact briefs — bite-sized fact checks of trending claims. You can submit claims you think need checking via the tipline.
Is climate change a net benefit for society?
 Human-caused climate change has been a net detriment to society as measured by loss of life, economic harm and ecosystem damage.
Between 2000 and 2019, climate change caused $2.86 trillion in damages from extreme weather like storms, floods, droughts, and wildfires. Nearly 61,000 net deaths were linked to climate change during this time.
Ocean acidification from CO2 emissions has degraded coral reefs, which provide trillions of dollars in ecosystem services annually by sustaining fisheries and protecting coasts.
Habitat loss from climate change has contributed to an extinction rate at least 100 times higher than pre-industrial times.
And while some regions have seen short-term agricultural benefits like longer growing seasons, climate change has negatively impacted overall crop output; one study estimated global productivity is 20% lower than it would have been without climate change.
As global temperatures continue to rise, these and other issues are projected to worsen.
Go to full rebuttal on Skeptical Science or to the fact brief on Gigafact
This fact brief is responsive to quotes such as the one in this video.
Sources
Nature The global costs of extreme weather that are attributable to climate change
World Economic Forum Climate change is costing the world $16 million per hour: study
Energy & Climate Intelligence Unit Climate economics - costs and benefits
WHO Climate change
NOAA Are there positive benefits from global warming?
NASA Vanishing Corals: NASA Data Helps Track Coral Reefs
MIT Science Policy Review Coral reefs are critical for our food supply, tourism, and ocean health. We can protect them from climate change
Science Advances Accelerated modern human–induced species losses: Entering the sixth mass extinction
Cornell University Report: Warmer planet will trigger increased farm losses
Skeptical Science New Research for Week #16 2025
Posted on 17 April 2025 by Doug Bostrom, Marc Kodack
Open access notables
Recent intensified riverine CO2 emission across the Northern Hemisphere permafrost region, Mu et al., Nature Communications:
Global warming causes permafrost thawing, transferring large amounts of soil carbon into rivers, which inevitably accelerates riverine CO2 release. However, temporally and spatially explicit variations of riverine CO2 emissions remain unclear, limiting the assessment of land carbon-climate feedback. Using new and published 5685 riverine CO2 partial pressure data in the Arctic and Tibetan Plateau, we show that current riverine CO2 emission across the Northern Hemisphere permafrost zone is 200 ± 15 Tg C yr?1. The emission offsets 28.1 ± 2.1% of the land carbon uptake in the Northern Hemisphere permafrost zone, with large regional variability of 13.1 to 63.1%. Our findings suggest that CO2 emissions increased at a rate of 0.42 ± 0.16 Tg C yr?1 during 2000 to 2020, and this is primarily driven by increased precipitation and accelerated permafrost thawing under climate change. This study highlights increased riverine carbon emission and strengthening of the permafrost carbon feedback to climate after incorporating carbon release from rivers.
Increasing Synchrony of Extreme Heat and Precipitation Events Under Climate Warming, Tang et al., Geophysical Research Letters:
Extreme weather events severely impact human and natural systems, and their impacts would be exacerbated when events occur synchronously. Extensive studies have examined changes in individual events under global warming, but changes in the synchrony of multiple events remain less understood. Here we quantify the synchrony of extreme heat and precipitation events over global land areas and assess how it responds to climate change. We show regional disparities with stronger synchrony in lower latitudes and weaker in middle latitudes. Since the 1980s, the synchrony has increased by 34%, especially in the tropics and northern high latitudes. Climate simulations project an 87% increase by 2100 under Shared Socioeconomic Pathway (SSP) 5–8.5 relative to historical level, while low-emission scenarios (SSP1-2.6 and SSP2-4.5) can help mitigate the increased risk of synchronous events. Increasing synchrony is primarily driven by climate warming, and this scaling relationship depends on global warming level rather warming path.
Climate Change Increases Energy Demand and Cost in Texas, Dessler, Weather, Climate, and Society:
This study focuses on the Electric Reliability Council of Texas (ERCOT) electricity market in Texas and demonstrates how the increase in temperature due to climate change is already driving large increases in electricity demand and total electricity costs. Results show that, compared to a 1950–80 baseline climate, electricity demand in 2023 was 1.9 GW (3.9%) higher because of the extreme temperatures of that year—climate change contributed 47% of this increase, with the rest coming from short-term climate variability. As demand increases, so does the price per unit of electricity, so consumers are hit double: They must buy more electricity, and each unit of electricity costs more. Using data from the wholesale market, we estimate that the total cost of electricity (the combination of higher demand and higher per unit prices) increased by $7.6B in 2023 compared to the baseline climate, $290 per ERCOT customer, with most of this increase occurring during the summer. Climate change contributed about 29% of this ($2.2B, $83 per customer), while short-term variability contributed the rest. About two-thirds of this increase is due to price increases triggered when the ERCOT grid becomes constrained. Investments in increasing the power supply or the ability to transmit it across the state, or reducing demand (e.g., demand response), could substantially reduce the impact of increasing temperature on the cost of electricity in Texas.
From this week's government/NGP section:
Preliminary Results of the Automated Detection of Climate Misinformation in French Television and Radio, Data for Good, Quota Climat, and Science Feedback
The authors lay the foundational groundwork for the international initiative on the automated detection of climate disinformation, known as “Climate Safeguards." The results presented here were initially generated using a preliminary AI-based method and subsequently validated manually. As such, they do not yet reflect the full accuracy or capabilities of the more advanced models and methods currently under development. Over a three-month broadcasting period, 128 instances of climate disinformation were detected - equivalent to roughly 10 cases per week. This challenges the common belief that disinformation is confined to social media, revealing that traditional media are now significantly affected by climate disinformation. This trend is particularly concerning given the continued high level of trust in traditional news media. It increases the risk of normalizing misleading narratives, blurring the line between fact and opinion, and ultimately weakening the e foundations of our democratic society.
Status of Environment and Climate in Ukraine, Belis et al, European Commission
The authors provide an overall picture of the status of the environment and climate - air quality, emissions of air pollutants and greenhouse gases - (GHG), forests, soil, and marine environment in Ukraine. The analysis is based on available studies. The ongoing conflict between Russia and Ukraine has exacerbated pre-existing challenges related to environmental monitoring and the enforcement of environmental regulations, further complicating this assessment. The information summarised by the authors provides for the first time the basis for assessing the impact of war on Ukraine's specific environment and climate, including relevant elements for the country's reconstruction.
110 articles in 55 journals by 744 contributing authors
Physical science of climate change, effects
Highly resolved satellite-remote-sensing-based land-use-change inventory yields weaker surface-albedo-induced global cooling, Jian et al., Atmospheric Chemistry and Physics Open Access 10.5194/acp-25-4251-2025
Internal Wind Driven Ocean Circulation Variability Delays the Time of Emergence of Externally Forced Sea Surface Temperature Trends, Larson & McMonigal, Geophysical Research Letters Open Access 10.1029/2024gl111878
On the movement of atmospheric blocking systems and the associated temperature responses, , Journal of Development and Social Sciences Open Access pdf 10.47205/jdss.2021(2-iv)74
Climate Adam: Climate Scientist Reacts to Elon Musk
Posted on 16 April 2025 by Guest Author
This video includes personal musings and conclusions of the creator climate scientist Dr. Adam Levy. It is presented to our readers as an informed perspective. Please see video description for references (if any).
From "founder" of Tesla and the OG rocket man with SpaceX, and rebranding twitter as X, Musk has made a name for himself... partly as climate champion. But as his actions and words become increasingly friendly toward Donald Trump and global fascist ideas, can he still be held up as a climate expert? I take back a look at how Musk's climate speech has changed over the past decade - what's stayed the same, and what has fundamentally changed.
Support ClimateAdam on patreon: https://patreon.com/climateadam
Sabin 33 #24 - Is wind power too expensive?
Posted on 15 April 2025 by Ken Rice
On November 1, 2024 we announced the publication of 33 rebuttals based on the report "Rebutting 33 False Claims About Solar, Wind, and Electric Vehicles" written by Matthew Eisenson, Jacob Elkin, Andy Fitch, Matthew Ard, Kaya Sittinger & Samuel Lavine and published by the Sabin Center for Climate Change Law at Columbia Law School in 2024. Below is the blog post version of rebuttal #24 based on Sabin's report.
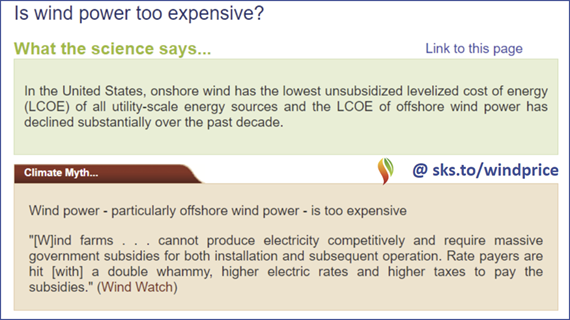
In the United States, onshore wind has the lowest unsubsidized levelized cost of energy (LCOE) of all utility-scale energy sources. Onshore wind’s mean unsubsidized LCOE is $50/MWh, substantially lower than the mean unsubsidized LCOE of gas combined cycle ($70/MWh), coal ($117/MWh), and gas peaking ($168/MWh)1. And, as the figure below from Lazard shows, although offshore wind power is more expensive than gas combined cycle when subsidies are not taken into account, the unsubsidized mean LCOE for offshore wind ($106) is still lower than that of gas peaking and coal.1
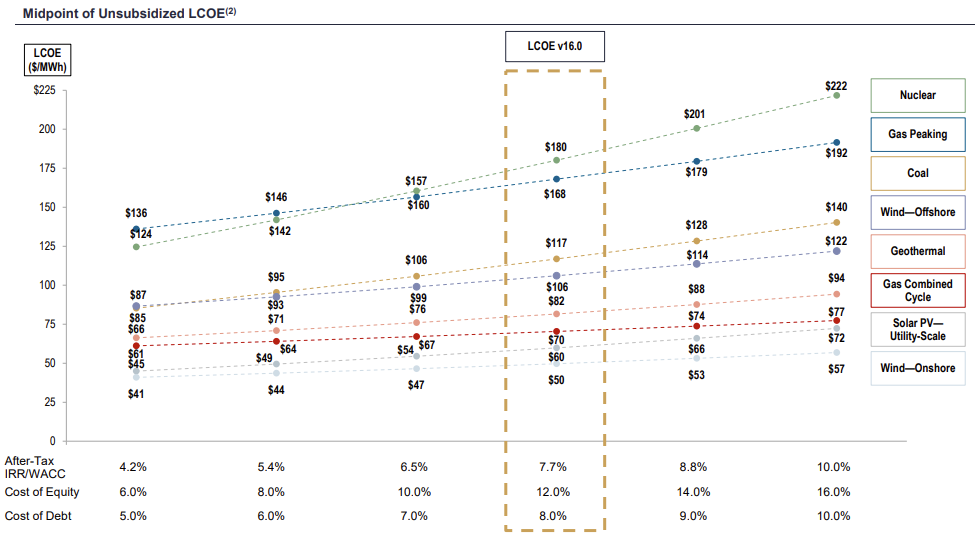
Figure 1: The range of unsubsidized LCOE for utility-scale energy sources across various cost of capital scenarios, highlighting the mean unsubsidized LCOE as of April 2023. “IRR” stands for “internal rate of return” and “WACC” stands for “weighted average cost of capital.” Source: Lazard (Reproduced with permission)1.
In addition, the LCOE for offshore wind power has declined substantially over the past decade2 (also Wiser et al. 2021). The Department of Energy’s most recent offshore wind market report estimates that the LCOE for a fixed-bottom offshore wind project beginning operations in 2022 would have been roughly 50% lower than one beginning operations in 2014, despite a 6% increase in costs compared to a 2021 cost estimate. Researchers further project that the average LCOE for offshore wind energy will fall to $63/MWh by 2030.2
Due in large part to this dramatic price decline, deployment of offshore wind has surged in recent years, both domestically and globally. By the end of 2022, global capacity had reached 59,009 MW, up roughly 18% from 2021.3 As of the end of May 2023, the pipeline of U.S. offshore wind projects in development and operation was estimated to represent 52,687 MW of wind energy capacity, a 15% growth compared to May 2022.2 It bears noting, however, that several offshore wind projects have been removed from the U.S. offshore wind pipeline since May 2023 as a result of project cancellation.4 This includes Ocean Wind I and II, canceled in October 2023, which were anticipated to deliver over 2,200 MW of wind energy capacity.5
Once operational, offshore wind turbines generate more energy and greater revenues than onshore wind farms, due to higher and steadier wind speeds; they also have the advantage of generating energy closer to many U.S. coastal population centers, thus reducing the need for long-distance transmission.6 According to the European Wind Energy Association, while the average onshore wind turbine generates enough energy to power 1,500 homes, the average offshore turbine can power more than 3,300 homes. Moreover, when factoring in costs associated with climate change and human health impacts, offshore wind becomes even less expensive compared to many fossil fuel energy sources.7
EGU2025 - Picking and chosing sessions to attend on site in Vienna
Posted on 14 April 2025 by BaerbelW
This year's General Assembly of the European Geosciences Union (EGU) will take place as a fully hybrid conference in both Vienna and online from April 27 to May 2. This year, I'll join the event on site in Vienna for the full week and I've already picked several sessions I plan to attend. Among them are two sessions, I'll be presenting in. This blog post provides an overview of my itinerary.

Monday
To start my week at EGU25, I plan to attend a Union Symposia (US5) at 8:30am: Bridging Policy and Science for EU Disaster Preparedness
One of the greatest risks to our security is the impact of climate change. Extreme weather continues to ravage ever greater areas of Europe through floods, fires and droughts, throughout the year and across the European Union. The EU's new strategic agenda for 2024-2029 states that it will strengthen its resilience, preparedness, crisis prevention and response capacities in an all-hazards and whole-of-society approach to protect its citizens and societies against different crises, including disasters.
The EU funds research & innovation through Horizon Europe projects but also with multiple other instruments and channels. The needs of the EU, reflecting those of its Member States, for scientific output to address and support disaster risk reduction policy, prevention & preparedness capacity-building, and emergency operations are continuous. These gaps are reflected in policy or operational documentation, such as the political guidelines for the next European Commission 2024-2029 and the Union's Disaster Resilience Goals. Among others, we should look at all facets of crisis and disaster management, along community resilience building.
This session aims to create a dialogue between EU-wide policy-based scientific needs for Disaster Resilience and the scientific community of the EGU. It will inform the scientific community how to interpret the latest policy documentation in orienting their research and funnel their planning and output back to the EU's needs to have an impact and added value for society. The European Commission will be represented by the DG for European Civil Protection and Humanitarian Aid Operations as well as DG Joint Research Centre.
After US5 and the coffee break, I plan to join EOS2.1 at 10:45am: Open session on Teaching and Learning in Higher Education which might provide some wide-ranging food for thought about how to effectively communicate science topics.
2025 SkS Weekly Climate Change & Global Warming News Roundup #15
Posted on 13 April 2025 by BaerbelW, Doug Bostrom, John Hartz
This week's roundup is again published by category and sorted by number of articles included in each. The formatting is a bit different compared to previous weeks, though. We are still interested in feedback to hone the categorization, so if you spot any clear misses and/or have suggestions for additional categories, please let us know in the comments. Thanks!
Stories we promoted this week, by category:
Climate Policy and Politics (11 articles)
- Do Climate Goals Matter in a Bad Economy? Climate, Time Magazine, Justin Worland, Apr 4, 2025.
- We passed the 1.5C climate threshold. We must now explore extreme options We do not have the luxury of rejecting solutions before we have thoroughly investigated their risks, trade-offs and feasibility Comment is Free, The Guardian, Opinion by David King, Apr 7, 2025.
- Trump’s new goal: Revive a major climate pollutant that power markets have turned against But even coal-friendly Republicans and executives say it won’t revive the industry to its former glory. Politico, Josh Siegel, Catherine Morehouse &Alex Guillén, Apr 8, 2025.
- Funding for National Climate Assessment Is Cut The move raises concerns among scientists that the assessment, which is required by Congress, is now in jeopardy. NYT, Brad Plumer, Apr 09, 2025.
- Trump Administration Cuts Research Funding, Claiming It Creates ‘Climate Anxiety’ The cuts to a Princeton University program come as the Trump administration has been reviewing an array of research grants related to global warming. Climate, New York Times, &Brad Plumer and Austyn Gaffney, Apr 9, 2025.
- Trump issues order to block state climate change policieshttps://www.reuters.com/sustainability/climate-energy/trump-issues-order-block-state-climate-change-policies-2025-04-09/ Sustainability, Reuters, Nichola Groom, Apr 9, 2025.
- White House ends funding for key US climate body: ‘No coming back from this’ NASA cuts contract that convened USGCRP, which released assessments impacting environmental decision-making US News, The Guardian, Dharna Noor & Gabrielle Canon, Apr 9, 2025.
- Will global climate action be a casualty of Trump’s tariffs? New warnings from financial firms and insurers point to a future defined by profound risks to the global economy from heat, storms and other disasters. Climate Forward, David Gelles, Apr 10, 2025.
- Trump’s EPA Plans to Stop Collecting Greenhouse Gas Emissions Data From Most Polluters Climate experts expressed shock and dismay at the move. “It would be a bit like unplugging the equipment that monitors the vital signs of a patient that is critically ill,” one said. Trump Administration, ProPublica, Sharon Lerner, Apr 10, 2025.
- Trump’s actions are already having consequences for climate, especially for the IPCC CarbonNews, Kevin Trenberth, Apr 11, 2025.
- Trump’s budget plan eviscerates weather and climate research, and it could be enacted immediately CNN Climate, Ella Nilsen, Apr 11, 2025.
Fact brief - Is the sun responsible for global warming?
Posted on 12 April 2025 by Sue Bin Park
![]() Skeptical Science is partnering with Gigafact to produce fact briefs — bite-sized fact checks of trending claims. You can submit claims you think need checking via the tipline.
Skeptical Science is partnering with Gigafact to produce fact briefs — bite-sized fact checks of trending claims. You can submit claims you think need checking via the tipline.
Is the sun responsible for global warming?
Greenhouse gas emissions from human activities, not solar variability, is responsible for the global warming observed since the Industrial Revolution.
Cyclical variations in Earth’s orbit and changes in the amount of energy released by the sun have caused gradual climatic changes over tens of thousands of years. However, total solar activity has been decreasing since the 1980s.
Meanwhile, global average temperatures have been rising at an accelerating rate. The ten hottest years on record were the most recent ten while 2024 was the hottest on record. The last time Earth experienced a cooler-than-average year was 1976.
In 2021, a report by the Intergovernmental Panel on Climate Change concluded that solar fluctuations accounted for around 1% of the 1.1°C (2°F) of total global warming since 1850. The panel identified heat-trapping greenhouse gas emissions from fossil fuel use and other human activities as the primary driver.
Go to full rebuttal on Skeptical Science or to the fact brief on Gigafact
This fact brief is responsive to quotes such as the one highlighted here.
Sources
Skeptical Science Solar vs Temperature
NASA What Is the Sun’s Role in Climate Change?
NOAA Couldn't the Sun be the cause of global warming?
NOAA Climate Change: Incoming Sunlight
NOAA 2024 was the world’s warmest year on record
NASA The Causes of Climate Change
IPCC AR6 Summary for Policymakers
Skeptical Science New Research for Week #15 2025
Posted on 10 April 2025 by Doug Bostrom, Marc Kodack
Open access notables
Global and regional drivers for exceptional climate extremes in 2023-2024: beyond the new normal, Minobe et al., npj Climate and Atmospheric Science:
Climate records have been broken with alarming regularity in recent years, but the events of 2023–2024 were exceptional even when accounting for recent climatic trends. Here we quantify these events across multiple variables and show how excess energy accumulation in the Earth system drove the exceptional conditions. Key factors were the positive decadal trend in Earth’s Energy Imbalance (EEI), persistent La Niña conditions beginning in 2020, and the switch to El Niño in 2023. Between 2022 and 2023, the heating from EEI was over 75% larger than during the onset of similar recent El Niño events. We show further how regional processes shaped distinct patterns of record-breaking sea surface temperatures in individual ocean basins. If the recent trend in EEI is maintained, we argue that natural fluctuations such as ENSO cycles will increasingly lead to amplified, record-breaking impacts, with 2023–2024 serving as a glimpse of future climate extremes.
Subglacial water amplifies Antarctic contributions to sea-level rise, Zhao et al., Nature Communications:
Antarctica’s contribution to global sea-level rise is deeply uncertain, with subglacial water suspected to play a critical role, yet its impact remains unclear. We demonstrate that water at the base of ice sheets influences sliding behaviour and that its exclusion from models can underestimate sea-level rise projections and delay the predicted onset of tipping points. Here we use an Antarctic Ice Sheet model (Elmer/Ice) to explore how different assumptions about water pressure at the ice base affect sea-level rise projections from 2015 to 2300. Our results indicate that incorporating subglacial water can amplify ice discharge across the Antarctic Ice Sheet by up to threefold above the standard approach, potentially contributing an additional 2.2 metres to sea-level rise by 2300. Notably, a smoothly decreasing basal drag near the grounding line more than doubles grounding line flux by 2300 relative to scenarios where effective pressure is simplified into a spatially constant coefficient. Basin-specific responses vary significantly, with some scenarios advancing tipping points by up to 40 years. These findings underscore the critical need to integrate evolving subglacial hydrology into ice sheet models.
The net ecosystem carbon balance (NECB) at catchment scales in the Arctic, López-Blanco et al., Frontiers in Environmental Science:
The Net Ecosystem Carbon Balance (NECB) is a crucial metric for understanding integrated carbon dynamics in Arctic and boreal regions, which are vital to the global carbon cycle. These areas are associated with significant uncertainties and rapid climate change, potentially leading to unpredictable alterations in carbon dynamics. This mini-review examines key components of NECB, including carbon sequestration, methane emissions, lateral carbon transport, herbivore interactions, and disturbances, while integrating insights from recent permafrost region greenhouse gas budget syntheses. We emphasize the need for a holistic approach to quantify the NECB, incorporating all components and their uncertainties. The review highlights recent methodological advances in flux measurements, including improvements in eddy covariance and automatic chamber techniques, as well as progress in modeling approaches and data assimilation. Key research priorities are identified, such as improving the representation of inland waters in process-based models, expanding monitoring networks, and enhancing integration of long-term field observations with modeling approaches. These efforts are essential for accurately quantifying current and future greenhouse gas budgets in rapidly changing northern landscapes, ultimately informing more effective climate change mitigation strategies and ecosystem management practices. The review aligns with the goals of the Arctic Monitoring and Assessment Program (AMAP) and Conservation of Arctic Flora and Fauna (CAFF), providing important insights for policymakers, researchers, and stakeholders working to understand and protect these sensitive ecosystems.
Effects of ocean alkalinity enhancement on plankton in the Equatorial Pacific, Guo et al., Communications Earth & Environment:
Ocean alkalinity enhancement is a potential strategy for gigatonne-scale atmospheric carbon dioxide removal. It uses alkaline substances to convert seawater carbon dioxide into (bi)carbonate, enabling uptake of additional carbon dioxide from the atmosphere. A critical knowledge gap is how ocean alkalinity enhancement could influence marine plankton communities. Here we conducted 19 ship-based experiments in the Equatorial Pacific, examining three prevalent alkaline substances (sodium hydroxide, olivine, and steel slag) and their effects on natural phytoplankton populations under realistic and moderate alkalinity enhancements (16–29 μmol kg−1). Results demonstrate that sodium hydroxide had a negligible effect on phytoplankton while providing predictable alkalinity. Conversely, olivine disrupted plankton, especially cyanobacteria, heterotrophic bacteria, and picoeukaryotes while only providing 0.06 mmol alkalinity g−1 olivine. Steel slag moderately changed phytoplankton communities and fertilized growth while delivering 8 mmol alkalinity g−1 slag. Our study helps to determine which alkaline substance could be suitable for application in the Equatorial Pacific.
The gaze from afar: climate action despite the loss of hope, Cassegård et al., Environmental Politics:
Regarding climate change, catastrophic developments are already ongoing. This does not eliminate the hope that meaningful climate action is possible but can lead to other emotions and emotive-cognitive orientations becoming more central in motivating collective action. We argue for the crucial role of a ‘gaze from afar’, which can validate action even without hope of averting catastrophe. Such a gaze breaks with the conventional model of empathic role-taking by judging one’s present actions from the point of view of a distant other. This paper draws on a project on post-apocalyptic environmental activism to illuminate two different variants of the gaze from afar: that of people who do not share our present and that of non-human others. In each case the gaze helps propel a heightened degree of moral reflexivity and existential responsibility that can motivate collective action in the midst of ongoing catastrophe.
From this week's government/NGO section:
Extraordinary March heatwave in Central Asia up to 10°C hotter in a warming climate, Clarke et al., World Weather Attribution
In March 2025, Central Asia experienced an unusually intense heatwave, with temperatures reaching record highs across the region, reaching maxima of 30.8°C Jalalabad in Kyrgyzstan, 29.4°C Namangan, 29.1°C Fergana, in Uzbekistan and minimum temperatures of 18.3°C in Shahdara, making it the hottest March night in Kazakhstan’s history. When combining the observation-based analysis with climate models, to quantify the role of climate change in this 5-day heat event, the authors found that climate models underestimate the increase in heat found in observations. In particular, all observations show a particular increase in March maximum and minimum temperatures in recent years that is much stronger than in all other months and not represented in the climate models. The authors can thus only give a conservative estimate of the influence of human-induced climate change. Based on the combined analysis they conclude that climate change made the extreme heat about 4 °C hotter and about 3 times more likely.
Hunting Methane Using Satellites: A Guide for Policymakers, Shukla et al., The Center for Law, Energy & the Environment, University of California, Berkeley and The Emmett Institute on Climate Change and the Environment, University of California, Los Angeles
Methane is a powerful greenhouse gas, over 80 times more potent than carbon dioxide in the short term. Reducing methane emissions is one of the fastest ways to slow global warming, but tracking sources and enforcing reductions has long been a challenge—until now. Thanks to a new generation of space-based instruments, satellites can detect methane leaks in real time, offering unprecedented transparency and accountability. The authors explain how policymakers can harness satellite data to improve climate policies, enforce emissions regulations, and accelerate methane reduction efforts. They provide a roadmap for integrating these technologies into decision-making, offering practical recommendations for governments, regulators, and industry leaders.
170 articles in 61 journals by 1088 contributing authors
Physical science of climate change, effects
Changes in the Regional Water Cycle and Their Impact on Societies, Lambert et al., WIREs Climate Change Open Access 10.1002/wcc.70005
Changes of atmospheric warming associated with rapid sea ice loss events on the synoptic time scale in winter, Hu et al., Atmospheric Research 10.1016/j.atmosres.2025.108129
Renewables allow us to pay less, not twice
Posted on 9 April 2025 by Guest Author
This is a re-post from The Electrotech Revolution by Daan Walter
Last week, UK Conservative Party leader Kemi Badenoch took the stage to advocate for slowing the rollout of renewables, arguing that they ultimately lead to higher costs:
“Huge amounts are being spent on switching round how we distribute electricity because we must effectively build two systems of electricity generation – one based on renewables and one not. One for when the sun shines and the wind blows. And one for when they don’t.” [i]
At first glance, this argument seems intuitive—and therefore persuasive: if we need to build two separate power generation systems, it must be more expensive. But this logic is fundamentally flawed. It conflates upfront capital expenditure with total system costs, focusing narrowly on installation expenses while ignoring the costs of purchasing fuel to run fossil power plants. This is a common misunderstanding in the energy transition debate today—we call it the "double cost fallacy.” It's time we move past it.
To illustrate where this line of thinking goes wrong, let’s examine a simple, stylized example. Imagine we get granted a large plot of land and 1 GW grid connection that we need to supply with power all 8,760 hours per year, for 25 years. Our task is to find a cheap, reliable way to do this. We’ll set our scene in the south of the UK, exclude local carbon taxes to focus purely on economics, and use some standard cost assumptions for power generation technology, largely from the UK's DESNZ (detailed assumptions at the bottom of the article).[ii]
As we'll see, we can supply 70% of this power with solar energy without any additional cost compared to just operating a gas plant. Interestingly—and perhaps counterintuitively—the total cost of running a 1 GW gas plant continuously is actually higher than building a combined system of 1 GW gas, 6.5 GW solar, and 12 GWh of battery storage.
We will build out this case in this article—but if you want to jump ahead and play around with this hypothetical setup yourself, you can do so with this simple webtool.
The gas case
Let’s start with a baseline. We can consider just building a 1 GW gas power plant to deliver our 1 GW baseload. You’ll get the very boring result below: 100% gas generation all year round. This solution has a total cost of approximately £76/MWh. Remember that number as we’ll refer to this later as benchmark.
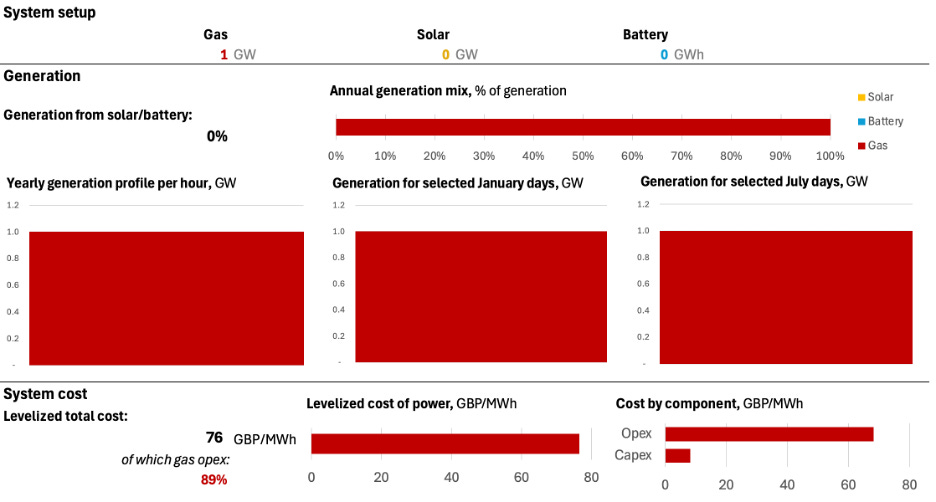
Source: DESNZ; NREL; Renewables.ninja; author’s analysis
Sabin 33 #23 - How much land is used for wind turbines?
Posted on 8 April 2025 by Ken Rice
On November 1, 2024 we announced the publication of 33 rebuttals based on the report "Rebutting 33 False Claims About Solar, Wind, and Electric Vehicles" written by Matthew Eisenson, Jacob Elkin, Andy Fitch, Matthew Ard, Kaya Sittinger & Samuel Lavine and published by the Sabin Center for Climate Change Law at Columbia Law School in 2024. Below is the blog post version of rebuttal #23 based on Sabin's report.
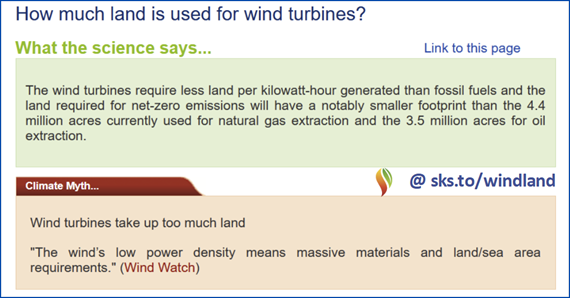
Princeton University’s 2021 report, Net-Zero America, concluded that the wind turbines needed for the United States to reach net-zero emissions by 2050 will have a direct footprint (i.e., the area covered by turbine bases and access roads) of between 603,678 and 2,479,208 acres.1 This is notably less than the 4.4 million acres currently used for natural gas extraction and the 3.5 million acres for oil extraction.2
Some analyses significantly overstate the amount of land required for wind energy, either by including the unused space between turbines or by using a metric called the visual footprint that measures the area from which turbines are visible. As Amory Lovins has stated, “Saying that wind turbines ‘use’ the land between them is like saying that the lampposts in a parking lot have the same area as the parking lot: in fact, about 99 percent of its area remains available to drive, park, and walk in.” (Lovins 2011) When a wind turbine is sited on farmland, it typically uses only about 5% of the project area, leaving the rest available for agriculture and other purposes.3
Moreover, depending on the location and the technology used, wind turbines can also require less land per kilowatt-hour generated than fossil fuels. A report by the United Nations Economic Commission for Europe (UNECE) found that total land occupation (agriculture and urban) for wind power ranged from 0.3–1 m2/KWh for 2022. The exact value depends on the type of wind tower, onshore or offshore siting, and the particular location of the turbine. By comparison, natural gas values ranged from 0.6–3.3 m2/KWh, and coal values from 7.2–23.8 m2/KWh. The UNECE report notes that these calculations do not include carbon capture and storage (CCS), which, if implemented, would decrease emissions but increase land use.4
Wind energy also uses far less land than biomass. Dedicated biomass consumes an average of 160,000 hectares of land per terawatt-hour per year. By contrast, the land-use intensity of wind energy is only 170 hectares per terawatt-hour per year when looking at the direct footprint of wind or 15,000 hectares per terawatt-hour per year when including space between turbines (Lovering et al. 2022).
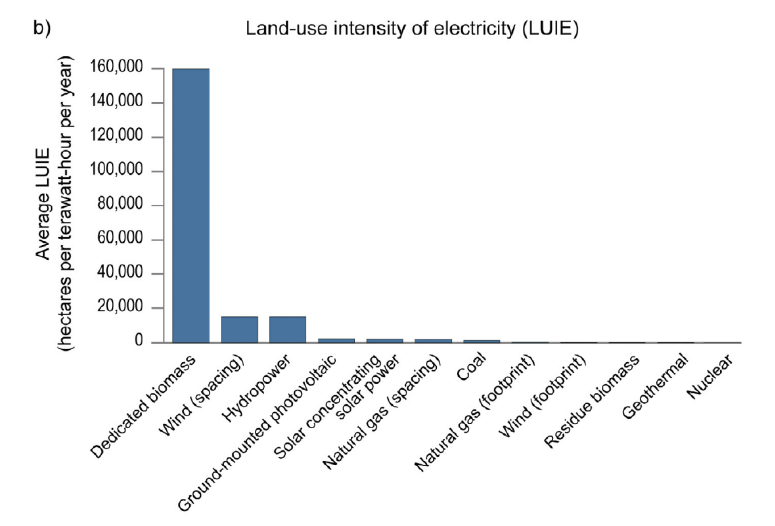
Figure 1: Average land-use intensity of electricity, measured in hectares per terawatt-hour per year. Source: U.S. Global Change Research Program (visualizing data from Lovering et al. 2022).
Fossil fuel generation also has more harmful and enduring impacts on the land that it uses. Spills frequently occur as a result of the extraction, transportation, and distribution of oil and natural gas, causing soil and water damage. A 2017 study found that between 2% and 16% of unconventional oil and gas wells reported a spill each year, with more spills in some states than others (Patterson et al. 2017). Reclamation is difficult in areas surrounding extraction sites because of frequent leakage (Allred et al. 2015). The land involved often suffers long-term damage and can only be used for limited purposes. Moreover, abandoned coal mines and orphaned oil and gas wells can continue to threaten public health by contaminating groundwater, emitting methane and other noxious gases, and, in the case of abandoned coal strip mines, even result in continuing risk from falling boulders.5 There are currently over 130,000 documented orphaned oil and gas wells in the United States6; in one state, Kentucky, nearly 40% of purportedly “active” coal mines are “functionally abandoned.”5
By contrast, utility-scale wind farms can be incorporated into America’s pasture and cropland with significantly less disturbance. Wind farms directly occupy relatively small amounts of land. According to the Department of Energy, powering 35% of our national electric grid through wind turbines would require 3,200 km2 (790,000 acres) of land, a small fraction of the United States’ 2.3 billion acres of land.7 Furthermore, there is ample space for additional land uses within wind farms: the National Renewable Energy Laboratory estimates that about 98% of the area in a wind farm is available for agriculture or other uses.8 Moreover, plant and animal species can safely grow and roam directly up to a turbine’s base. This can help native species to flourish, as well as allowing farmers to continue cultivating crops and grazing animals after wind projects are installed.9 And reclamation of wind (and solar) energy sites can begin as soon as plants begin operation, because wind and solar require only small amount of soil disturbance compared to other energy sources (Dhar et al. 2020).
Finally, climate change produced by burning fossil fuels directly harms forests, oceans, crops, and wildlife, including by causing wildfires, algal blooms, droughts, and extreme weather events that mar the visual landscape.10 Wind energy, in contrast, further protects local landscapes by mitigating climate impacts.
Our MOOC Denial101x has run its course
Posted on 7 April 2025 by BaerbelW
Many of you will know that in collaboration with the University of Queensland we created and ran the massive open online course (MOOC) "Denial101x - Making sense of climate science denial" on the edX platform. Within nine years - between April 2015 and February 2024 - we offered 15 runs of our MOOC, most of them long-running versions in self-paced mode but also a few delivered as shorter paced versions with new lectures starting on a weekly schedule.
Sharp-eyed observers may have noticed that there was no announcement made last year in February about a next run after the one started in 2023 ended. As the saying goes, "all good things must come to an end" and this is what happened last year when the university decided to no longer offer Denial101x on the edX-platform.

What Denial101x offered
Our MOOC took an interdisciplinary look at climate science denial. We explained the psychological drivers of denial, debunked many of the most common myths about climate change and explored the scientific research into how to respond to climate misinformation. With all the misinformation and outright lies still being repeated about climate science - not to mention many other topics in this age of fake news - our MOOC provided the knowledge to spot and the tools to effectively counter them.
2025 SkS Weekly Climate Change & Global Warming News Roundup #14
Posted on 6 April 2025 by BaerbelW, Doug Bostrom, John Hartz
This week's roundup is again published by category and sorted by number of articles included in each. The formatting is a bit different compared to previous weeks, though. We are still interested in feedback to hone the categorization, so if you spot any clear misses and/or have suggestions for additional categories, please let us know in the comments. Thanks!
Stories we promoted this week, by category:
Climate Change Impacts (18 articles)
- Mar 28, 2025: If sea levels are rising, why is the Maldives still above water?, Climate, Science Feedback , Rahul Rao.
- Mar 28, 2025: South Korea wildfires become biggest on record as disaster chief points to ‘harsh reality’ of climate crisis, World, The Gurdian, Justin McCurry & Agencies. Officials point to ultra-dry conditions as death toll reaches 27 and fires threaten Unesco heritage sites
- Mar 29, 2025: Losing Forest Carbon Stocks Could Put Climate Goals Out Of Reach, Eurasia Review, Staff.
- Mar 29, 2025: Japan faces 99 times more heatwaves if global warming intensifies, report warns, Southern China Morning Post, SCMP’s Asia Desk. A new report reveals global warming could cause “once-in-a-century” heatwaves annually
- Mar 30, 2025: Widespread Severe Threat Including Strong Tornadoes, Hail, High Winds Ahead For Midwest, South, Easthttps://weather.com/storms/tornado/news/2025-03-28-late-march-severe-weather-tornadoes-wind-hail-midwest-south-east, Storms, The Weather Channel, Sara Tonks, Jonathan Belles & Chris Dolce. A widespread threat of severe thunderstorms will develop Sunday into Monday from the Midwest and South to the East Coast Sunday into Monday.
- Mar 31, 2025: Fossil fuels drive climate, health and biodiversity crises, scientists warn, Phys.org, Center for Biological Diversity .
- Mar 31, 2025: Storms target East Coast after leaving at least 6 dead Sunday, CNN Weather, Matthew Rehbein, Hanna Park and CNN Meteorologists, Mary Gilbert .
- Mar 31, 2025: Big Banks Quietly Prepare for Catastrophic Warming, E&E News/Scientific American, Corbin Hiar. Morgan Stanley, JPMorgan and an international banking group have quietly concluded that climate change will likely exceed the Paris Agreement’s 2 degree C goal and are examining how to maintain profits
- Apr 1, 2025: Global warming of more than 3°C this century may wipe 40% off the world’s economy, new analysis reveals, Environment & Energy, The Conversation AU, Timothy Neal.
- Apr 2, 2025: Destructive tornadoes rake across central US in rare 5 of 5 threat, CNN Weather, CNN Meteorologists Mary Gilbert & Brandon Miller; Eric Levenson, Taylor Romine, Sara Smart & Williams, Emma Tucker, Zenebou Sylla & Amanda Jackson,.
- Apr 3 , 2025 : Thunderstorms trigger catastrophic flooding across the middle of the USDid climate change supercharge the ‘once-in-a-lifetime’ storm pummeling the central US?, Eye on the Storm, Yale Climate Connections, Jeff Masters. A relentless storm is unleashing floods and tornadoes. Here's how a warmer atmosphere and a simmering Gulf of Mexico could be making it worse.
- Apr 3, 2025: Tornadoes devastate central US as threat of historic flooding ramps up, CNN Weather, CNN Meteorologists Mary Gilbert & Brandon Miller; Eric Levenson, Taylor Romine, Sara Smart & Williams, Emma Tucker, Zenebou Sylla & Amanda Jackson,.
- Apr 3, 2025: Climate crisis on track to destroy capitalism, warns top insurer, Environment, The Guardian, Damian Carrington. Action urgently needed to save the conditions under which markets – and civilisation itself – can operate, says senior Allianz figure
- Apr 3, 2025: Forecasters predict another active 2025 Atlantic hurricane season, Eye on the Storm, Yale Climate Connections, Jeff Masters. Colorado State University’s hurricane forecasting team is calling for yet another unusually active season with 17 named storms, nine hurricanes, and four major hurricanes.
- Apr 04, 2025: On the Edge: The people and polar bears of a warming arctic, CBSNews, Erin Hassanzadeh & Aki Nace.
- Apr 4, 2025: Forecast calls for 'catastrophic' floods: Where will it rain the hardest?, UISA TODAY, Doyle Rice.
- Apr 5, 2025: Thunderstorms trigger catastrophic flooding across the middle of the US, CNN Weather, Gene Norman, Karina Tsui & Rebekah Riess.
- Apr 4, 2925: Extreme rainfall brings potentially ‘generational’ flooding to parts of central US already slammed by storms, CNN Weather NN, Hannah Park & Mary Gilbert.
Fact brief - Is Mars warming?
Posted on 5 April 2025 by Sue Bin Park
![]() Skeptical Science is partnering with Gigafact to produce fact briefs — bite-sized fact checks of trending claims. You can submit claims you think need checking via the tipline.
Skeptical Science is partnering with Gigafact to produce fact briefs — bite-sized fact checks of trending claims. You can submit claims you think need checking via the tipline.
Is Mars warming?
Mars’ climate varies due to completely different reasons from Earth’s, and available data indicates no temperature trends comparable to Earth’s recent warming.
Mars lacking oceans or a robust atmosphere means its climate is highly susceptible to external factors. In the longer term, its non-circular orbit causes heating when passing closer to the sun and cooling when further away. In the short term, weather patterns like dust storms impact how much solar heat reaches Mars.
Mars warming would imply that the sun is causing generally rising planetary temperatures. However, total solar heat has decreased since the 1980s. Moreover, analyses of the available 50 years of Mars data found seasonal variability, but no warming trend.
Meanwhile, Earth has warmed 1.5°C (2.7°F) since the 1880s due to the greenhouse effects of human-made CO2. Our best understanding of available Mars data indicates no warming nor mechanisms comparable to Earth’s recent climate change.
Go to full rebuttal on Skeptical Science or to the fact brief on Gigafact
This fact brief is responsive to quotes such as the one highlighted here.
Sources
New Scientist Climate myths: Mars and Pluto are warming too
Nature Global warming and climate forcing by recent albedo changes on Mars
American Geophysical Union Some Coolness on Martian Global Warming and Reflections on the Role of Surface Dust
SPACE.com Mars' atmosphere: Facts about composition and climate
NASA Graphic: Temperature vs Solar Activity
Solar System Research Seasonal Variation of Martian Surface Temperature over Gale Crater and Surroundings
NASA Global Temperature
Skeptical Science New Research for Week #14 2025
Posted on 3 April 2025 by Doug Bostrom, Marc Kodack
Open access notables
A pronounced decline in northern vegetation resistance to flash droughts from 2001 to 2022, Zhang et al., Nature Communications:
Here we show that vegetation resistance to flash droughts declines by up to 27% (±5%) over the Northern Hemisphere hotspots during 2001-2022, including eastern Asia, western North America, and northern Europe. The notable decline in vegetation resistance is mainly attributed to increased vapour pressure deficit and temperature, and enhanced vegetation structural sensitivity to water availability. Flash droughts pose higher ecological risks than slowly-developing droughts during the growing seasons, where ecosystem productivity experiences faster decline rates with a shorter response time. Our results underscore the limited ecosystem capacity to resist flash droughts under climate change.
Climate denial and the classroom: a review, Kutney, Geoscience Communication:
Climate change awareness is floundering across the globe despite climate change education being embedded in international treaties to address the climate crisis – the United Nations Framework Convention on Climate Change (the UNFCCC) and the subsequent Paris Agreement. The Intergovernmental Panel on Climate Change (IPCC) acknowledges forces hostile to climate awareness and education – namely, climate denial sponsored by the energy-industrial complex. Climate change is studied by the physical sciences, but climate denial is the purview of the social sciences; the latter has revealed the why and how of climate denial. Climate-denial organizations (which directly deny aspects of the scientific consensus on climate change) and the related petro-pedagogy groups (which teach that oil is a benefactor to humanity, but say little about the connection of fossil fuels to the climate crisis) have arisen to attempt to interfere with the teaching of the science of climate change in school classrooms. These organizations were found in the United States, Canada, and some European nations (this review is mainly restricted to English-language sources). This review aims to (1) provide an overview of climate denial, promoted and funded by the energy-industrial complex; (2) identify and examine organizations involved in climate denial in schools; (3) summarize the strategies of climate-denial organizations in school classrooms; and (4) put forward recommendations for further research and action.
Most Christian American religious leaders silently believe in climate change, and informing their congregation can help open dialogue, Syropoulos & Sparkman, Proceedings of the National Academy of Sciences:
Nearly 90% of U.S. Christian religious leaders believe in anthropogenic climate change, with most believing human activity is a major contributor. Yet roughly half have never discussed it with their congregation, and only a quarter have mentioned it more than once or twice. U.S. Christians substantially underestimate the prevalence of their leaders who believe in climate change. Providing the actual consensus level of religious leaders’ belief in climate change reduces congregants’ misperception of religious leaders, increases their perception that other church members believe in and are open to discussing climate change, and leads Christians to believe that taking climate action is consistent with their church’s values while voting for politicians who will not take climate action is not.
Why do Australians prefer some climate migrants over others?, Martínez i Coma & Birch, Environmental Politics:
We investigate attitudes toward climate migration in Australia, exploring support for different climate migrants and the role of environmental attitudes in conditioning this support. After confirming the results of previous studies on other countries – climate migrants fall in the middle of the preference scale over migrant types – we offer novel evidence that individuals attaching greater salience to the environment are more likely to distinguish between different types of climate migrants. We attribute this result to the level of cognitive engagement with climate migration. We address these questions via a representative online survey which embeds a conjoint experiment, combined with 25 interviews with federal and state members of parliament. Overall, Australians, and especially those for whom the environment is salient, prefer migrants coming due to rising sea levels over those migrating due to drought. The analysis of the MP interviews suggests a logic to interpret these preferences.
Climate obstruction at work: Right-wing populism and the German heating law, Haas et al., Energy Research & Social Science:
The intense debates surrounding the so-called heating law (Gebäudeenergiegesetz, GEG) in Germany demonstrate that socio-technical transitions and policies aimed at achieving net zero should be conceptualized as socially contested processes to adequately reflect their societal and political character. We argue that more recent research on sustainable transitions that looks at the role of incumbent actors, and especially the concept of ‘climate obstruction’ is helpful for better understanding the delay of climate policies. Based on this assumption, we analyze the campaign against the law and identify five central discursive strands brought forward to dismantle the law: Expropriation (1), Disenfranchisement (2), Ideological Driven (3), Green Cronyism (4), and Demand to Take Everyone Along (5).
From this week's government/NGO section:
Consecutive extreme heat and flooding events in Argentina highlight the risk of managing increasingly frequent and intense hazards in a warming climate, Zachariah et al., World Weather Attribution
To assess to what extent human-induced climate change altered the likelihood and intensity of the heavy precipitation leading to the severe flooding in Argentina, as well as the extreme heat the authors undertook an attribution study for the extreme rainfall in the most affected region, that coincides with the area where flood warnings were in place. Climate models show that climate change is making such temperatures much more frequent and intense. However, the increase in the models is smaller than in reanalysis products and thus likely underestimating the effect of climate change. Nevertheless, looking at the future, models show a very strong trend that increases with future warming, rendering such an event a common occurrence in a 2.6°C warmer climate compared to pre-industrial. The influence of climate change on the rainfall event is much less clear. While all of the 35 available weather stations in the area show an increase in the intensity of heavy rainfall of between 7-30% associated with global warming of 1.3°C, this is not represented in any of the available gridded reanalysis products which show on average a decreasing trend.
State of the Climate in Latin America and the Caribbean 2024, Marengo et al., World Meteorological Organization
The authors provide the status of key climate indicators and information on climate-related impacts and risks. They address specific physical science, socio-economic, and policy-related aspects that are relevant to Latin America and the Caribbean and respond to Members needs in the fields of climate monitoring, climate change, and climate services. For example, the mean temperature in Latin America and the Caribbean in 2024 was +0.90 °C above the 1991–2020 average, making 2024 the warmest or second warmest year on record, depending on the dataset used.
118 articles in 55 journals by 809 contributing authors
Physical science of climate change, effects
The greater role of Southern Ocean warming compared to Arctic Ocean warming in shifting future tropical rainfall patterns, Park et al., Open Access pdf 10.21203/rs.3.rs-5139656/v1
Observations of climate change, effects
Abrupt sea level rise and Earth’s gradual pole shift reveal permanent hydrological regime changes in the 21st century, Seo et al., Science 10.1126/science.adq6529
Two-part webinar about the scientific consensus on human-caused global warming
Posted on 2 April 2025 by BaerbelW, John Cook
In February 2025, John Cook gave two webinars for republicEN explaining the scientific consensus on human-caused climate change.
20 February 2025: republicEN webinar part 1 - BUST or TRUST? The scientific consensus on climate change
In the first webinar, Cook explained the history of the 20-year scientific consensus on climate change. How do we know there’s a scientific consensus on climate change? How did we get there, and what exactly does it all mean?
The webinar "Bust or Trust? The scientific consensus on climate change," focused on establishing that there is a scientific consensus on climate change and how to communicate that effectively.
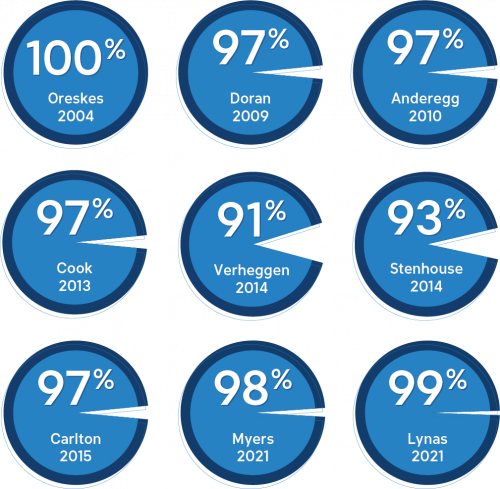
The existence of a scientific consensus is supported by multiple studies conducted over the past 15 years. These studies consistently show that over 90% of climate experts agree that humans are causing global warming, with many studies finding agreement around 97-98%. This consensus has been demonstrated through various research methods, including surveys of scientists and analyses of published climate papers.
Despite this overwhelming scientific agreement, public perception of the consensus remains low. Only 30-50% of people believe that scientists agree on global warming. This gap between scientific consensus and public perception is due to several factors, including cultural and political biases, misinformation, and a lack of awareness. The webinar emphasized the importance of effectively communicating the scientific consensus to bridge this gap and promote informed action on climate change.
The first presentation can be downloaded as a PDF (5MB).
Sabin 33 #22 - How does waste from wind turbines compare to waste from fossil fuel use?
Posted on 1 April 2025 by Ken Rice
On November 1, 2024 we announced the publication of 33 rebuttals based on the report "Rebutting 33 False Claims About Solar, Wind, and Electric Vehicles" written by Matthew Eisenson, Jacob Elkin, Andy Fitch, Matthew Ard, Kaya Sittinger & Samuel Lavine and published by the Sabin Center for Climate Change Law at Columbia Law School in 2024. Below is the blog post version of rebuttal #22 based on Sabin's report.
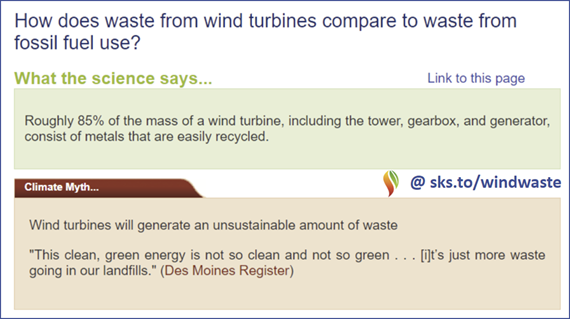
Roughly 85% of the mass of a wind turbine, including the tower, gearbox, and generator, consist of metals that are easily recycled1 (also Khalid et al. 2023). The remaining 15%, including the blades, consist of composite-based materials, such as fiberglass, that are more difficult to recycle (Khalid et al. 2023). However, new technologies are in development for recycling turbine blades, and turbine blades are in fact being recycled in some facilities2 (also Jensen & Skelton 2023). A recent breakthrough supported by the Department of Energy enabled all turbine components to be recycled3, and private companies in the United States have begun developing turbine blade recycling plants.4
One study from 2017 estimated that global annual waste of turbine blades will reach 2.9 million metric tons per year by 2050, with a total of 43 million metrics tons in cumulative waste generated between 2018 and 2050 (Liu & Barlow 2017). This is not insignificant. However, Nature Physics has projected that global cumulative waste from fossil fuel-based power generation between 2016 to 2050 is expected to produce roughly 45,550 million metric tons of coal ash alone, along with 249 million metric tons of oily sludge (Mirletz et al. 2023). In other words, the cumulative waste from coal ash is expected to be roughly 1,000 times greater than that of turbine blades, and the cumulative waste of oily sludge is expected to be about 5-6 times greater than that of turbine blades. Importantly, both coal ash and oily sludge are known to be toxic. For further context, in the United States alone, roughly 600 million short tons, or 544 million metric tons, of construction and demolition debris were generated across all sectors in 2018.5 In effect, the annual construction and demolition waste in the United States alone is roughly 187 times greater than the anticipated annual waste from wind turbine blades across the globe in 2050.


